


Like
Share


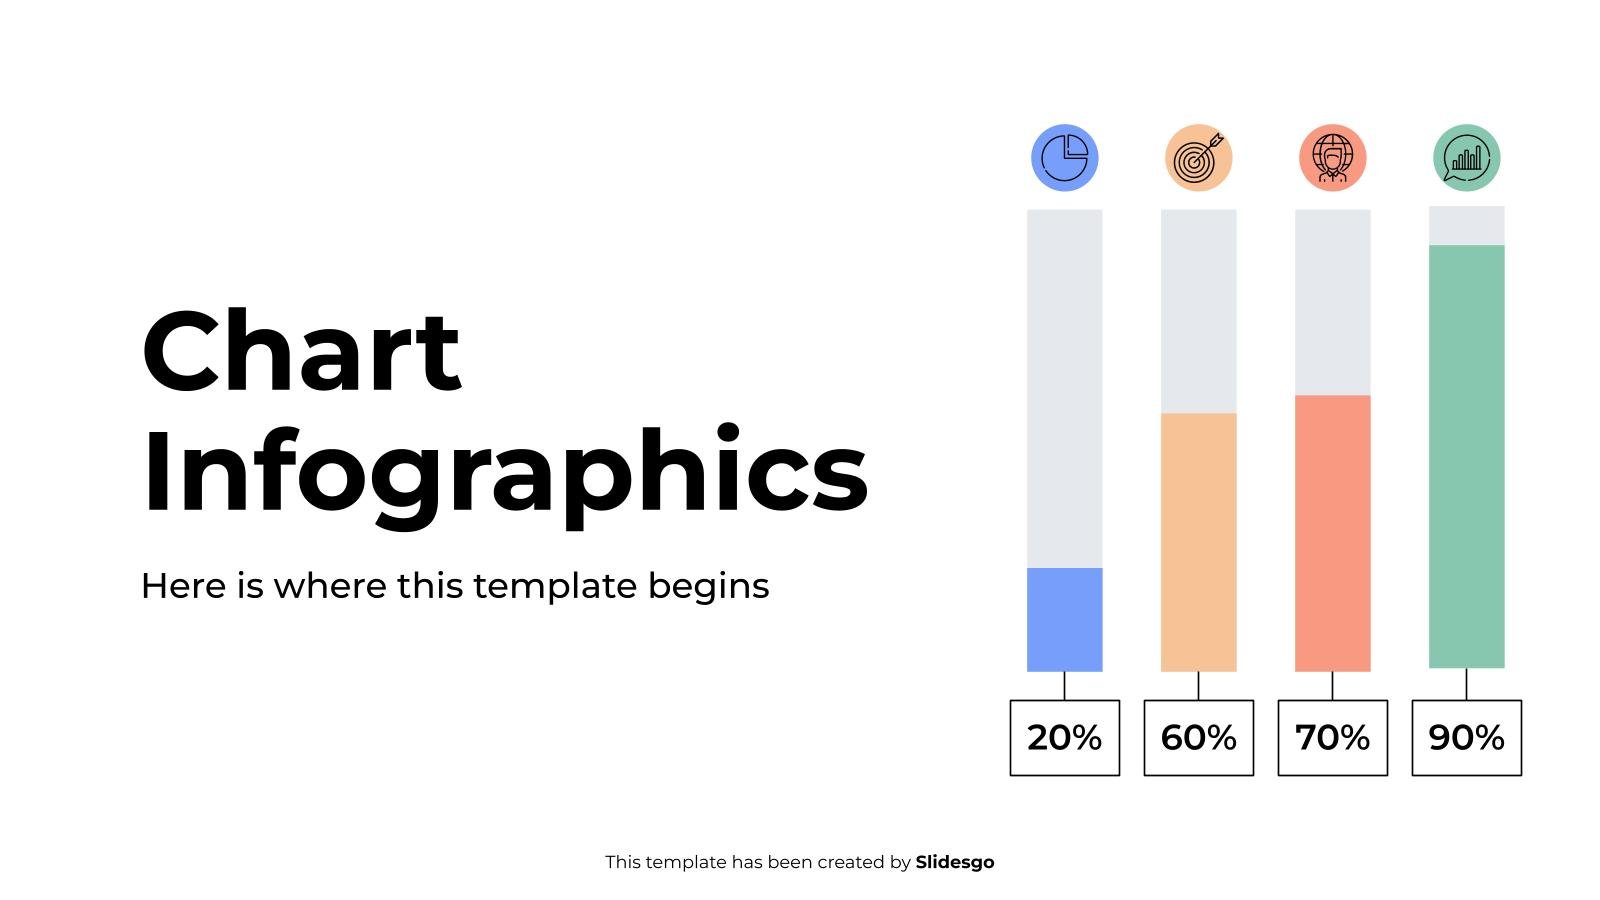
Pie Chart Infographics
Free template
Pie charts are powerful visual tools, and you can use them to represent and compare percentages or proportions. They are useful when presenting data about your company, when describing your buyer persona, or even for medical or educational topics. They look like pies or even donuts, and each element represents a slice. Yummy!
Features of these infographics
- Circular infographics and chart visualizations
- 100% editable and easy to modify
- 31 different infographics to boost your presentations
- Include icons and Flaticon’s extension for further customization
- Designed to be used in Google Slides, Canva, and Microsoft PowerPoint and Keynote
- 16:9 widescreen format suitable for all types of screens
- Include information about how to edit and customize your infographics
- Learn more in How to use this template?
Ads

Register for free and start downloading now
Register on our website to download 3 FREE templates every month, or GO Premium for unlimited downloads!
Related templates

/
Like
Download
/
Like
Download
/
Like
Download
/
Like
Download
/
Like
Download

/
Like
Download

/
Like
Download
/
Like
Download

/
Like
Download

/
Like
Download

/
Like
Download

/
Like
Download

/
Like
Download

/
Like
Download
/
Like
Download
Popular templates

/
Like
Download
Generate content with AI

/
Like
Download
Generate content with AI

/
Like
Download

/
Like
Download

/
Like
Download

/
Like
Download
Generate content with AI