Infographics Presentation templates
Discover our engaging Google Slides and PowerPoint slides full of infographics to present your information or data clearly and quickly!


It seems that you like this template!

Register for free and start downloading now
Download the Monthly KPIs Overview Infographics template for PowerPoint or Google Slides to get the most out of infographics. Whether you want to organize your business budget in a table or schematically analyze your sales over the past year, this set of infographic resources will be of great help. Start...
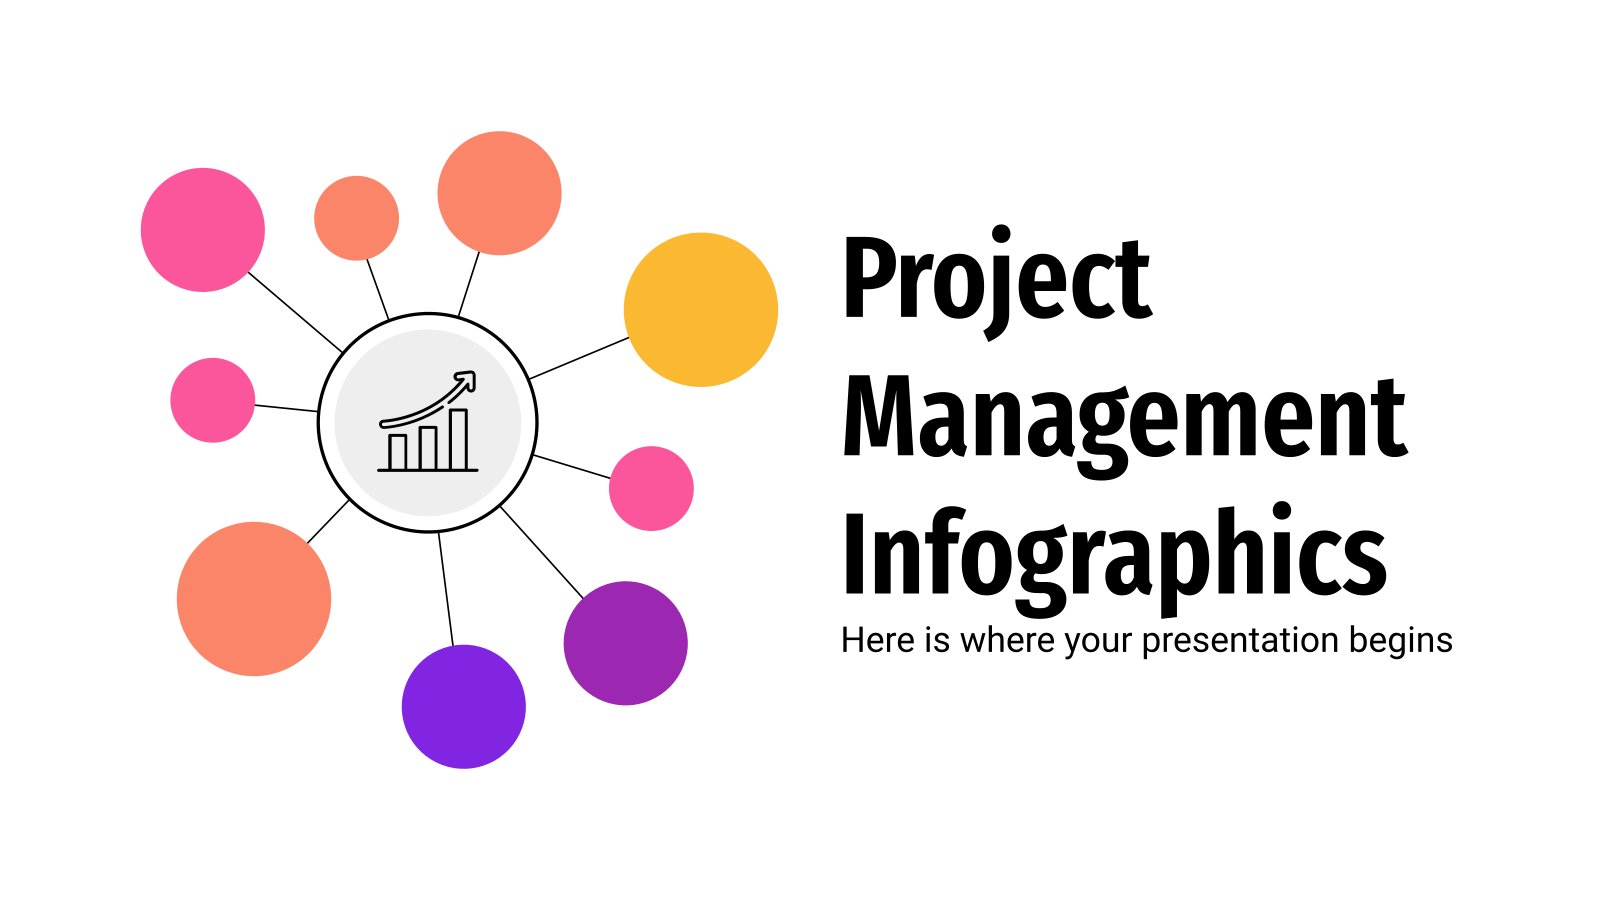
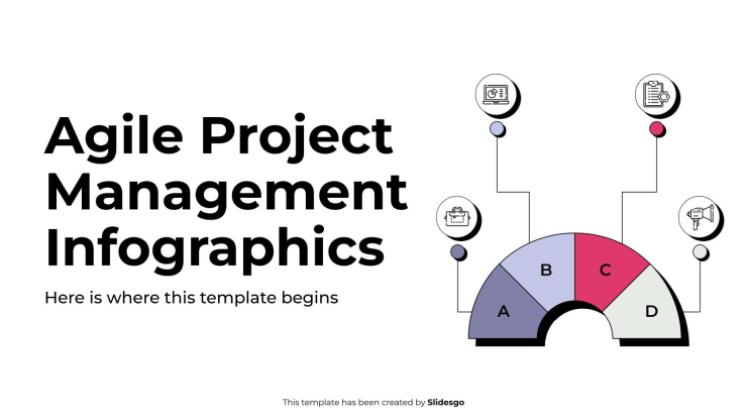
Do you want to present your business or company data in an effective way? Go ahead and use these Project Management Infographics. They contain a lot of different designs: circular, arrows, paths… We have created them using yellow, orange, pink and purple hues and plenty of icons that you can...

Download the Community Service Initiative presentation for PowerPoint or Google Slides and start impressing your audience with a creative and original design. Slidesgo templates like this one here offer the possibility to convey a concept, idea or topic in a clear, concise and visual way, by using different graphic resources....
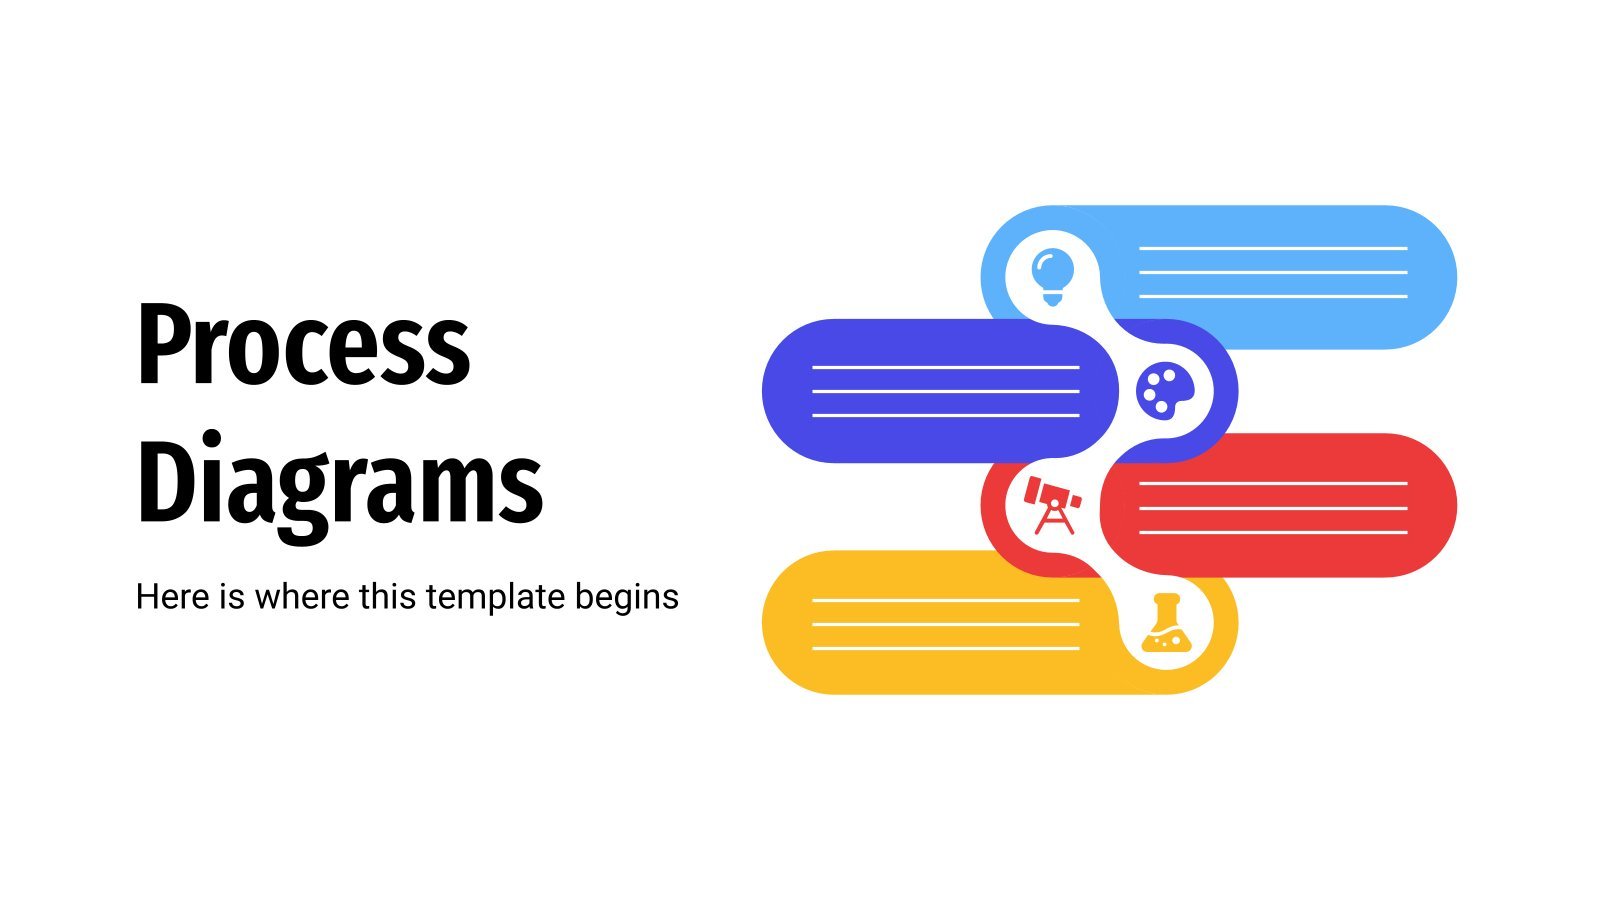
If you want to present the progress of your sales, project plan or manufacturing activities, process diagrams will be your best friends. They have the ability to develop a clear description of a process, step by step. They are pretty useful to achieve better communication with other people involved in...

Download the Types of Business Structures Infographics template for PowerPoint or Google Slides to get the most out of infographics. Whether you want to organize your business budget in a table or schematically analyze your sales over the past year, this set of infographic resources will be of great help....
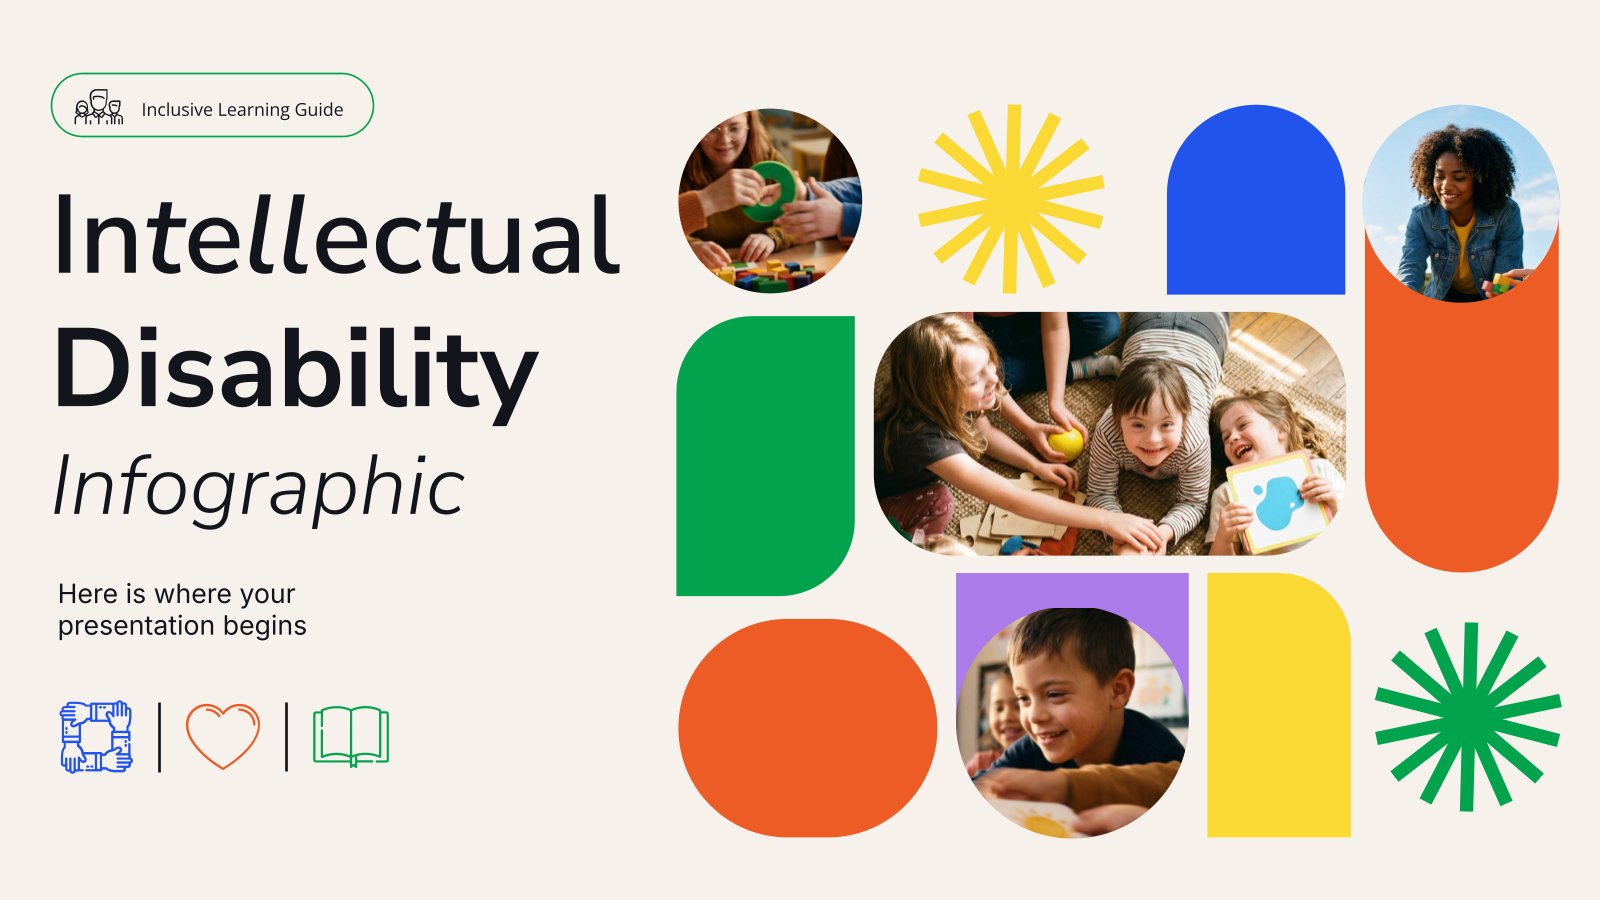
Download the Intellectual Disability Infographic presentation for PowerPoint or Google Slides and start impressing your audience with a creative and original design. Slidesgo templates like this one here offer the possibility to convey a concept, idea or topic in a clear, concise and visual way, by using different graphic resources....
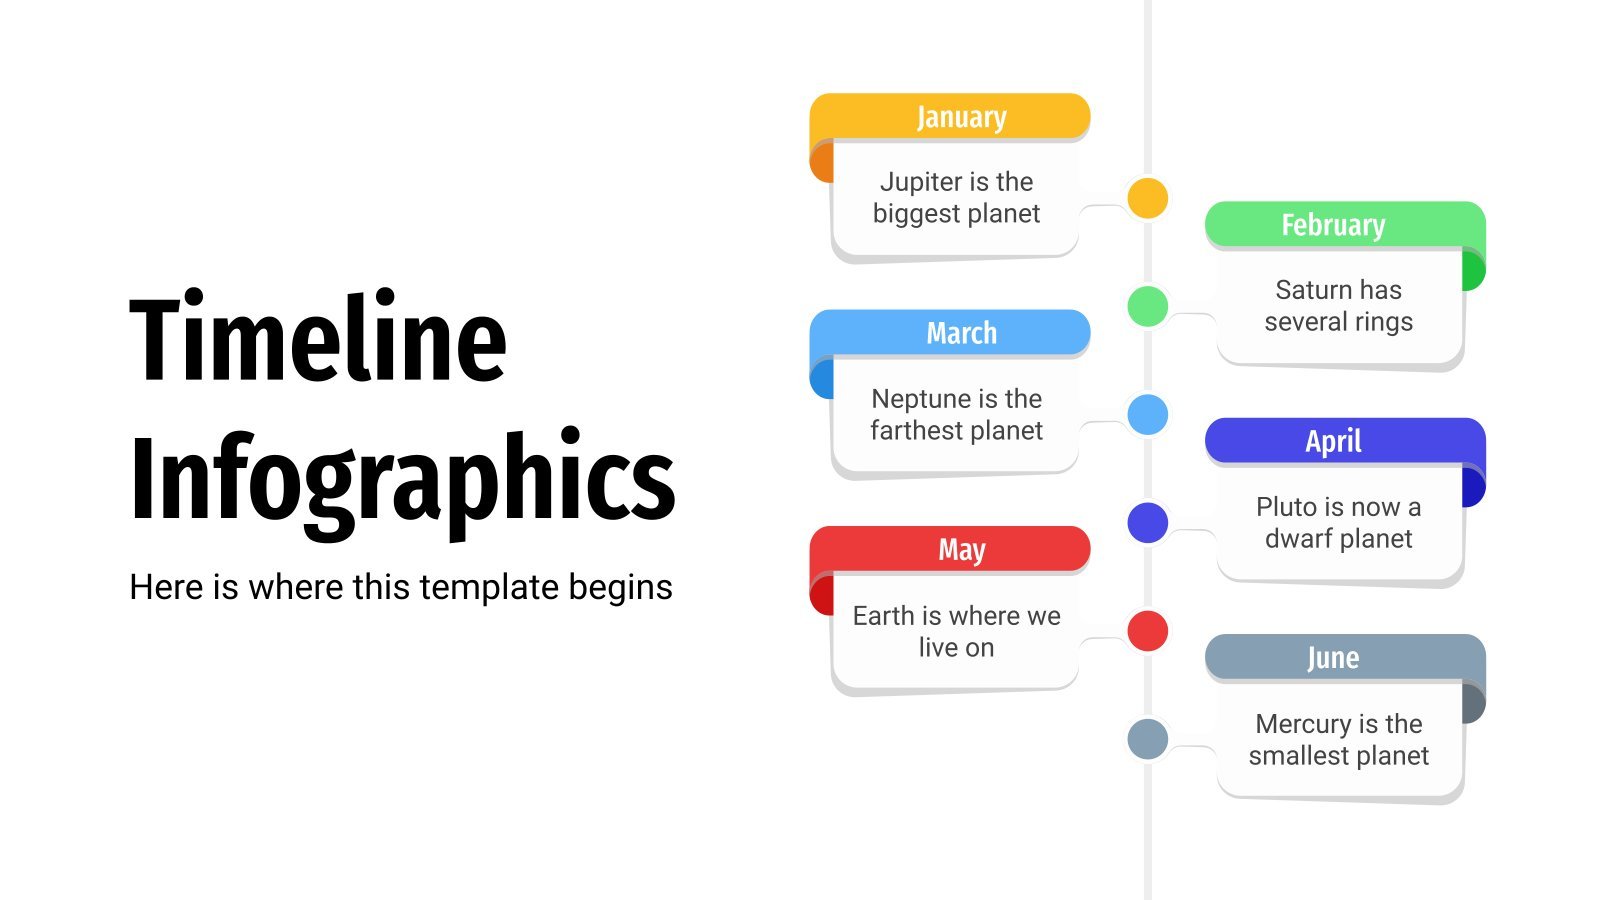
Timeline infographics are simply great if you need to create a list of events, steps or processes in chronological order or if you want to mark some milestones! Never miss a key action, a date or a deadline again! They are very visual, clear to follow and logical.
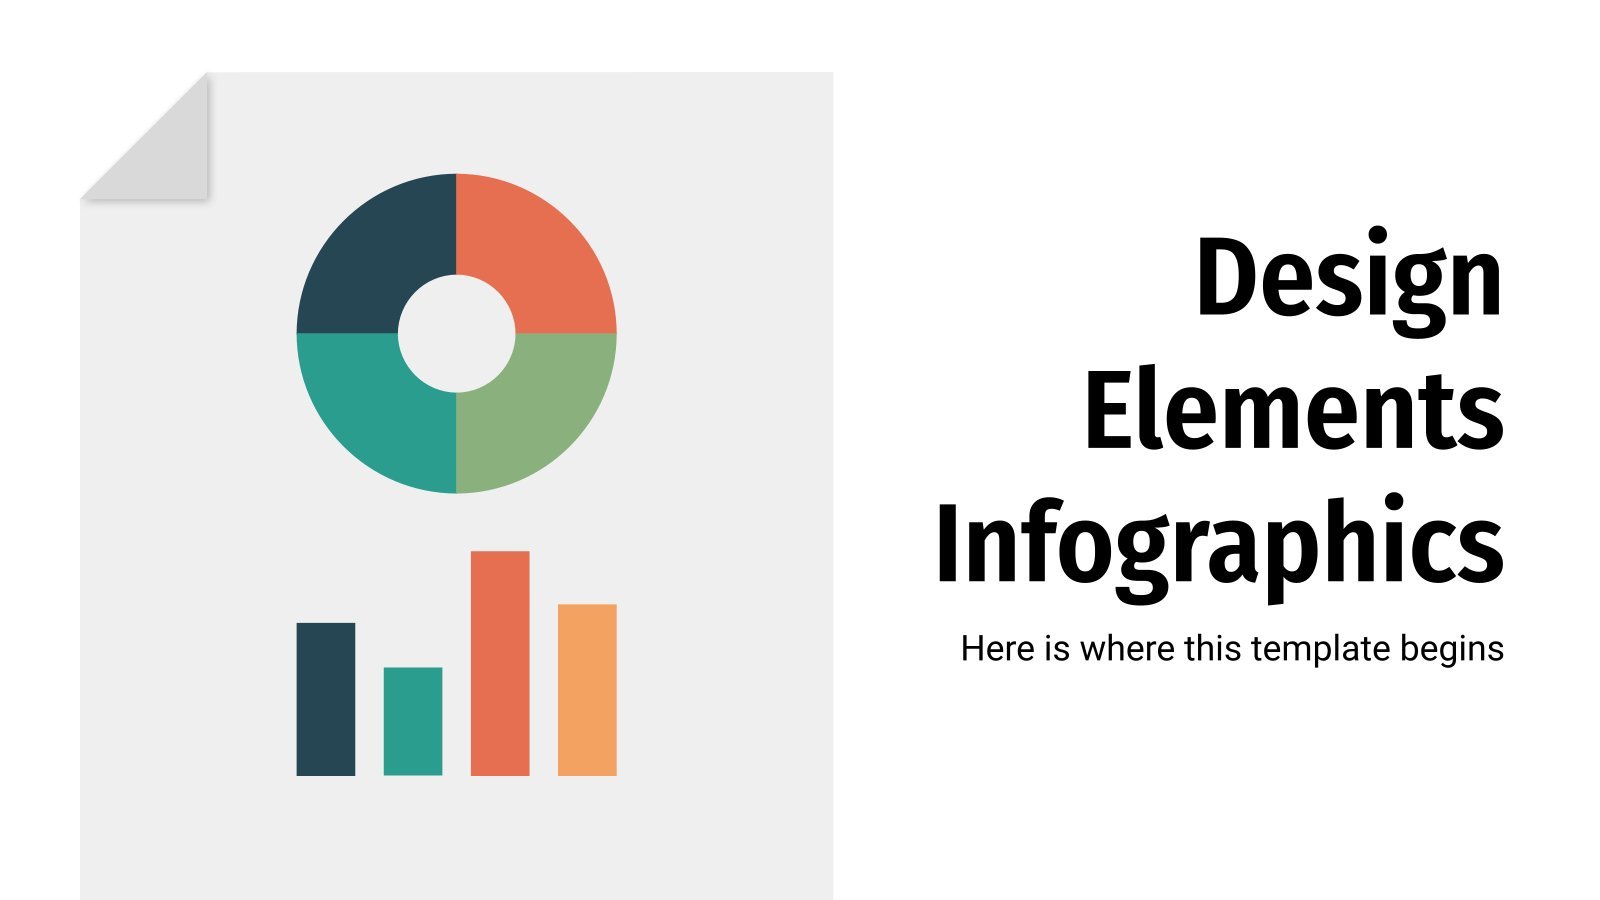
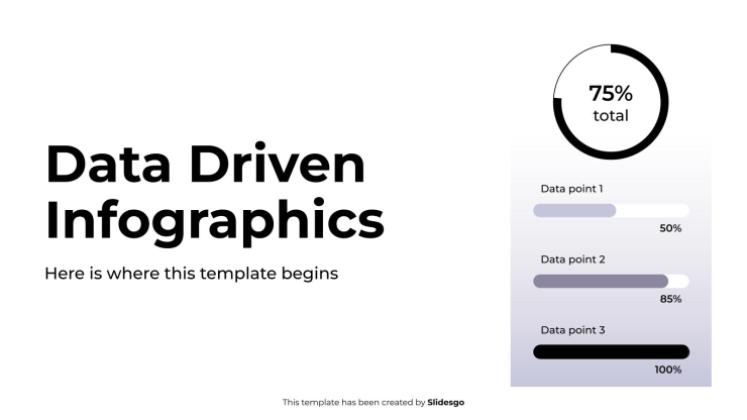
This new set of infographics is a jack of all trades. We have created different designs, not tied to a specific topic or purpose, which means they're suitable for the majority of the uses you might come up with. From timelines to graphs, from percentage bars to pie charts. Various...
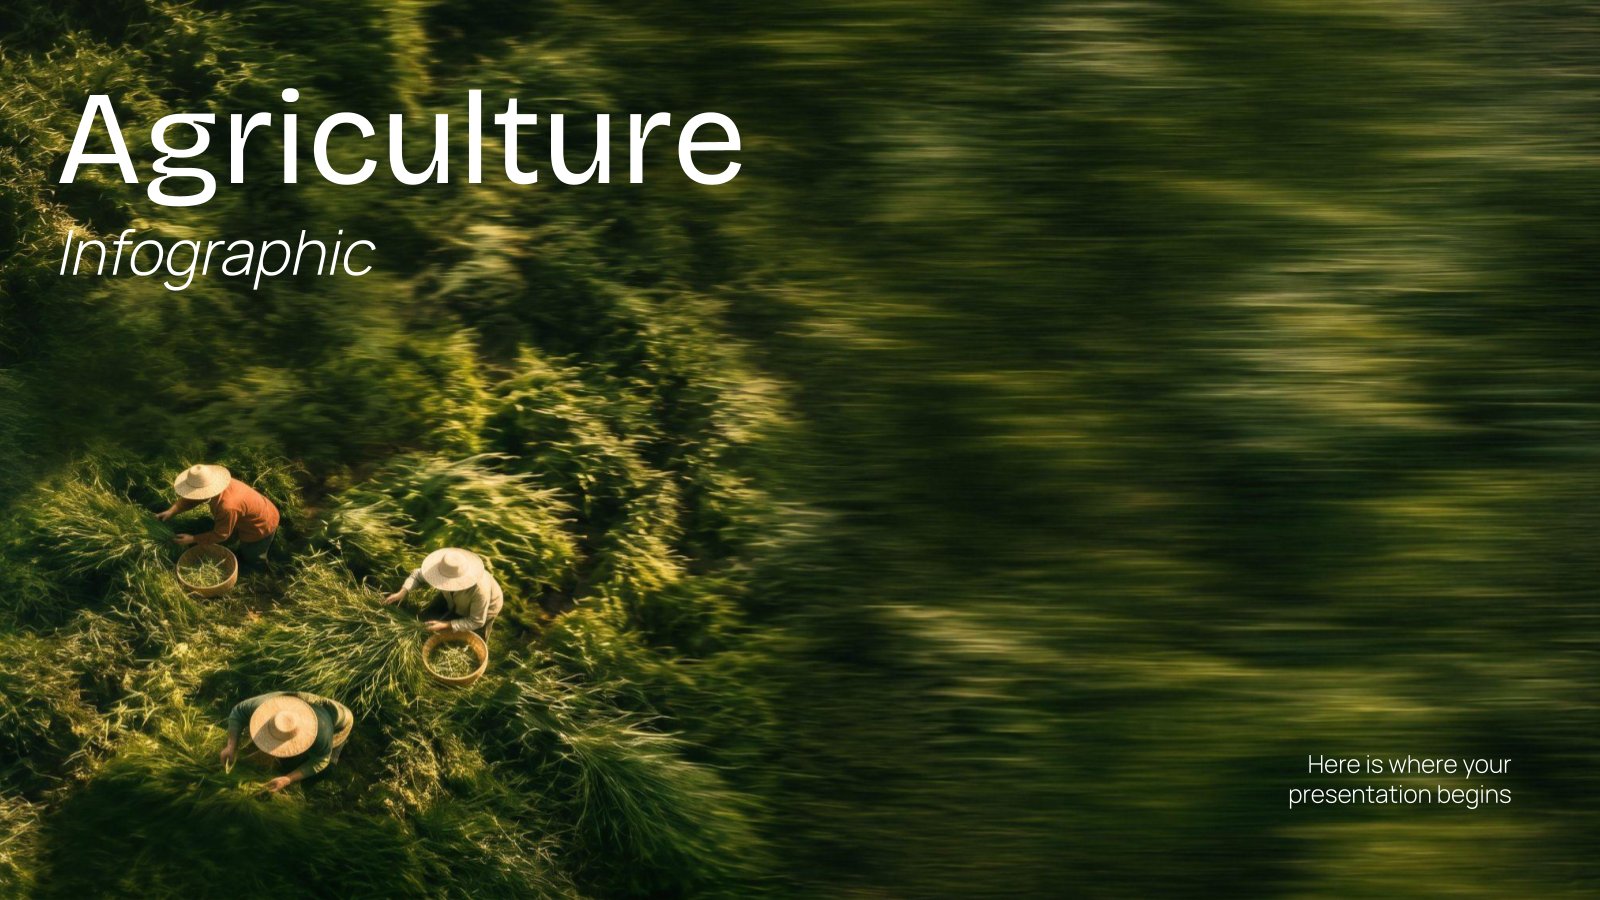
Download the Agriculture Infographic presentation for PowerPoint or Google Slides and start impressing your audience with a creative and original design. Slidesgo templates like this one here offer the possibility to convey a concept, idea or topic in a clear, concise and visual way, by using different graphic resources. You...

Download the Mental Health Infographic presentation for PowerPoint or Google Slides and start impressing your audience with a creative and original design. Slidesgo templates like this one here offer the possibility to convey a concept, idea or topic in a clear, concise and visual way, by using different graphic resources....

Download the Roadblock Slideshow Infographics template for PowerPoint or Google Slides to get the most out of infographics. Whether you want to organize your business budget in a table or schematically analyze your sales over the past year, this set of infographic resources will be of great help. Start using...

Download the Business Diagram Infographics template for PowerPoint or Google Slides to get the most out of infographics. Whether you want to organize your business budget in a table or schematically analyze your sales over the past year, this set of infographic resources will be of great help. Start using...
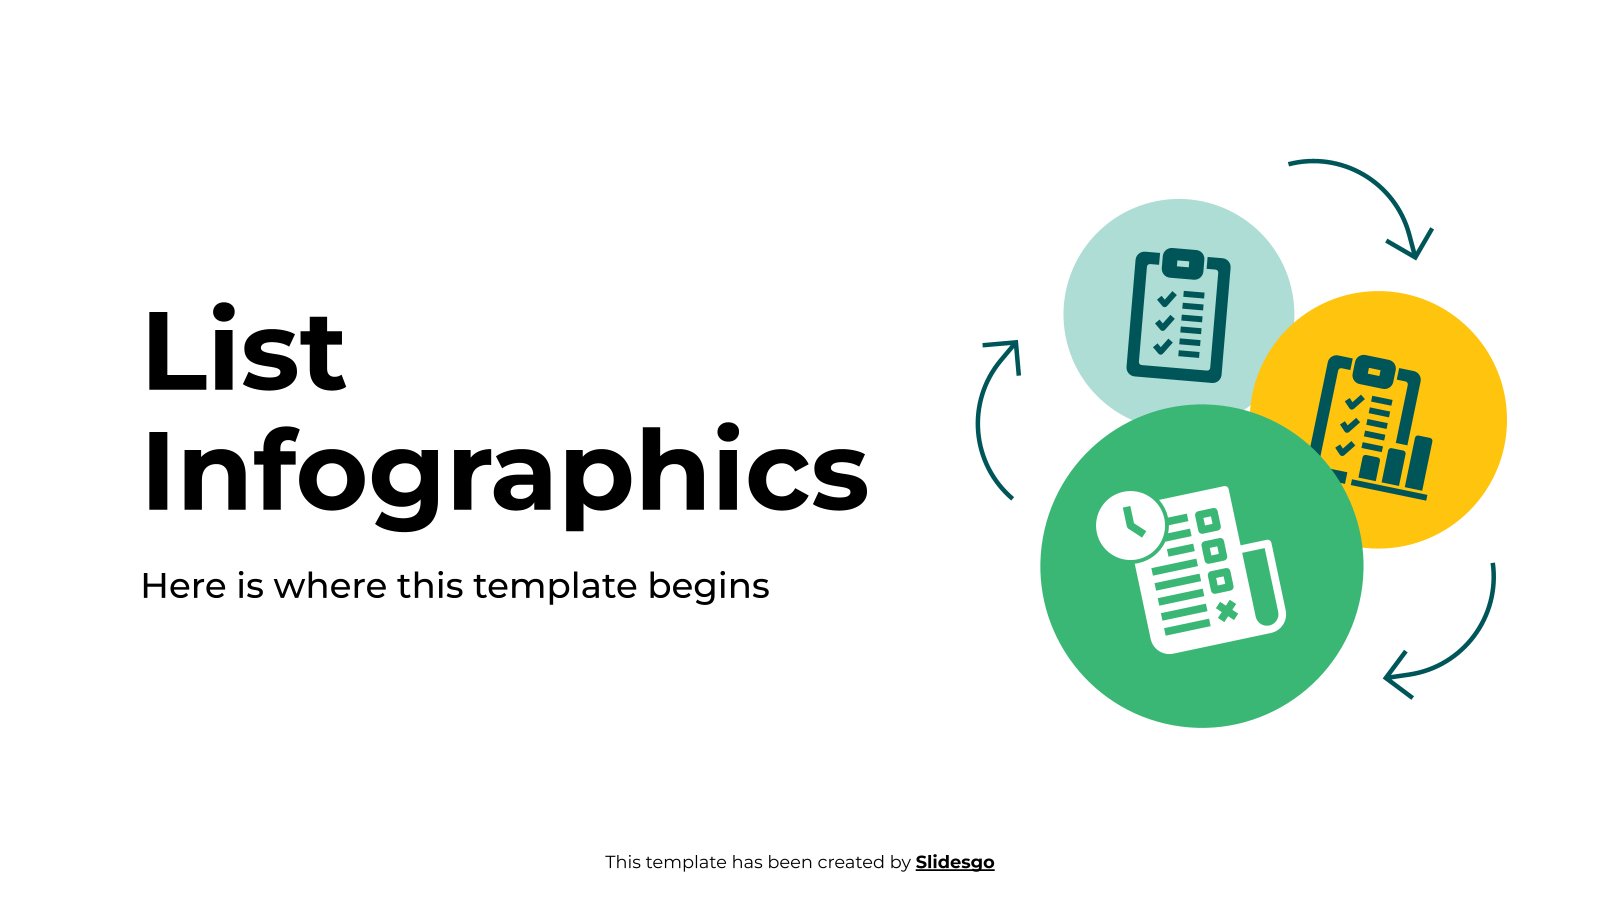
Download the "List Infographics" template for PowerPoint or Google Slides and discover the power of infographics. An infographic resource gives you the ability to showcase your content in a more visual way, which will make it easier for your audience to understand your topic. Slidesgo infographics like this set here...
Download the Gender Infographic presentation for PowerPoint or Google Slides and start impressing your audience with a creative and original design. Slidesgo templates like this one here offer the possibility to convey a concept, idea or topic in a clear, concise and visual way, by using different graphic resources. You...
Download the "Arrow Infographics" template for PowerPoint or Google Slides and discover the power of infographics. An infographic resource gives you the ability to showcase your content in a more visual way, which will make it easier for your audience to understand your topic. Slidesgo infographics like this set here...

Download the Steps Infographics template for PowerPoint or Google Slides to get the most out of infographics. Whether you want to organize your business budget in a table or schematically analyze your sales over the past year, this set of infographic resources will be of great help. Start using infographics...

Do you need some timelines to present the stages of a certain process or project? We have designed many of them. Have a look at the gradients and the different designs: flat, lineal, geometric or hand-drawn. We include 4 to 7 septions per timeline.

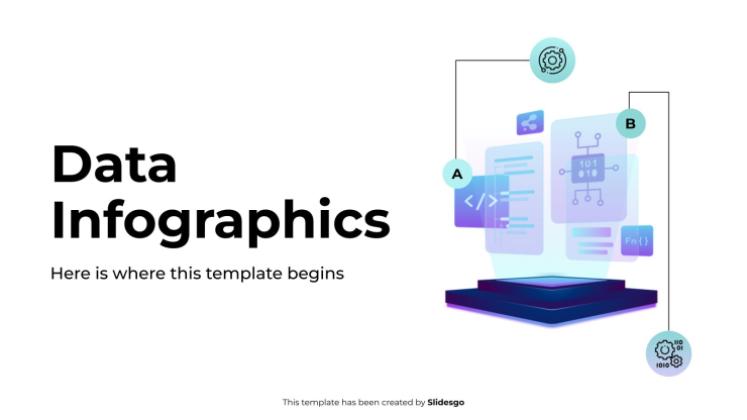
The designs included in this new template have something in common: all of them have some kind of technological motif. You’ll find many infographics with devices and icons supporting the circular, isometric, roadmap-like and even hexagonal layouts. and the number of sections range between three and six per slide.