


Like
Share


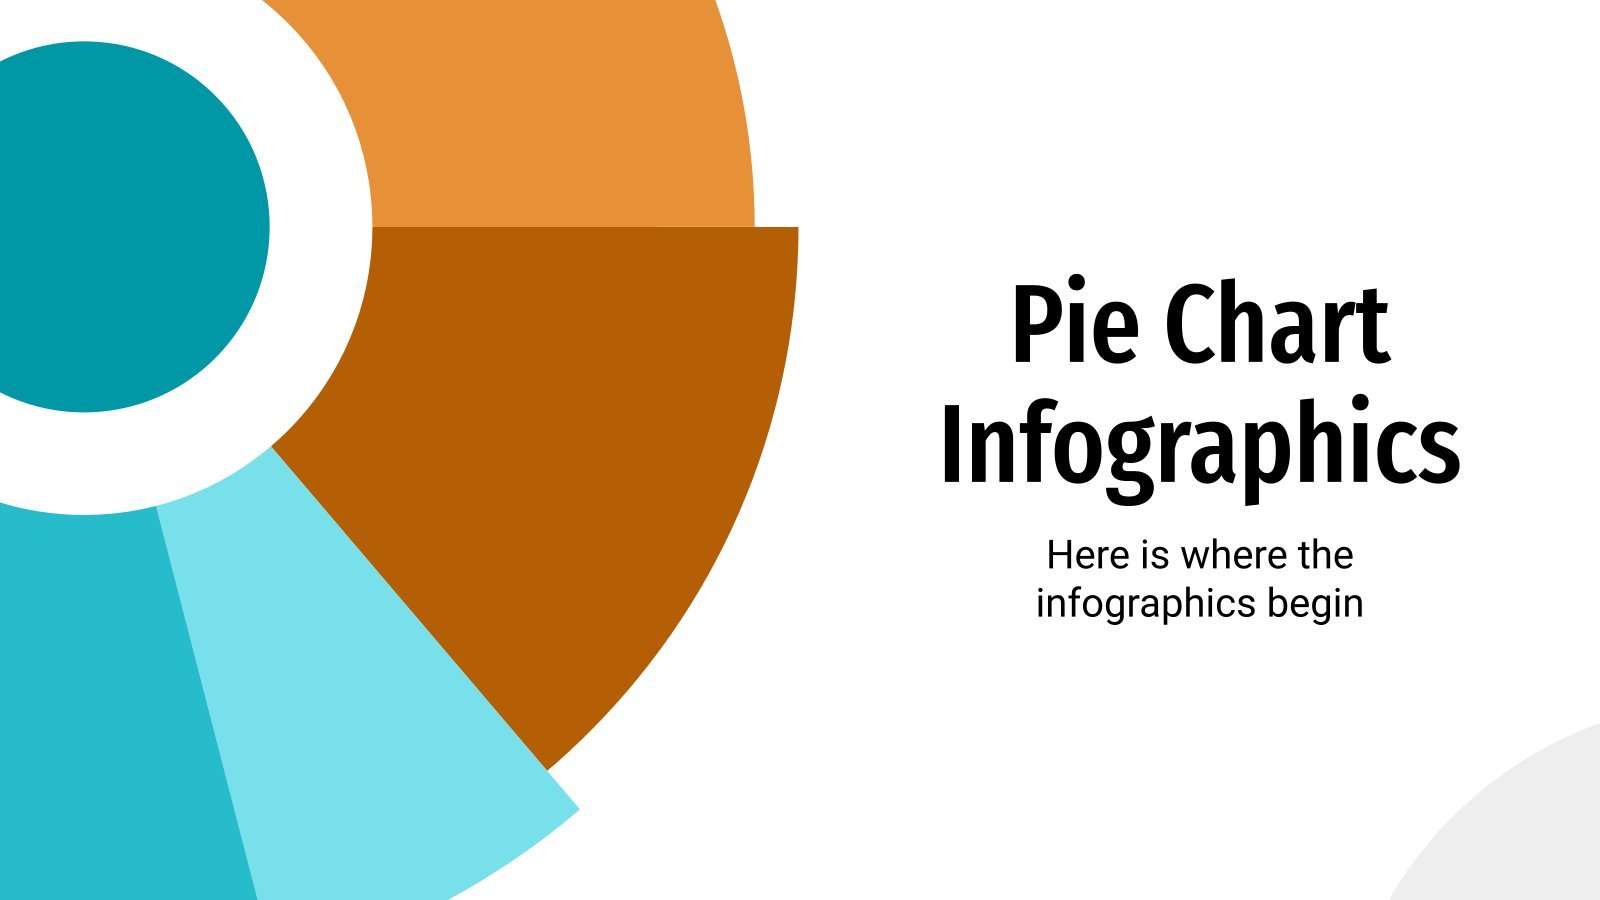
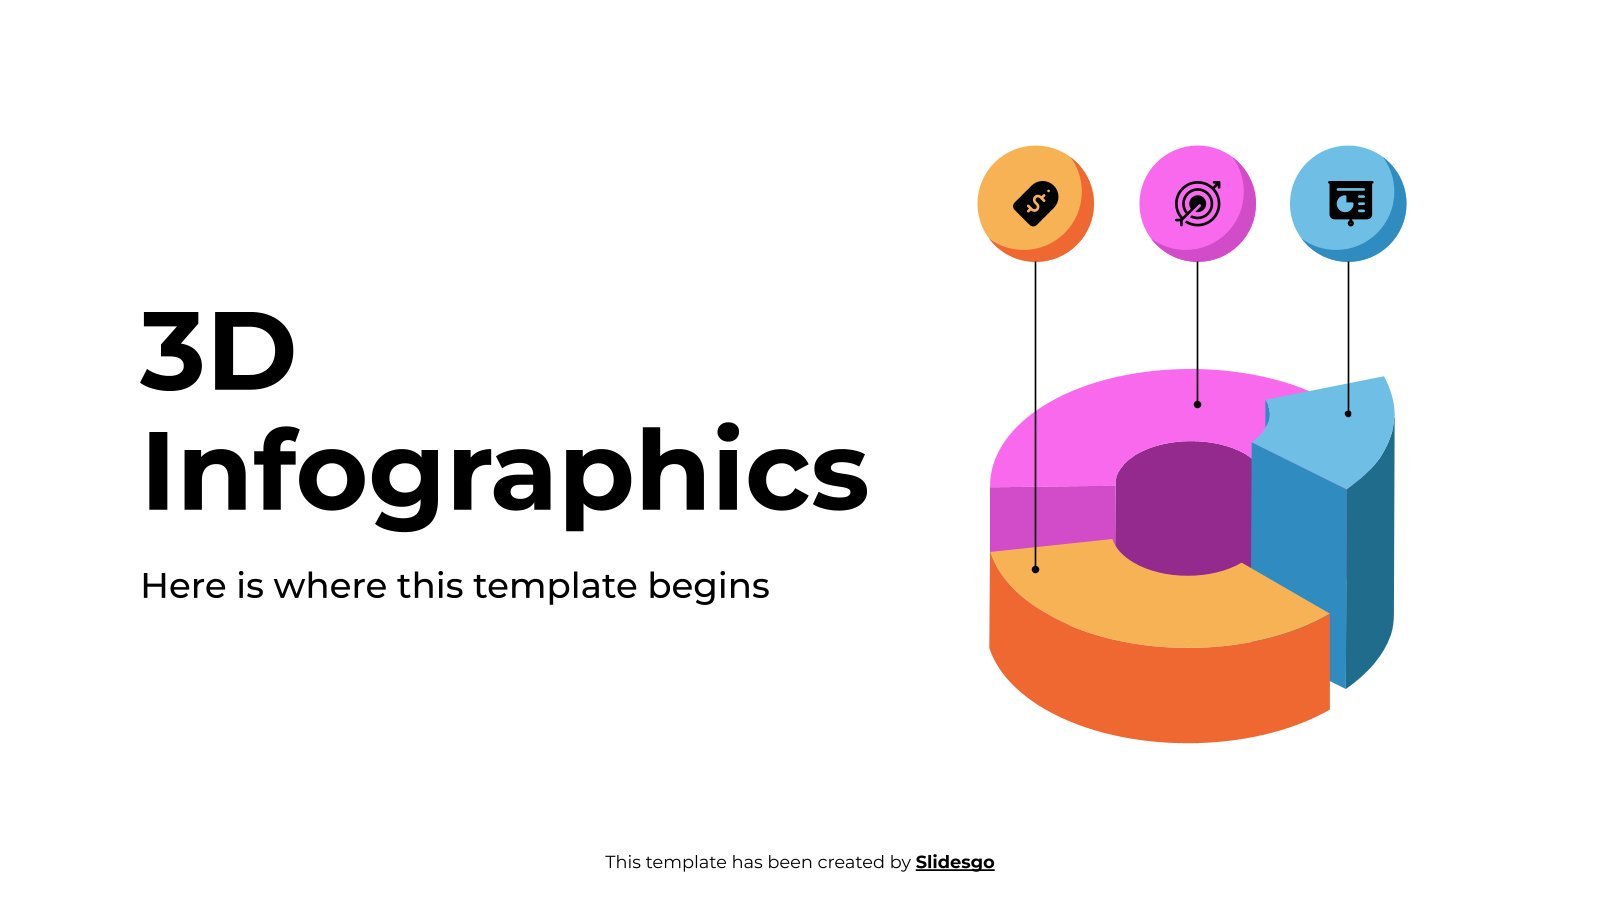
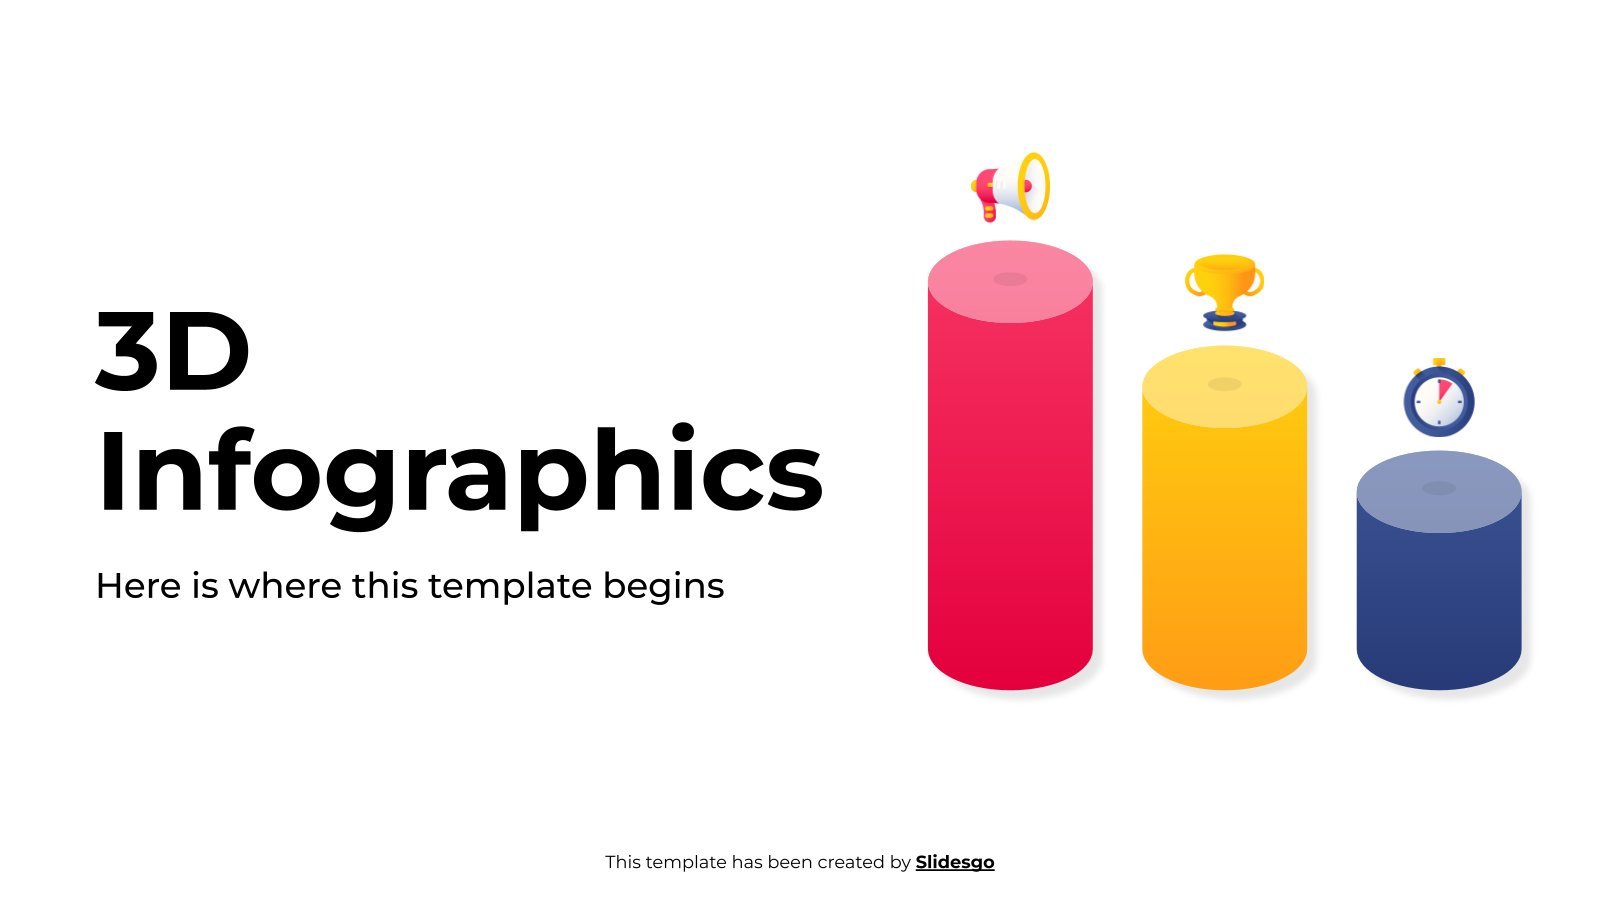
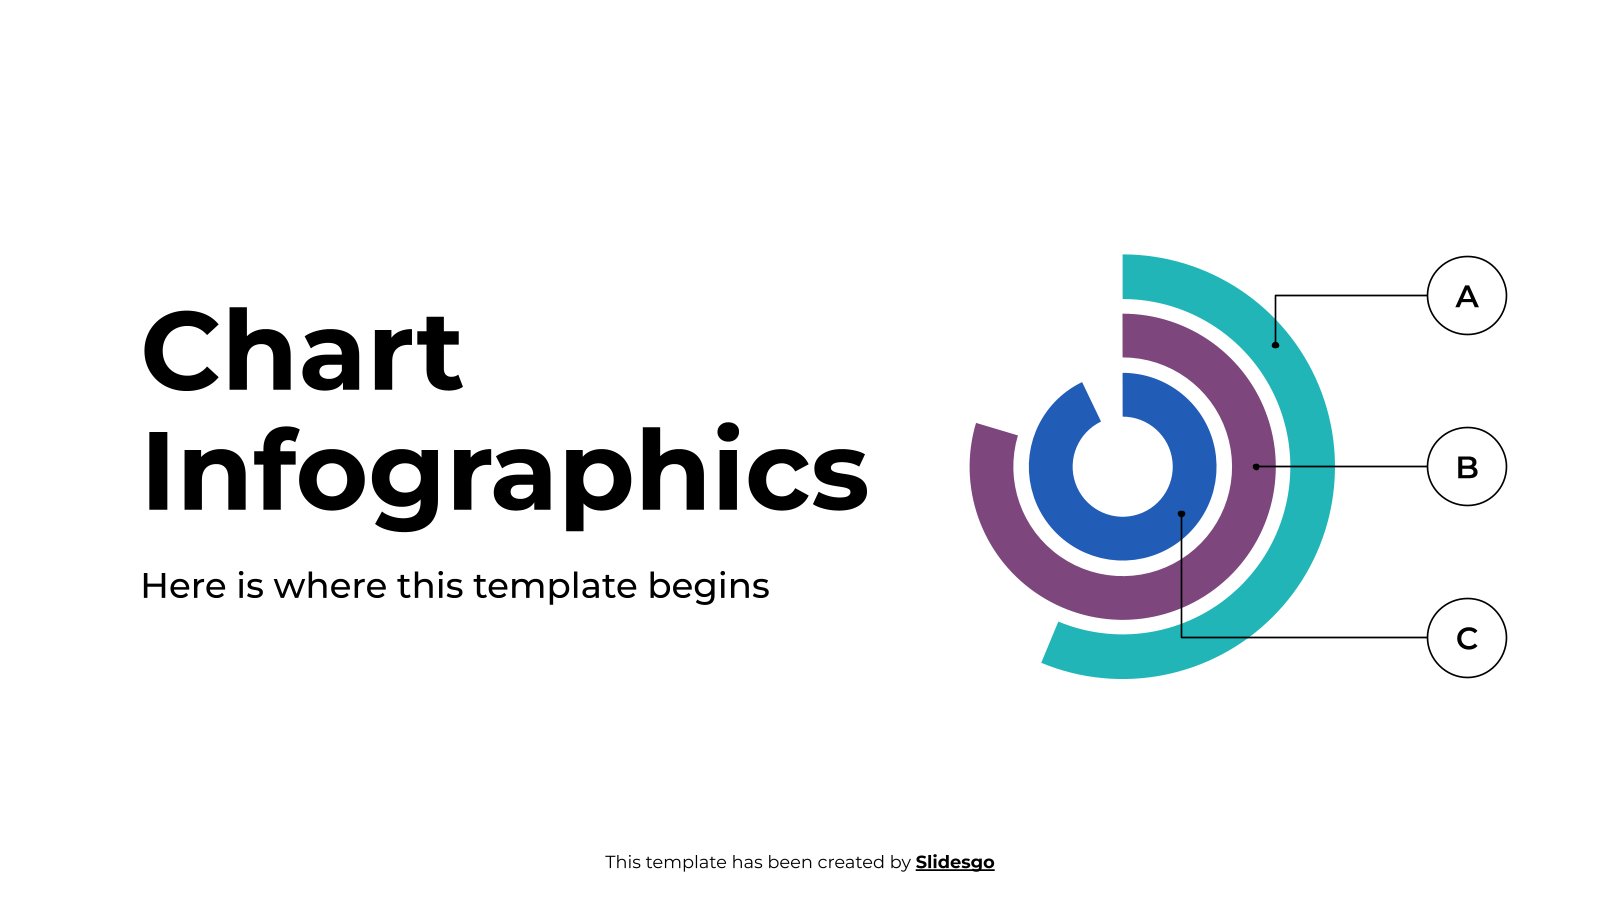
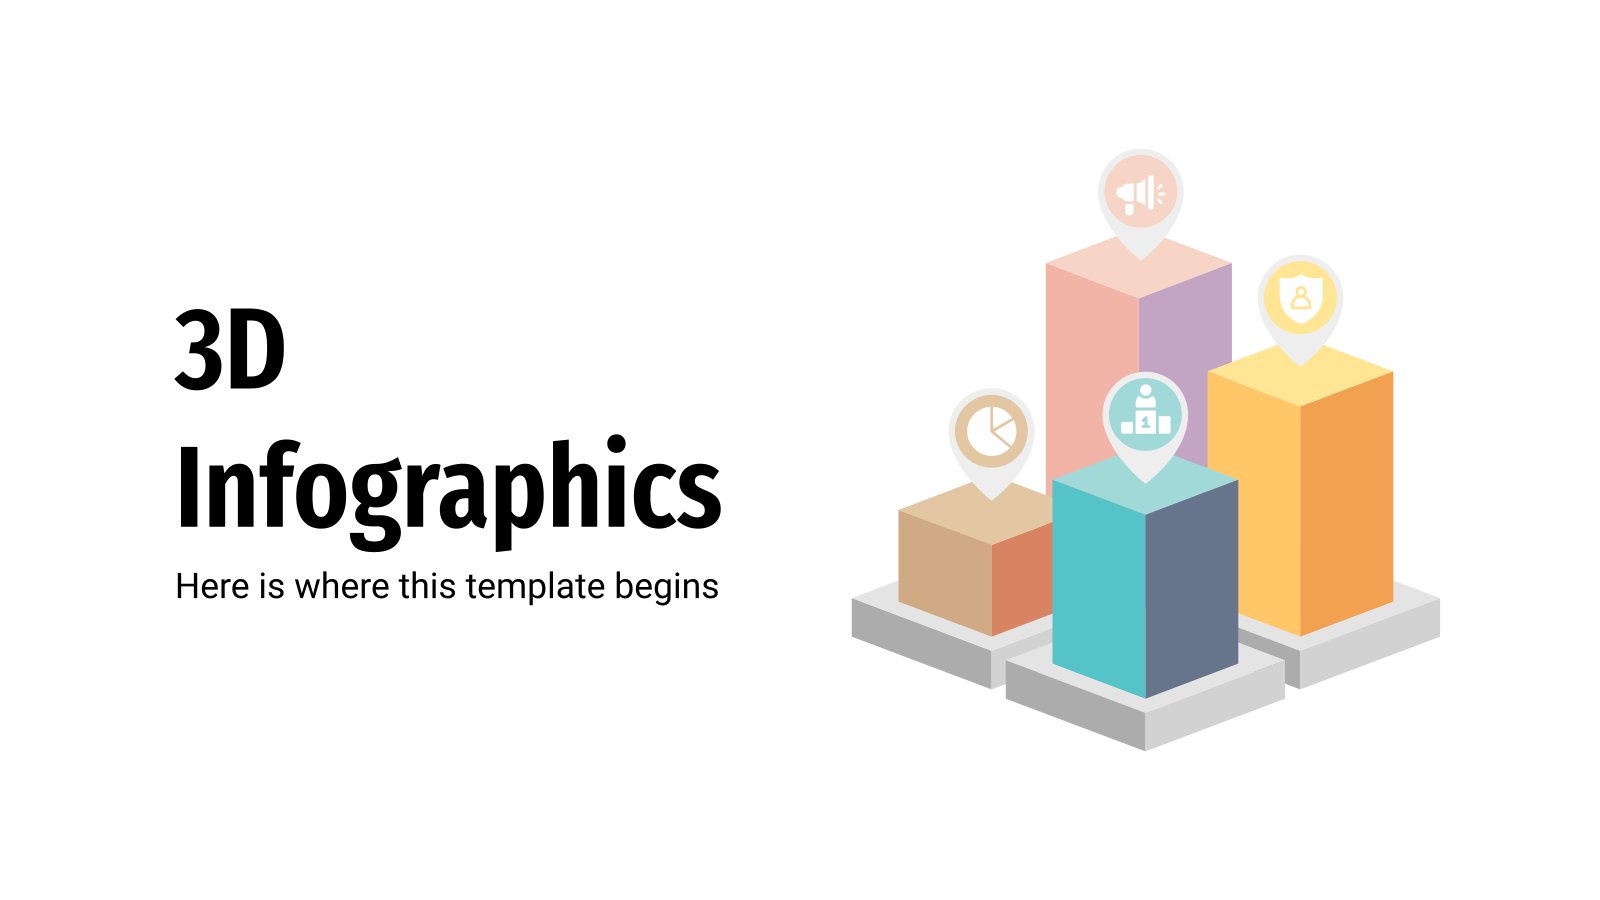
3D Pie Charts Infographics
Free template
The popularity and clarity of pie charts make them the queen of all graphs! At a glance, you can see the percentage that corresponds to each slice, and if various colors are used too... the better! Slidesgo has this new template for you, which is a collection of around thirty designs of pie charts in perspective, so they look three-dimensional. Almost all of them are editable from a spreadsheet, so you bet you'll be saving a lot of time!
Features of these infographics
- 100% editable and easy to modify
- 31 different infographics to boost your presentations
- Include icons and Flaticon’s extension for further customization
- Designed to be used in Google Slides, Canva, and Microsoft PowerPoint and Keynote
- 16:9 widescreen format suitable for all types of screens
- Include information about how to edit and customize your infographics
- Learn more in How to use this template?
Ads

Register for free and start downloading now
Register on our website to download 3 FREE templates every month, or GO Premium for unlimited downloads!
Related templates
/
Like
Download

/
Like
Download
/
Like
Download
/
Like
Download

/
Like
Download
/
Like
Download
/
Like
Download
/
Like
Download
/
Like
Download

/
Like
Download

/
Like
Download
/
Like
Download

/
Like
Download
/
Like
Download
/
Like
Download
Popular templates

/
Like
Download
Generate content with AI

/
Like
Download

/
Like
Download
Generate content with AI

/
Like
Download
Generate content with AI

/
Like
Download

/
Like
Download