Diagram Infographics Presentation templates
Do you have some concepts that are related to each other? It's good to put your trust in infographics, especially if you want leave your audience in awe and clapping!


It seems that you like this template!

Register for free and start downloading now
Download the Diagram Infographics template for PowerPoint or Google Slides to get the most out of infographics. Whether you want to organize your business budget in a table or schematically analyze your sales over the past year, this set of infographic resources will be of great help. Start using infographics...

Download the Business Diagram Infographics template for PowerPoint or Google Slides to get the most out of infographics. Whether you want to organize your business budget in a table or schematically analyze your sales over the past year, this set of infographic resources will be of great help. Start using...
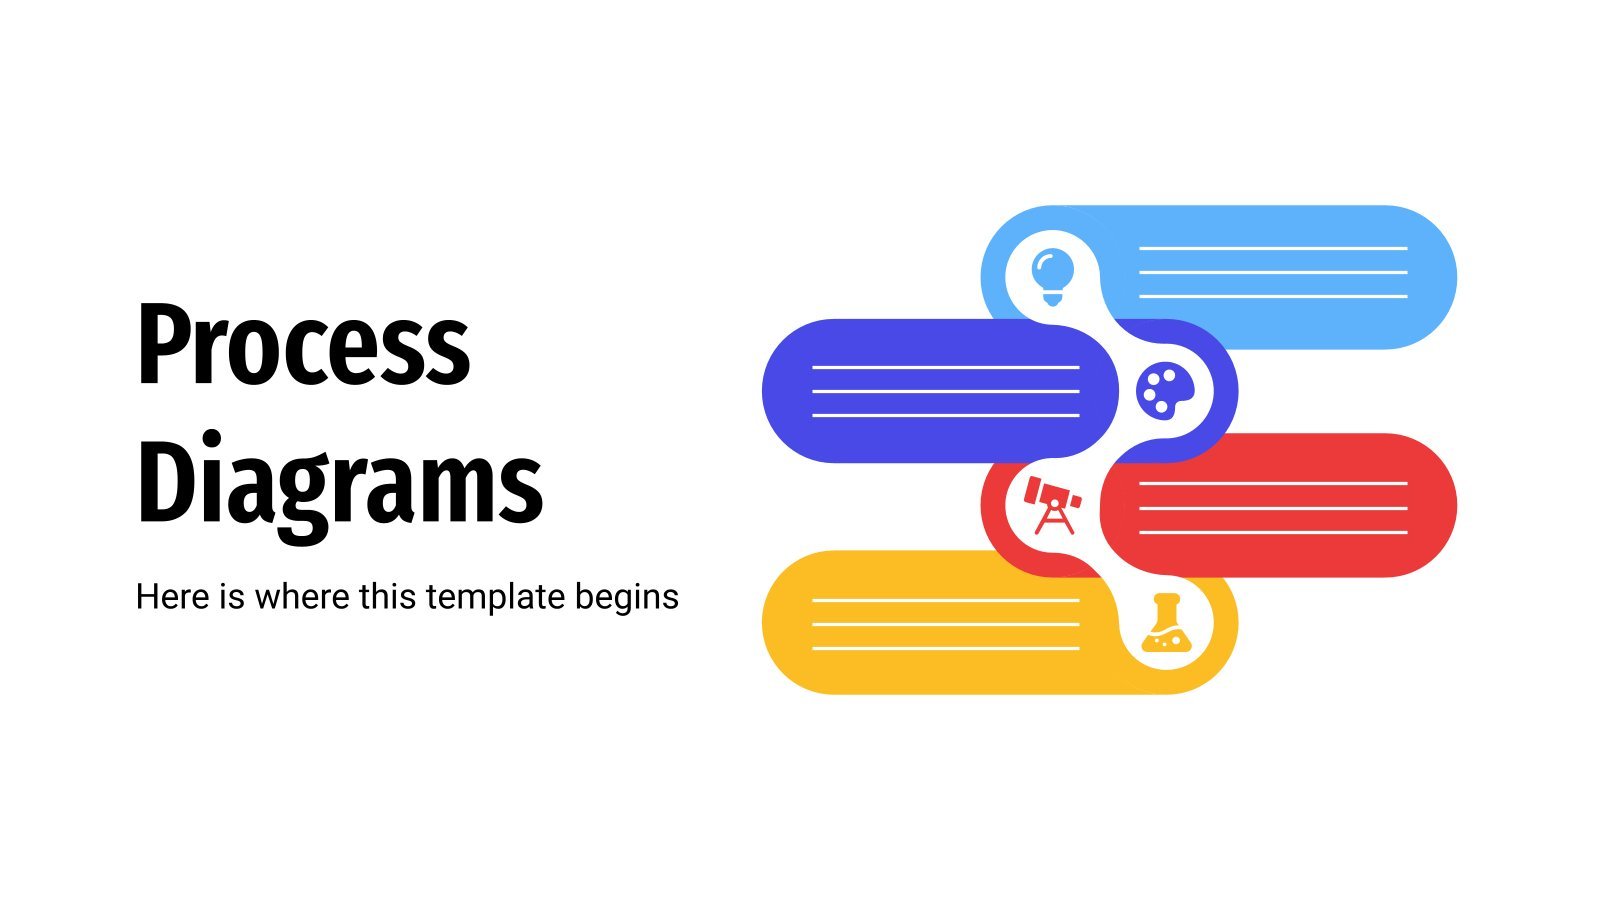
If you want to present the progress of your sales, project plan or manufacturing activities, process diagrams will be your best friends. They have the ability to develop a clear description of a process, step by step. They are pretty useful to achieve better communication with other people involved in...

Have you ever struggled to share a complex idea or process? Diagram infographics will make sure that doesn't happen again. These visually stunning and creative representations of information can help you break down even the most complicated concepts. Even better, they are editable and customizable to your needs, whether you're...
Download the "Arrow Infographics" template for PowerPoint or Google Slides and discover the power of infographics. An infographic resource gives you the ability to showcase your content in a more visual way, which will make it easier for your audience to understand your topic. Slidesgo infographics like this set here...
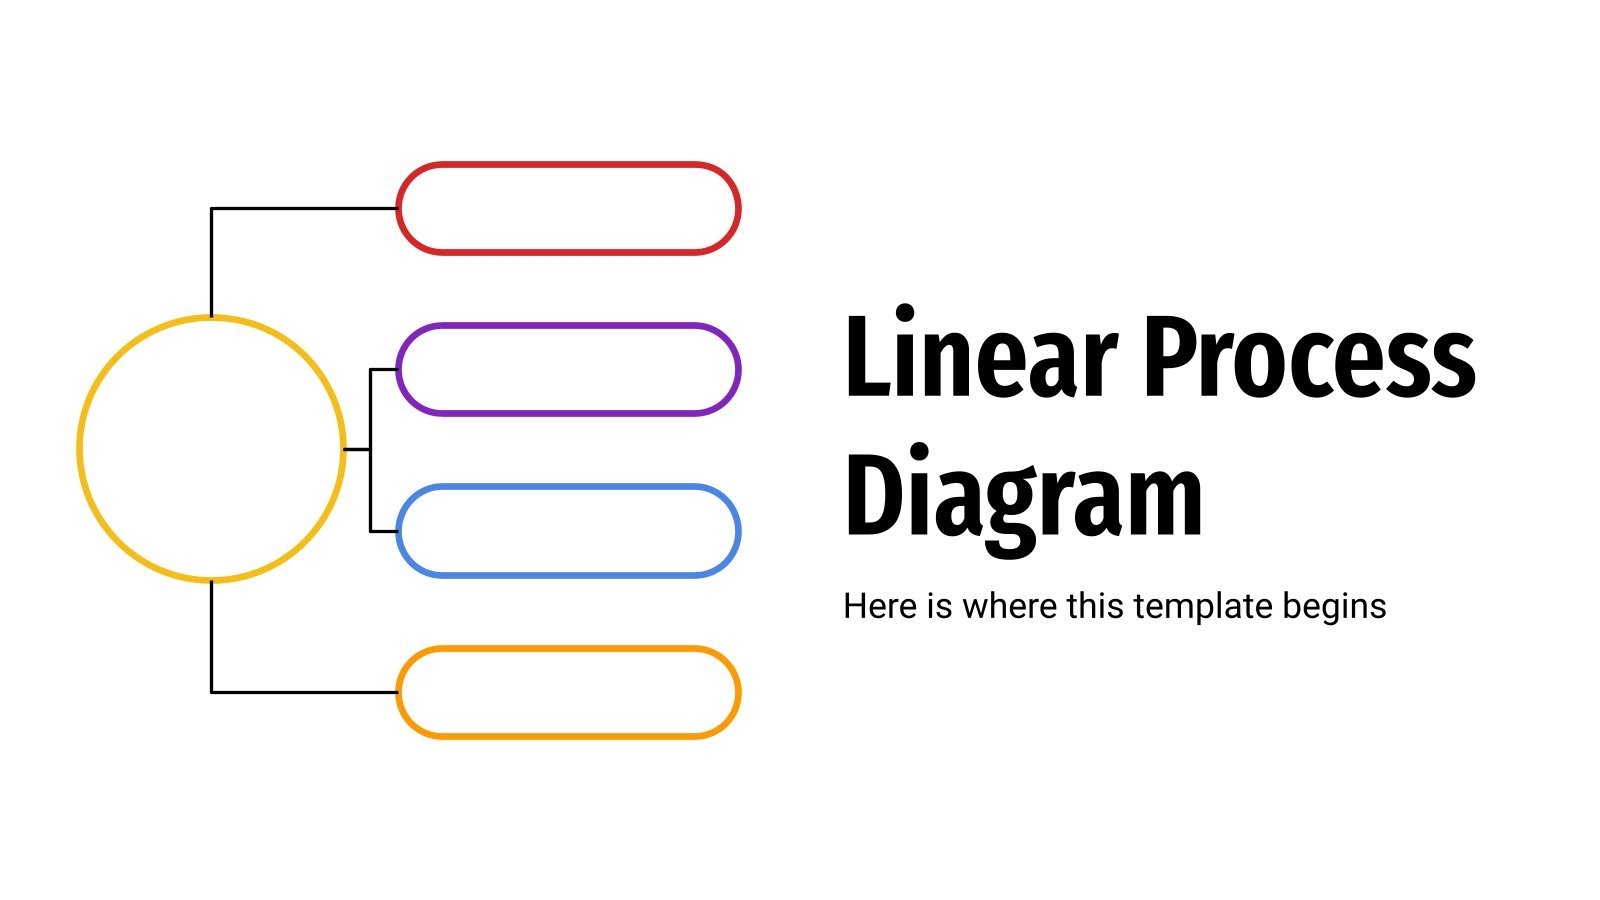
To illustrate data in the most visual way sometimes we need something simple and effective that just does the job. Nothing fancy or confusing, but something clear and to the point. This is why this set of diagrams exist! Its purpose is to help you with linking your information in...
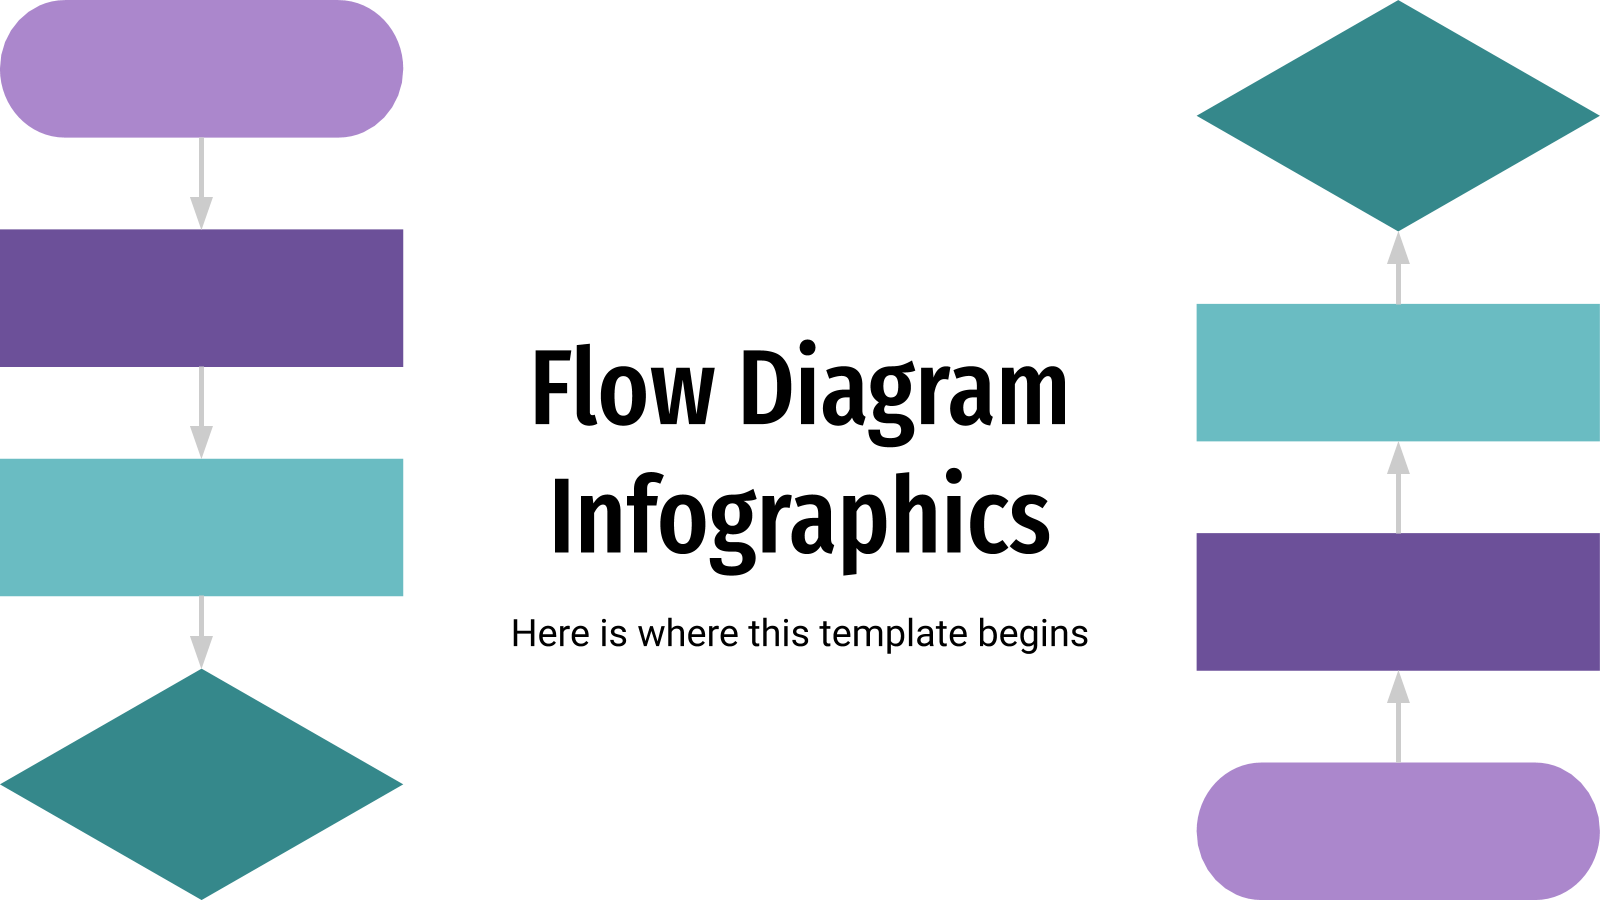
Flow diagrams are used to represent a process or a workflow, along with the possible decisions to take. Download this set of infographics and edit them accordingly. Because making things easier to understand is better than having a hard time trying to explain everything time and time again!

Cycle diagrams are great if you want to depict a circular flow of a series of steps, stages or events that interact between each other repeatedly without a clear end. Use them when talking about company processes, in marketing, health or for educational purposes. Of course, the different sections (up...

Today we're expanding our catalog of infographics with this new addition: strategy maps! Lay out the goals that your company wants to achieve in these diagrams, complete with different colors, arrows and text boxes. You can make them even more visually appealing if you use the icons included!

Download the Business Diagram Infographics template for PowerPoint or Google Slides to get the most out of infographics. Whether you want to organize your business budget in a table or schematically analyze your sales over the past year, this set of infographic resources will be of great help. Start using...

Download the Flowchart Infographics template for PowerPoint or Google Slides and discover the power of infographics. An infographic resource gives you the ability to showcase your content in a more visual way, which will make it easier for your audience to understand your topic. Slidesgo infographics like this set here...
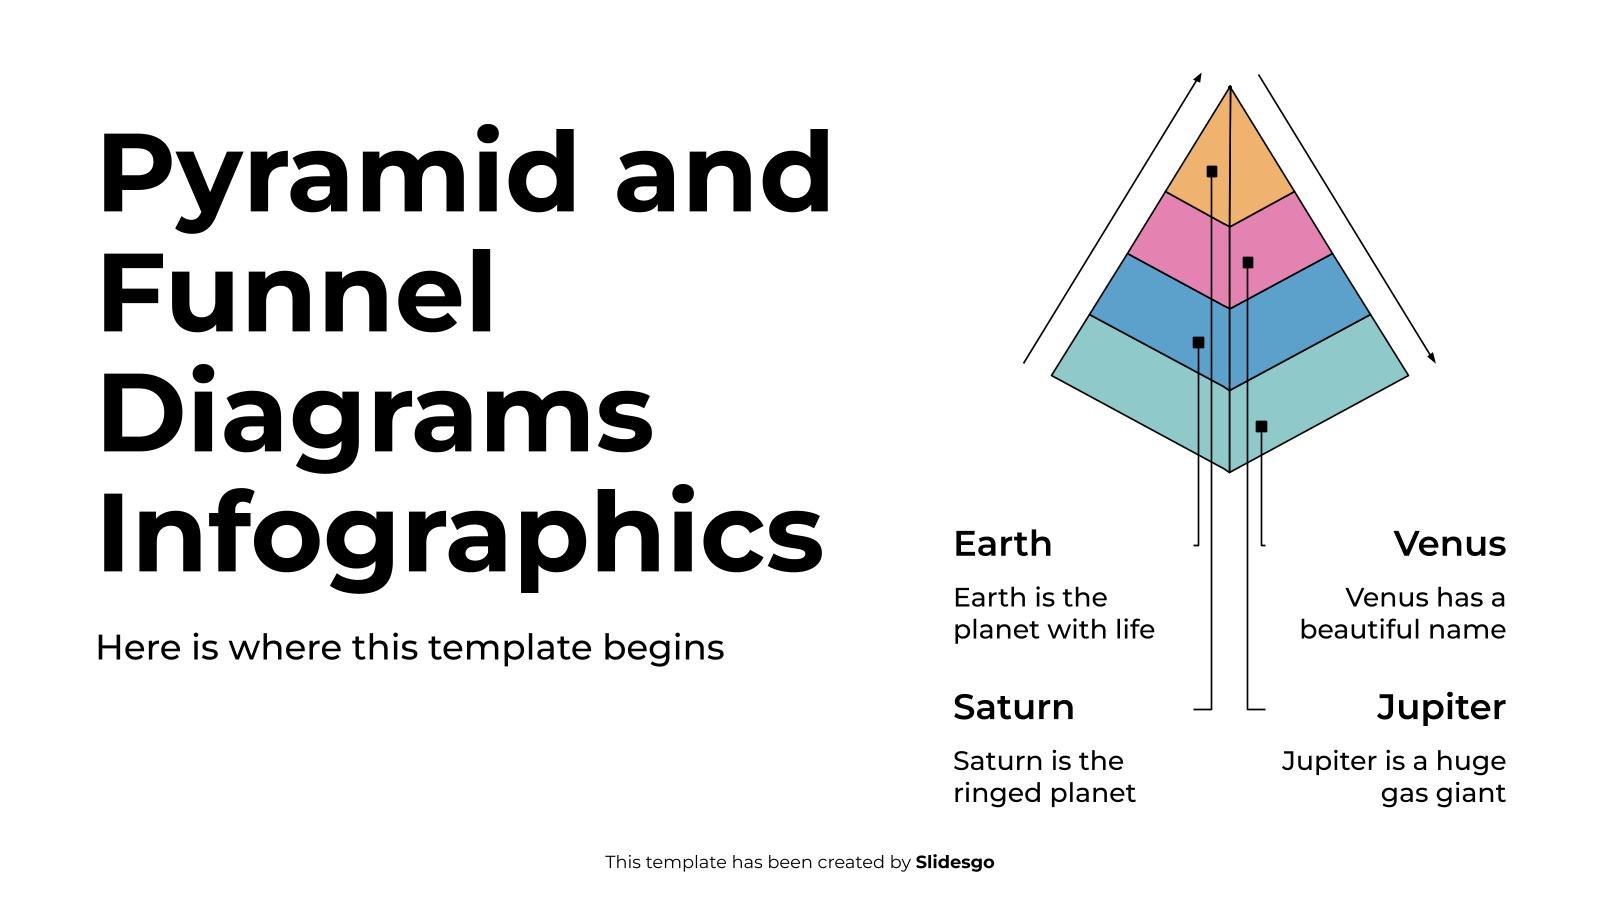
Download the Pyramid and Funnel Diagrams Infographics template for PowerPoint or Google Slides to get the most out of infographics. Whether you want to organize your business budget in a table or schematically analyze your sales over the past year, this set of infographic resources will be of great help....
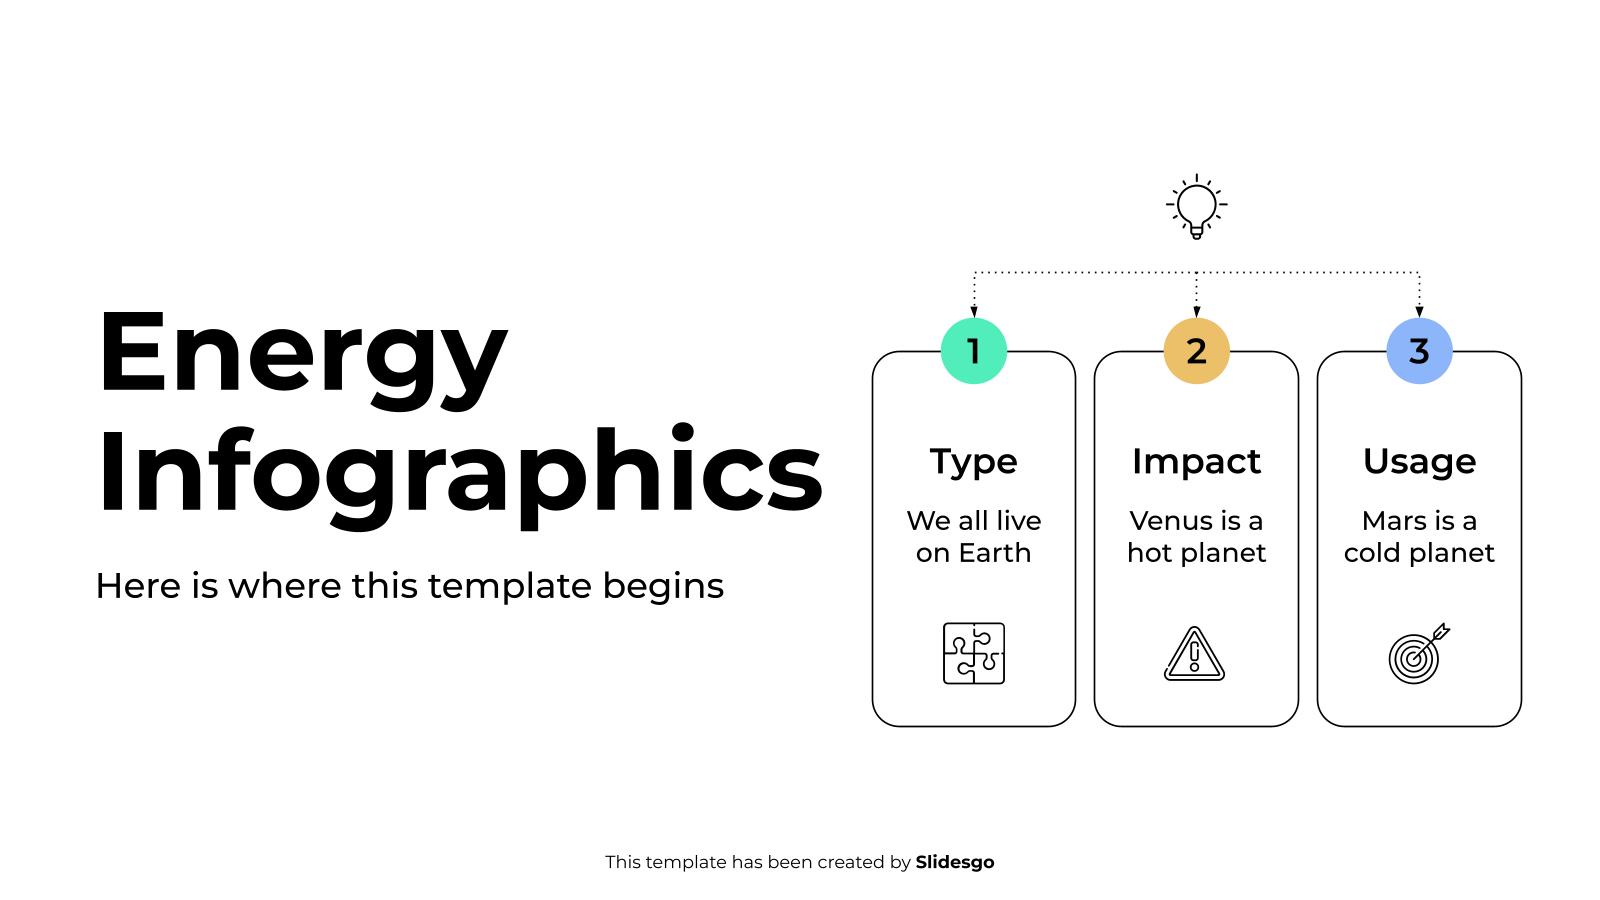
Download the Energy Infographics template for PowerPoint or Google Slides to get the most out of infographics. Whether you want to organize your business budget in a table or schematically analyze your sales over the past year, this set of infographic resources will be of great help. Start using infographics...

Download the Construction Project Lifecycle Infographics template for PowerPoint or Google Slides to get the most out of infographics. Whether you want to organize your business budget in a table or schematically analyze your sales over the past year, this set of infographic resources will be of great help. Start...

With flowcharts you can represent a process and all the decision-making involved. These ones are designed using the doodle graphic style, giving your slideshow a more casual touch. All the colors, arrows and shapes included are editable, so adapt it to your own needs and start visualizing the results!

Download the Diagram Infographics template for PowerPoint or Google Slides to get the most out of infographics. Whether you want to organize your business budget in a table or schematically analyze your sales over the past year, this set of infographic resources will be of great help. Start using infographics...
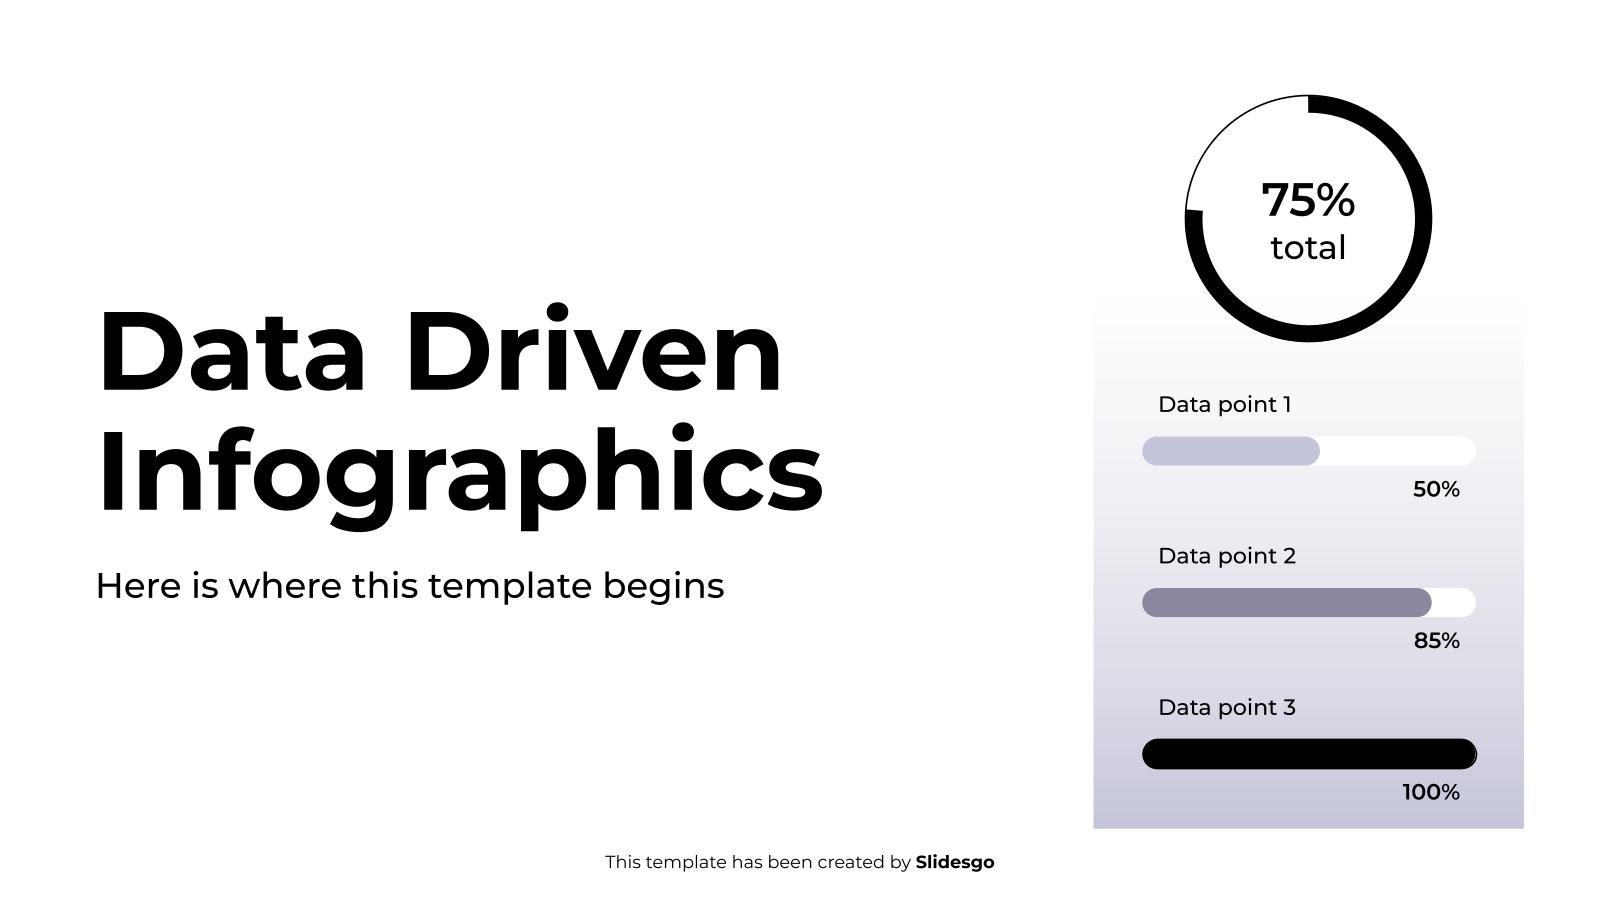
Download the Data Driven Infographics template for PowerPoint or Google Slides to get the most out of infographics. Whether you want to organize your business budget in a table or schematically analyze your sales over the past year, this set of infographic resources will be of great help. Start using...

Venn diagrams are useful if you want to show correlation between items or concepts. It’s like overlapping the elements that are related to each other. Our designs use mostly circles, but there are others who look like radial charts, others with gradient bubbles or others with arrows. The main styles...