Infographics Presentation templates - Page 2
Discover our engaging Google Slides and PowerPoint slides full of infographics to present your information or data clearly and quickly!


It seems that you like this template!

Register for free and start downloading now
Download the AI Tech Infographics template for PowerPoint or Google Slides to get the most out of infographics. Whether you want to organize your business budget in a table or schematically analyze your sales over the past year, this set of infographic resources will be of great help. Start using...
Table Infographics help a lot of purposes. Use them to talk about the prices of memberships, to compare different concepts or ideas, to give percentages related to your company, to summarize a difficult chapter or even to talk about the symptoms of a patient. They appear as lists, blocks, arrows…...
Download the "name" template for PowerPoint or Google Slides to get the most out of infographics. Whether you want to organize your business budget in a table or schematically analyze your sales over the past year, this set of infographic resources will be of great help. Start using infographics now...

Download the Stock Market Infographics template for PowerPoint or Google Slides to get the most out of infographics. Whether you want to organize your business budget in a table or schematically analyze your sales over the past year, this set of infographic resources will be of great help. Start using...

Download the "Timeline Infographics" template for PowerPoint or Google Slides and discover the power of infographics. An infographic resource gives you the ability to showcase your content in a more visual way, which will make it easier for your audience to understand your topic. Slidesgo infographics like this set here...

We can’t wait to see your reaction when you open these infographics! We’re sure between you and Slidesgo there’s a lot of chemistry, specially when we offer you so many editable resources with amazing designs. Take a look at these resources for chemists and make speaking about replacement, decomposition or...

Download the Architect Infographics template for PowerPoint or Google Slides to get the most out of infographics. Whether you want to organize your business budget in a table or schematically analyze your sales over the past year, this set of infographic resources will be of great help. Start using infographics...
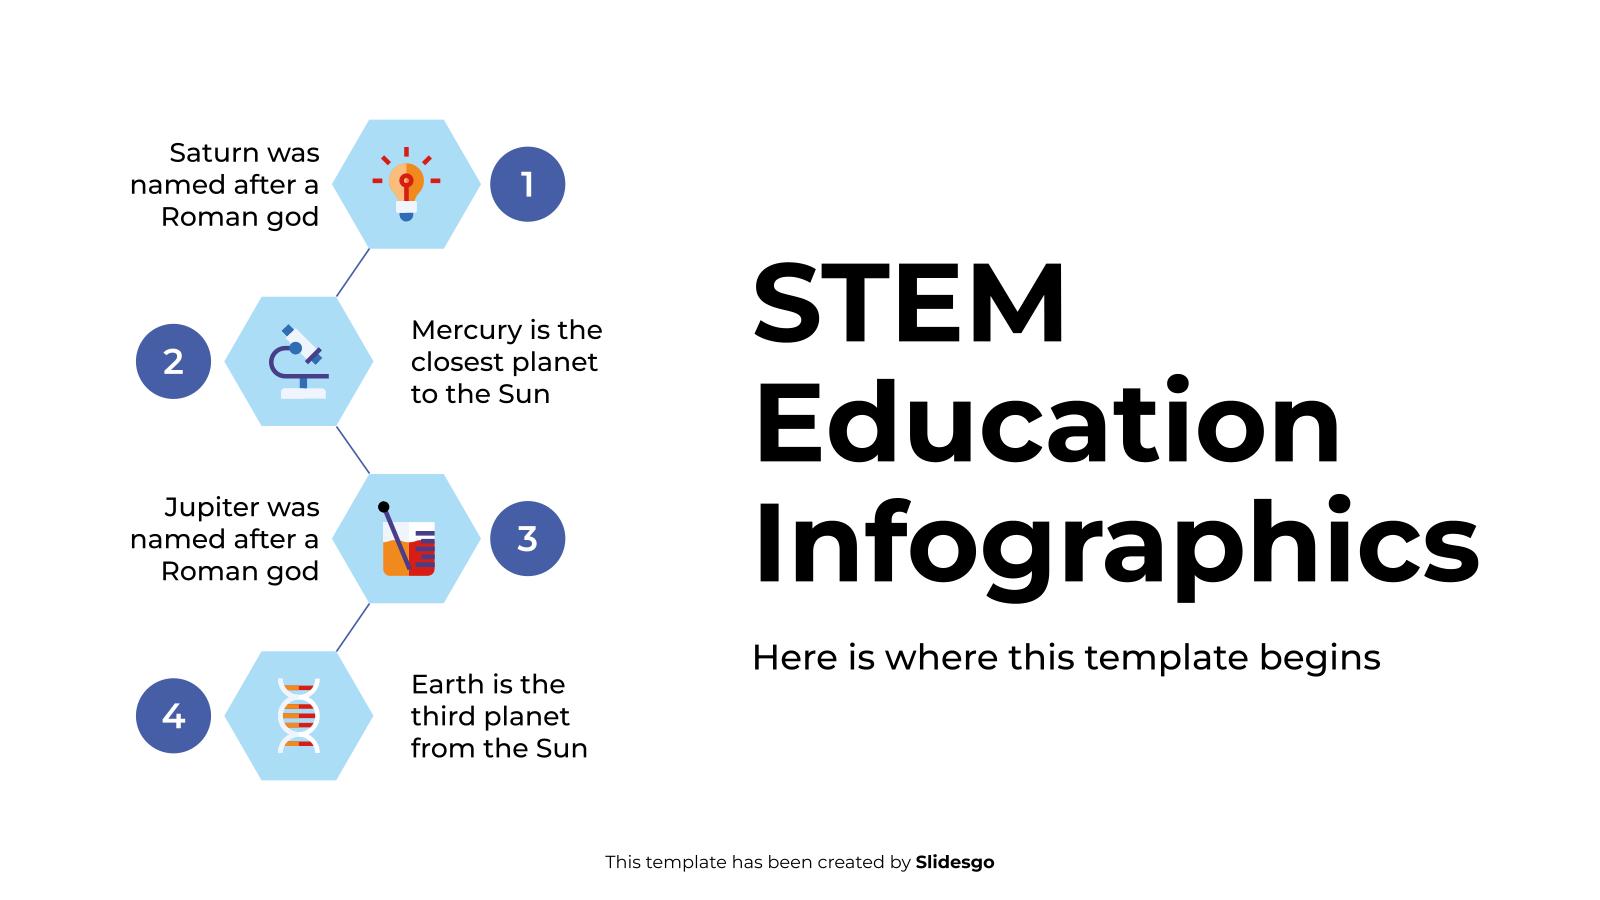
Download the STEM Education Infographics template for PowerPoint or Google Slides and discover this set of editable infographics for education presentations. These resources, from graphs to tables, can be combined with other presentations or used independently. The most important thing is what you will achieve: transmit information in an orderly...
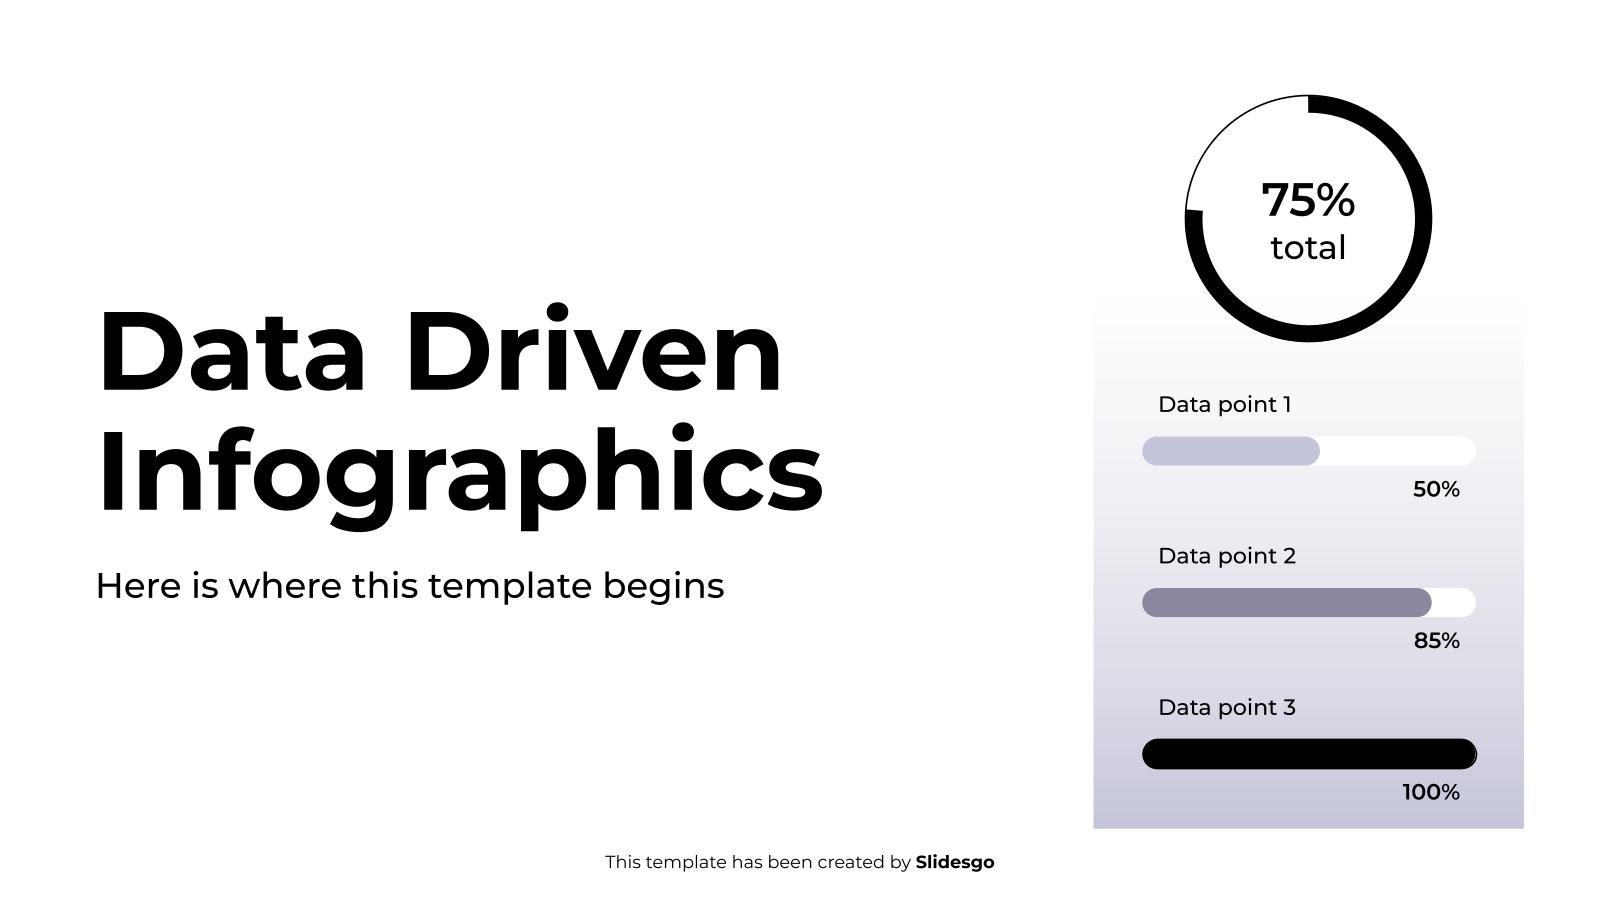
Download the Data Driven Infographics template for PowerPoint or Google Slides to get the most out of infographics. Whether you want to organize your business budget in a table or schematically analyze your sales over the past year, this set of infographic resources will be of great help. Start using...
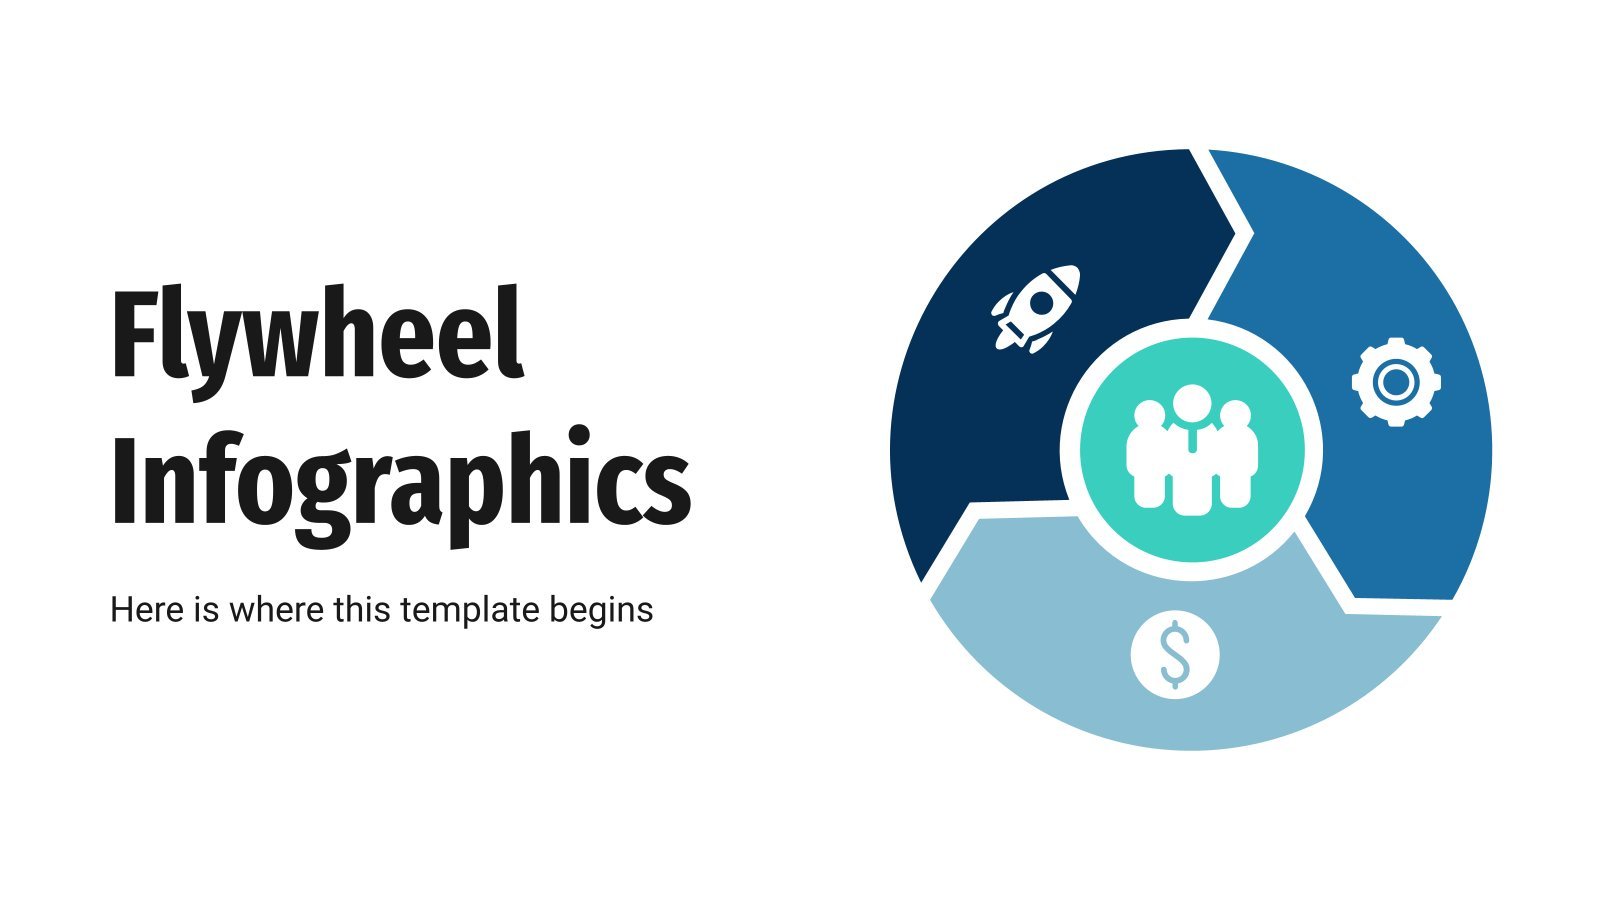
You know how a flywheel looks, right? In the business world, there's something called "flywheel model", which tries to establish an analogy with how a flywheel works, with the aim of attracting, engaging and finally retaining customers. With these infographics, you can represent that model visually. Our designs are varied,...

Download the Girl Power Campaign Infographics template for PowerPoint or Google Slides and discover the power of infographics. An infographic resource gives you the ability to showcase your content in a more visual way, which will make it easier for your audience to understand your topic. Slidesgo infographics like this...
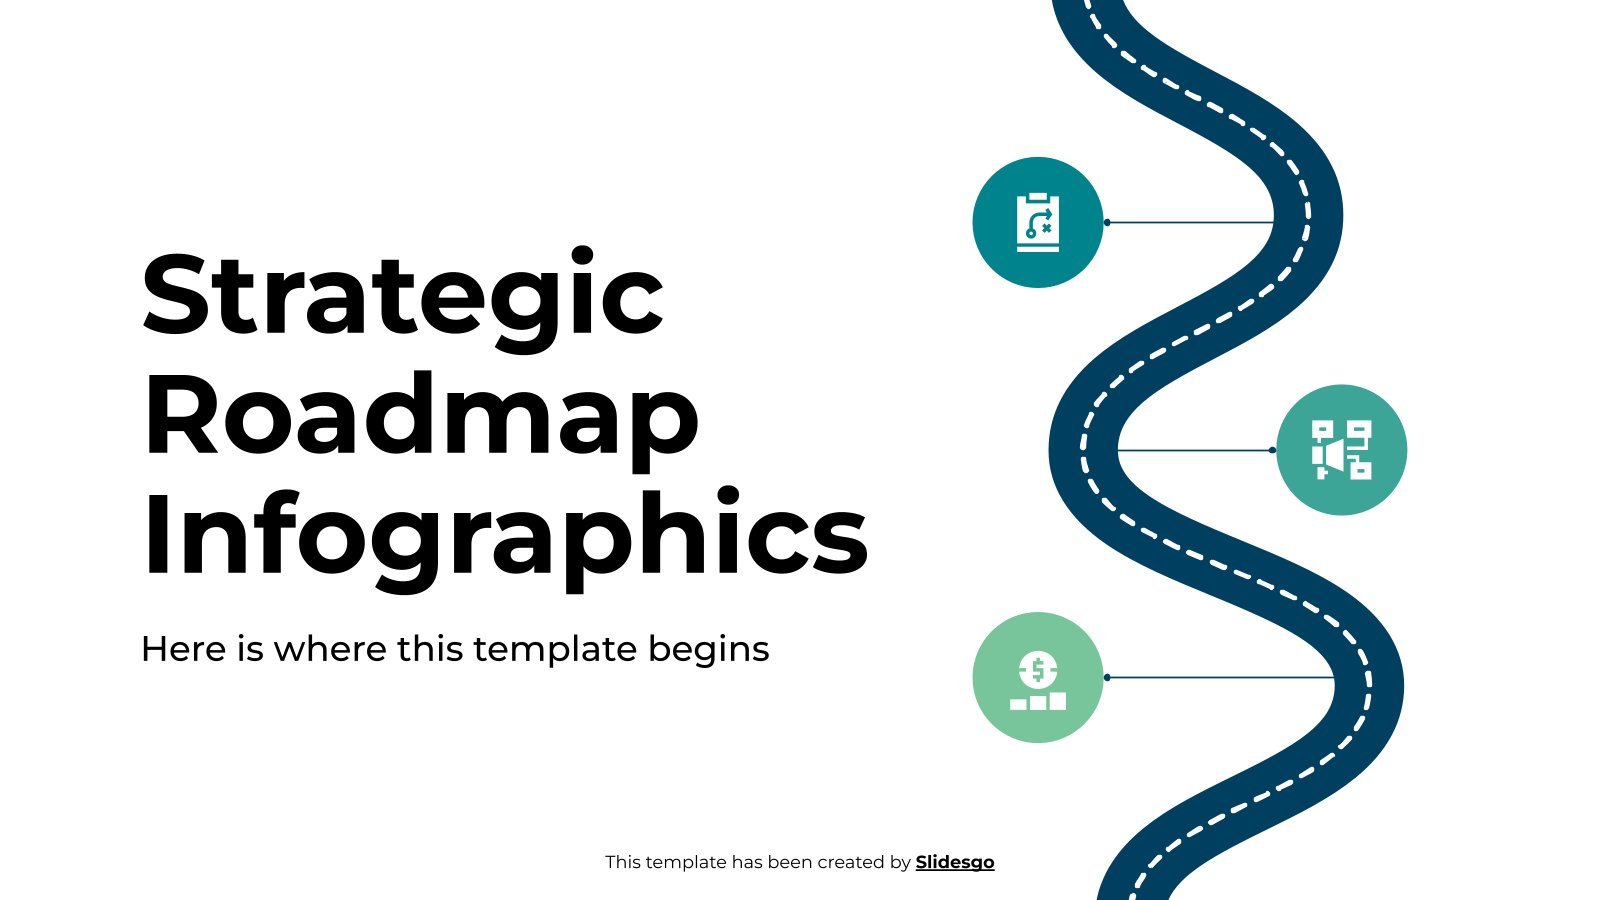
Download the "Strategic Roadmap Infographics" template for PowerPoint or Google Slides and discover the power of infographics. An infographic resource gives you the ability to showcase your content in a more visual way, which will make it easier for your audience to understand your topic. Slidesgo infographics like this set...
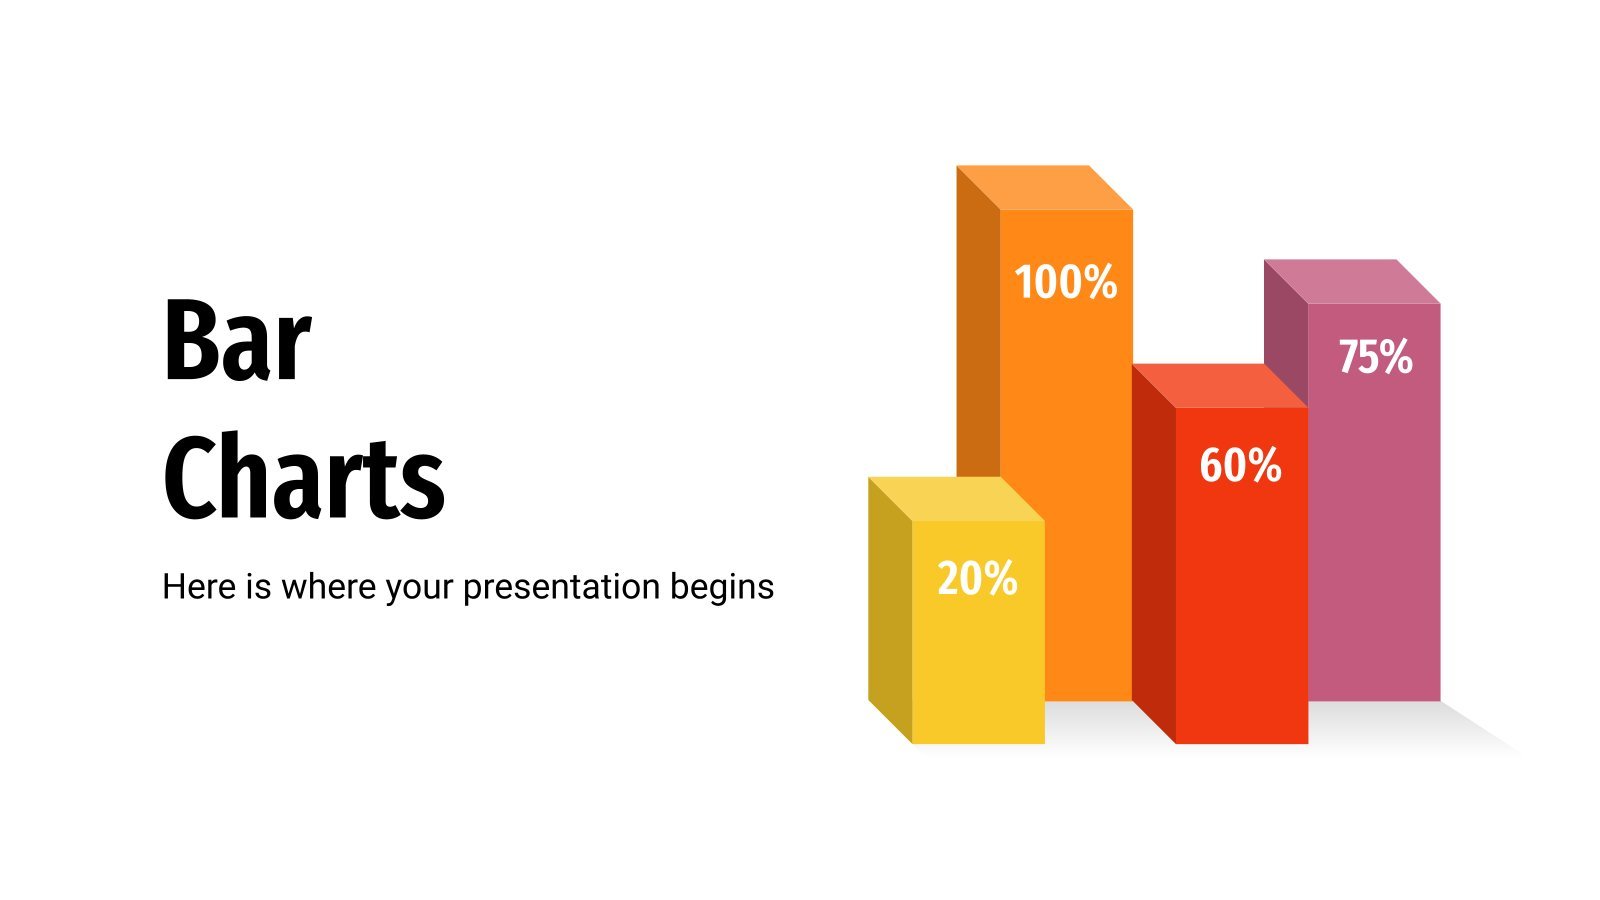
Bar charts are very adaptable. No matter what you want to represent: if you have some numbers, data and percentages, use these diagrams. We have designed many of them for you: simple bars, cylindrical, pyramidal, arrows… Choose one!
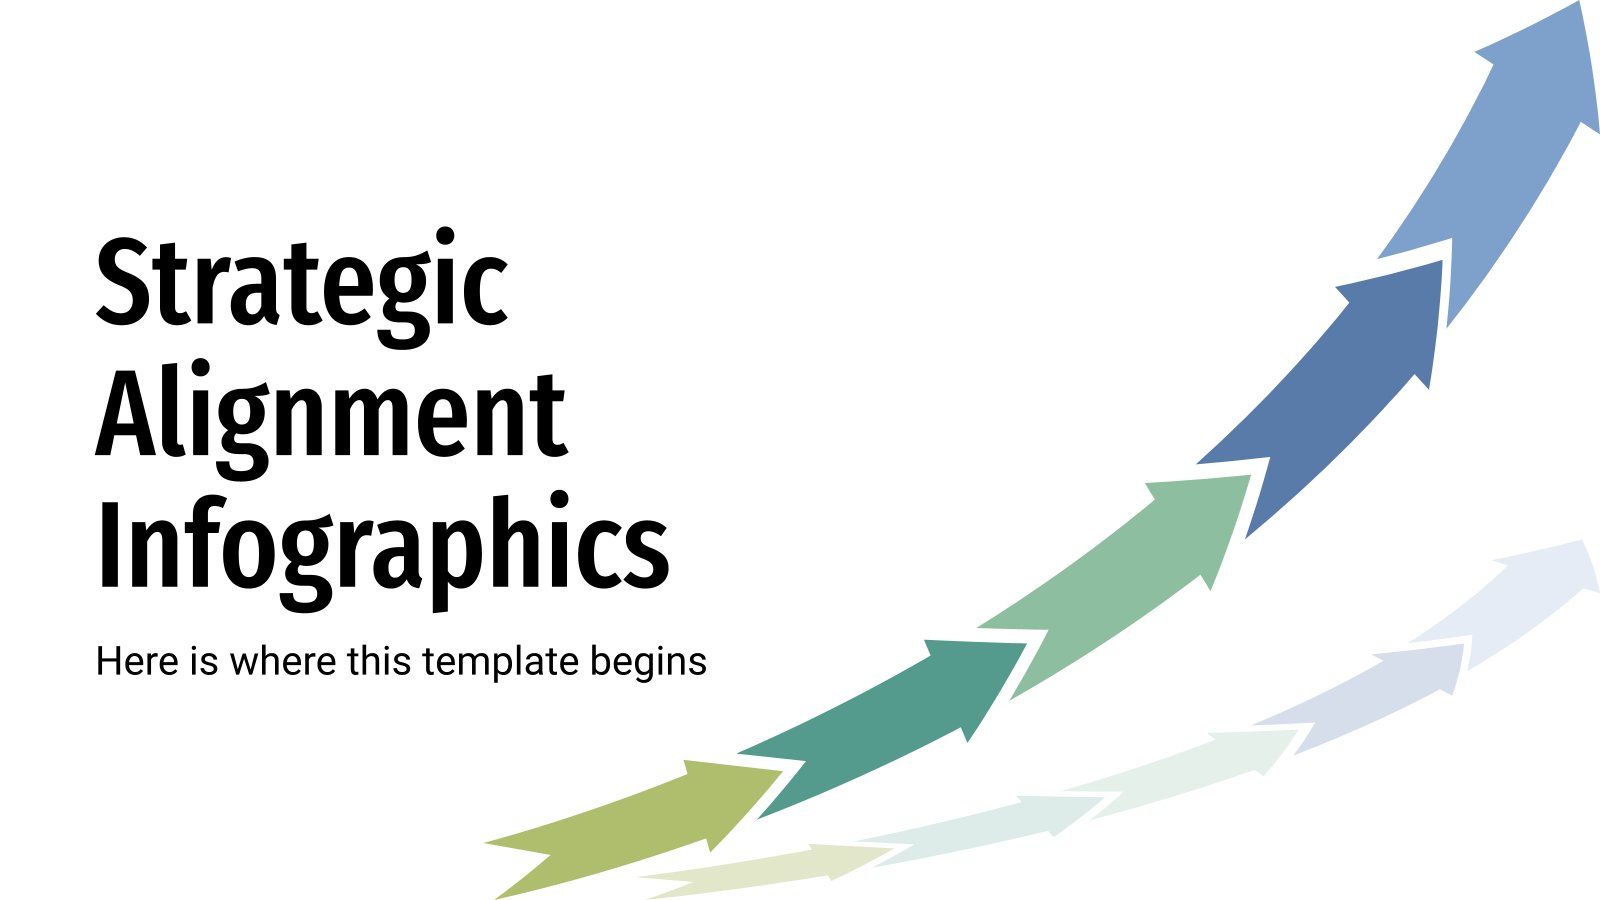
Strategic alignment in a business is fundamental. It consists, as its name suggests, in aligning the overall objectives of the company with those of each of its departments, so that together they contribute to achieving business success. This infographic template will help you establish those goals and distinguish the different...
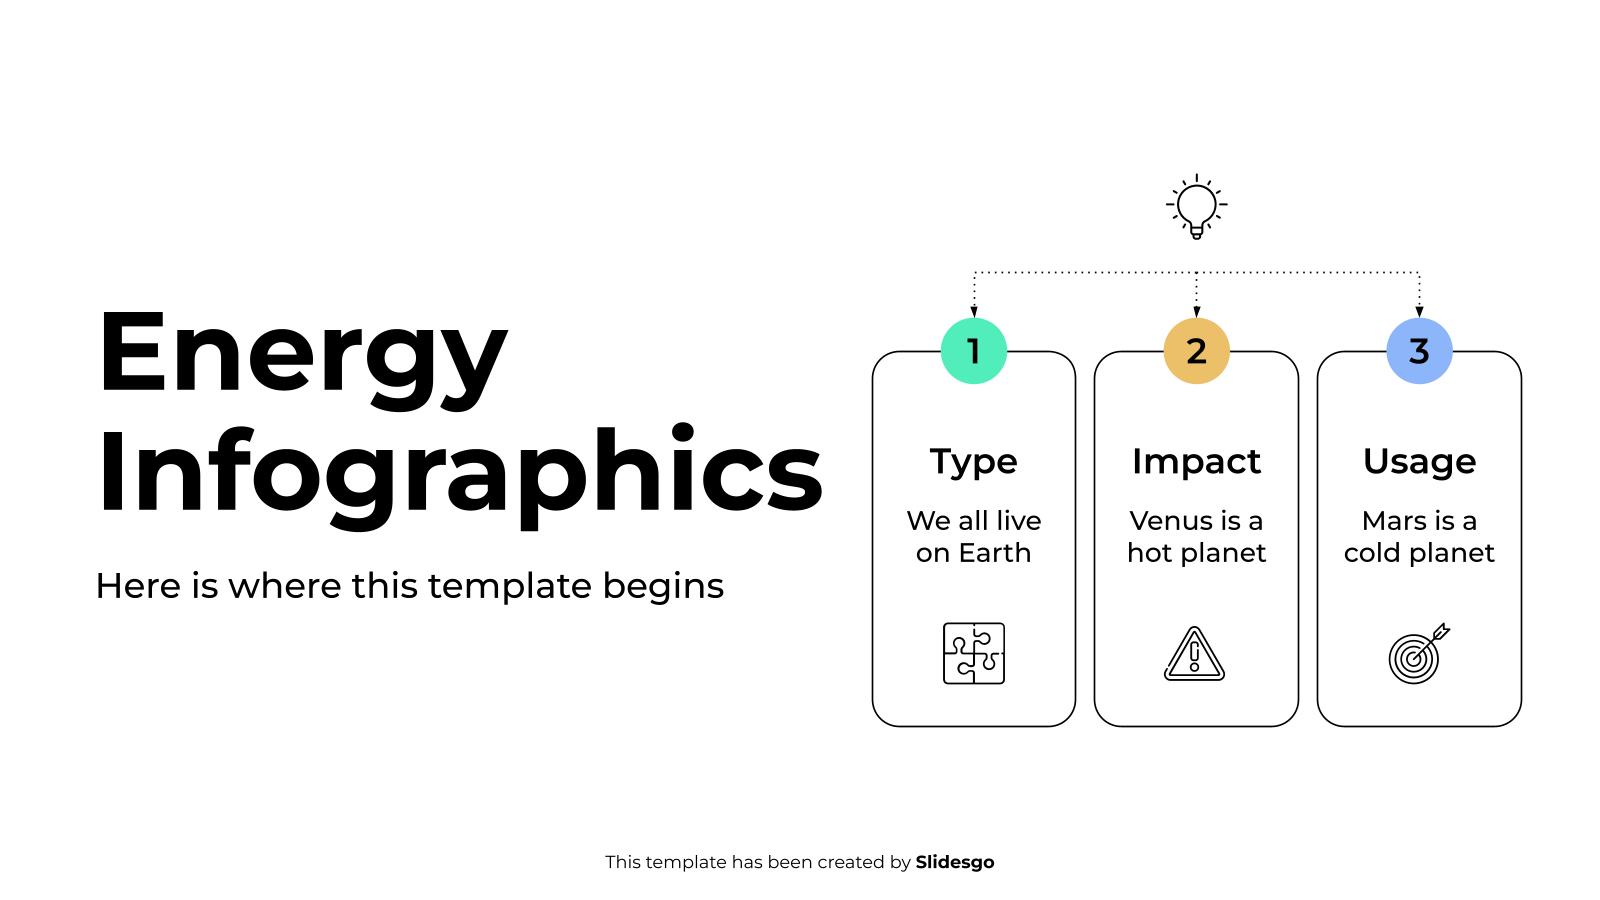
Download the Energy Infographics template for PowerPoint or Google Slides to get the most out of infographics. Whether you want to organize your business budget in a table or schematically analyze your sales over the past year, this set of infographic resources will be of great help. Start using infographics...

Download the Agile Infographics template for PowerPoint or Google Slides to get the most out of infographics. Whether you want to organize your business budget in a table or schematically analyze your sales over the past year, this set of infographic resources will be of great help. Start using infographics...

The best way to order events is to use timelines. In this way, you can use in your presentations of any subject one of the 31 timelines that we propose in this template here. Start modifying these infographic resources and make your presentations a total success.

Making your work easier for you, that's our motto with our infographics! Download this template and show visually the lifecycle of a product, that is, how its sales evolved over time. All these designs incorporate four elements in different styles of timelines, roadmaps and tables. Marketing and/or business presentations will...