Funnel Infographics Presentation templates
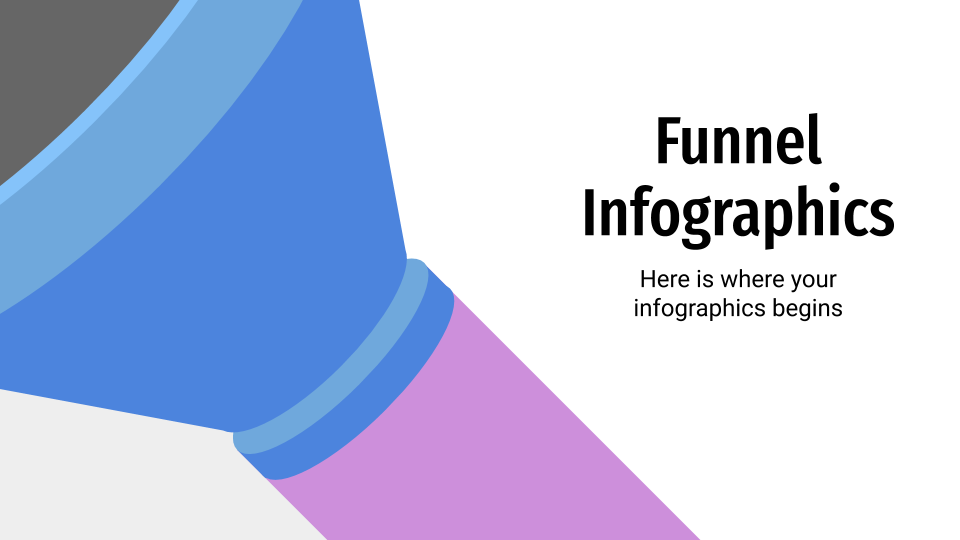
There's a type of chart, diagram or infographics (depending on who you ask) that shows a progression of different blocks of data in increasing or decreasing order and, as such, are called "funnel". How convenient! Slidesgo has some sets of these infographics for Google Slides and PowerPoint presentations, totally customizable and adaptable!


It seems that you like this template!

Register for free and start downloading now
Cones diagrams are perfect to represent hierarchies in ascending or descending order. They appear as cones, sections, funnels or pyramids, and they can be flat, filled or linear. Make use of their 3 to 6 sections per slide.
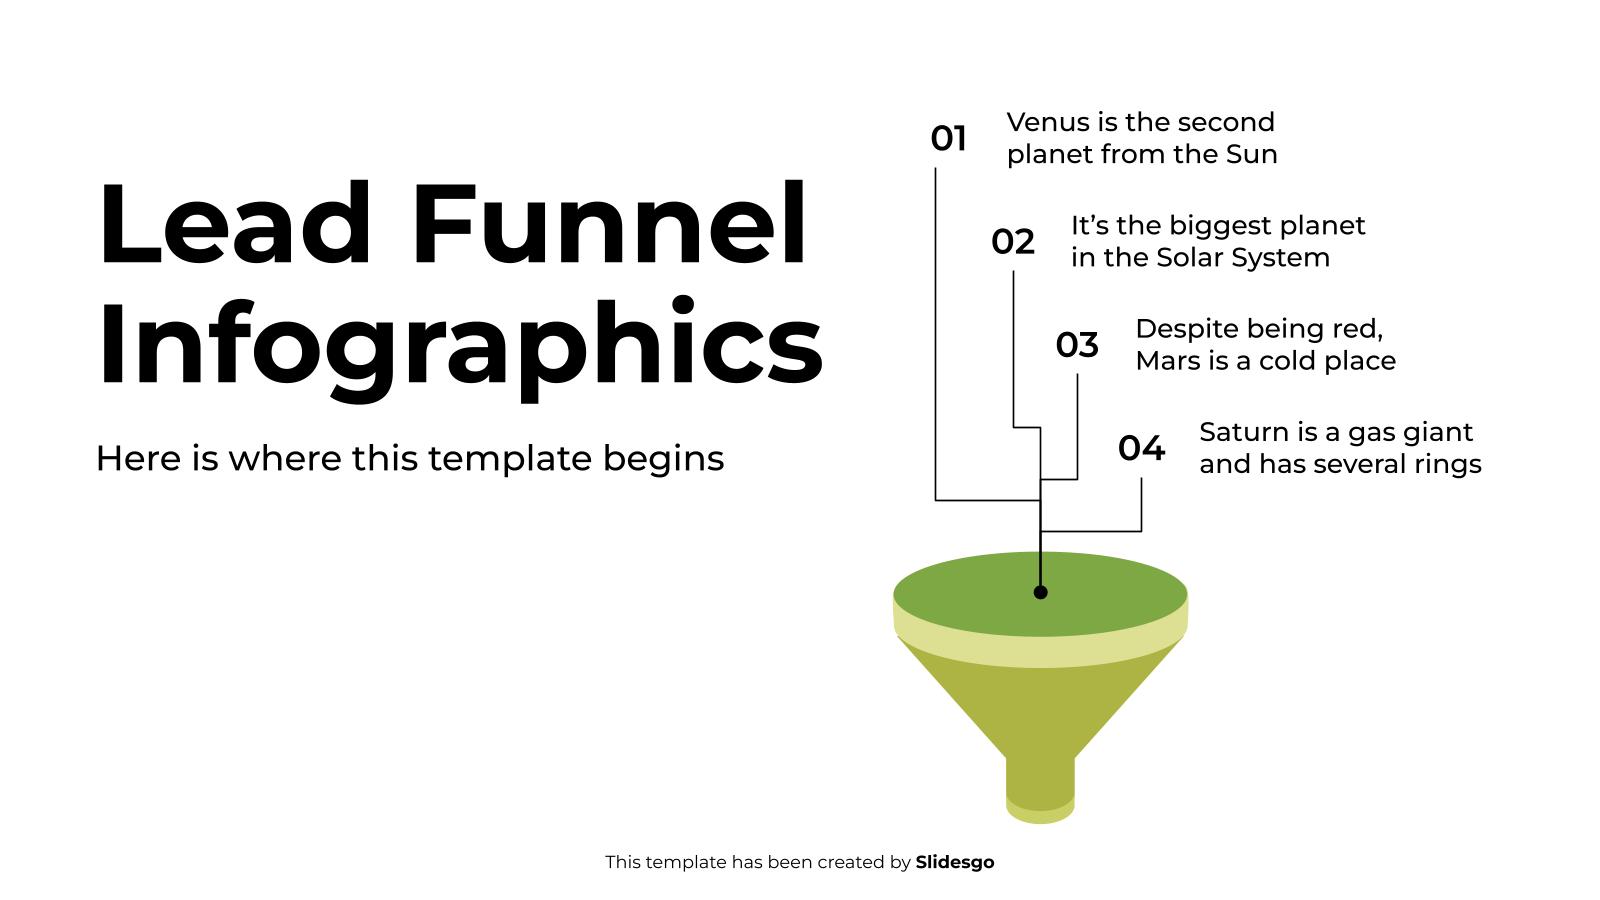
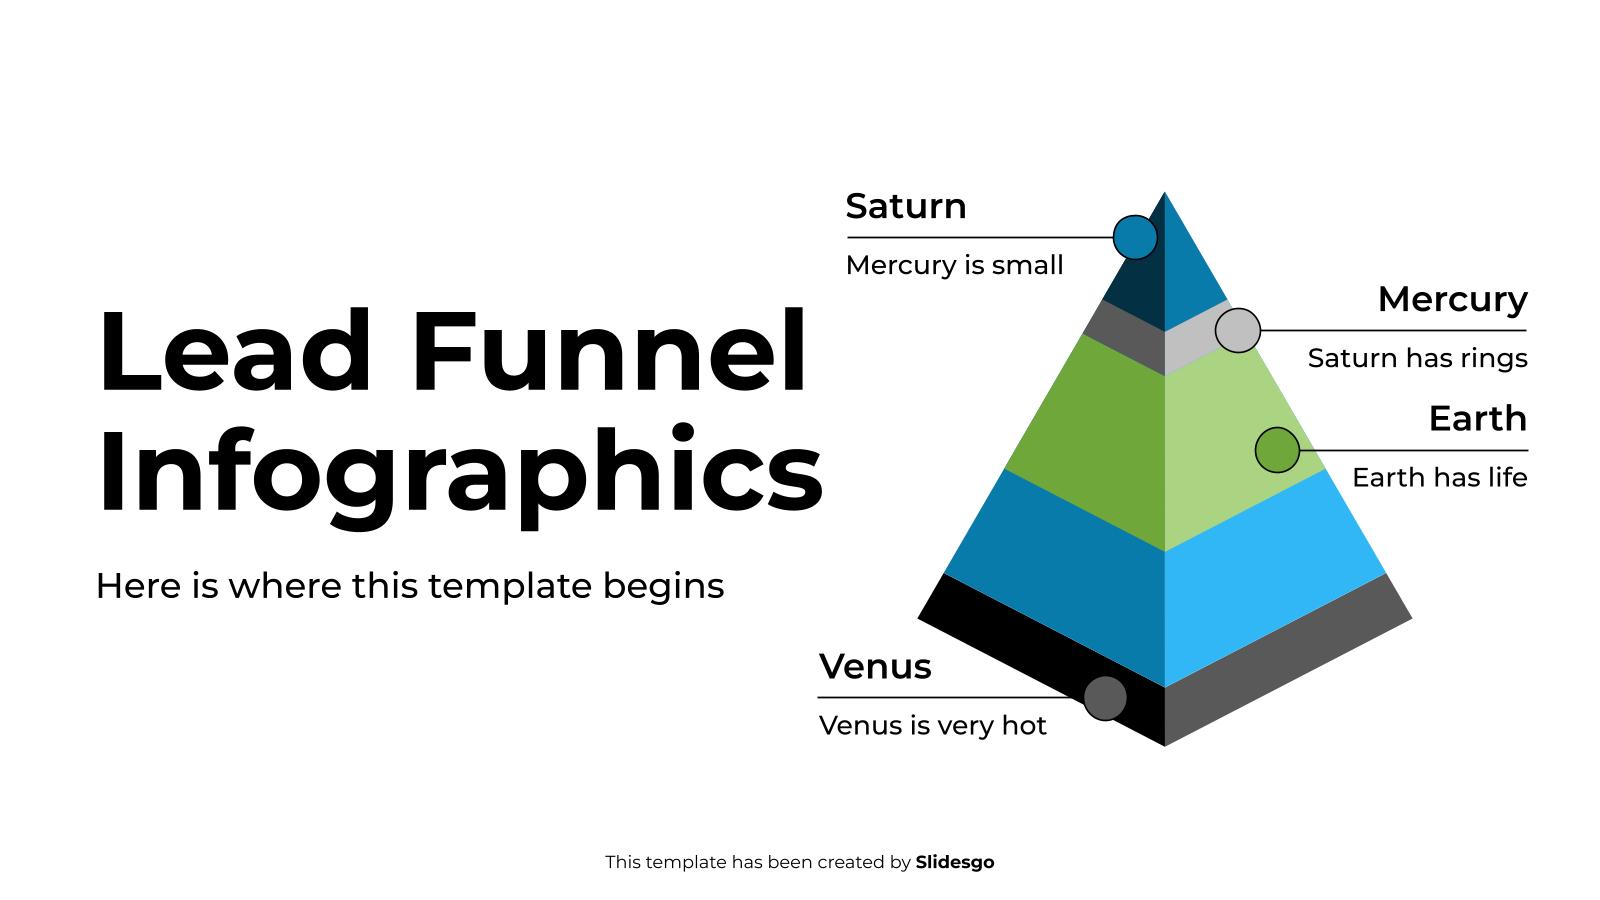
Download the Lead Funnel Infographics template for PowerPoint or Google Slides to get the most out of infographics. Whether you want to organize your business budget in a table or schematically analyze your sales over the past year, this set of infographic resources will be of great help. Start using...
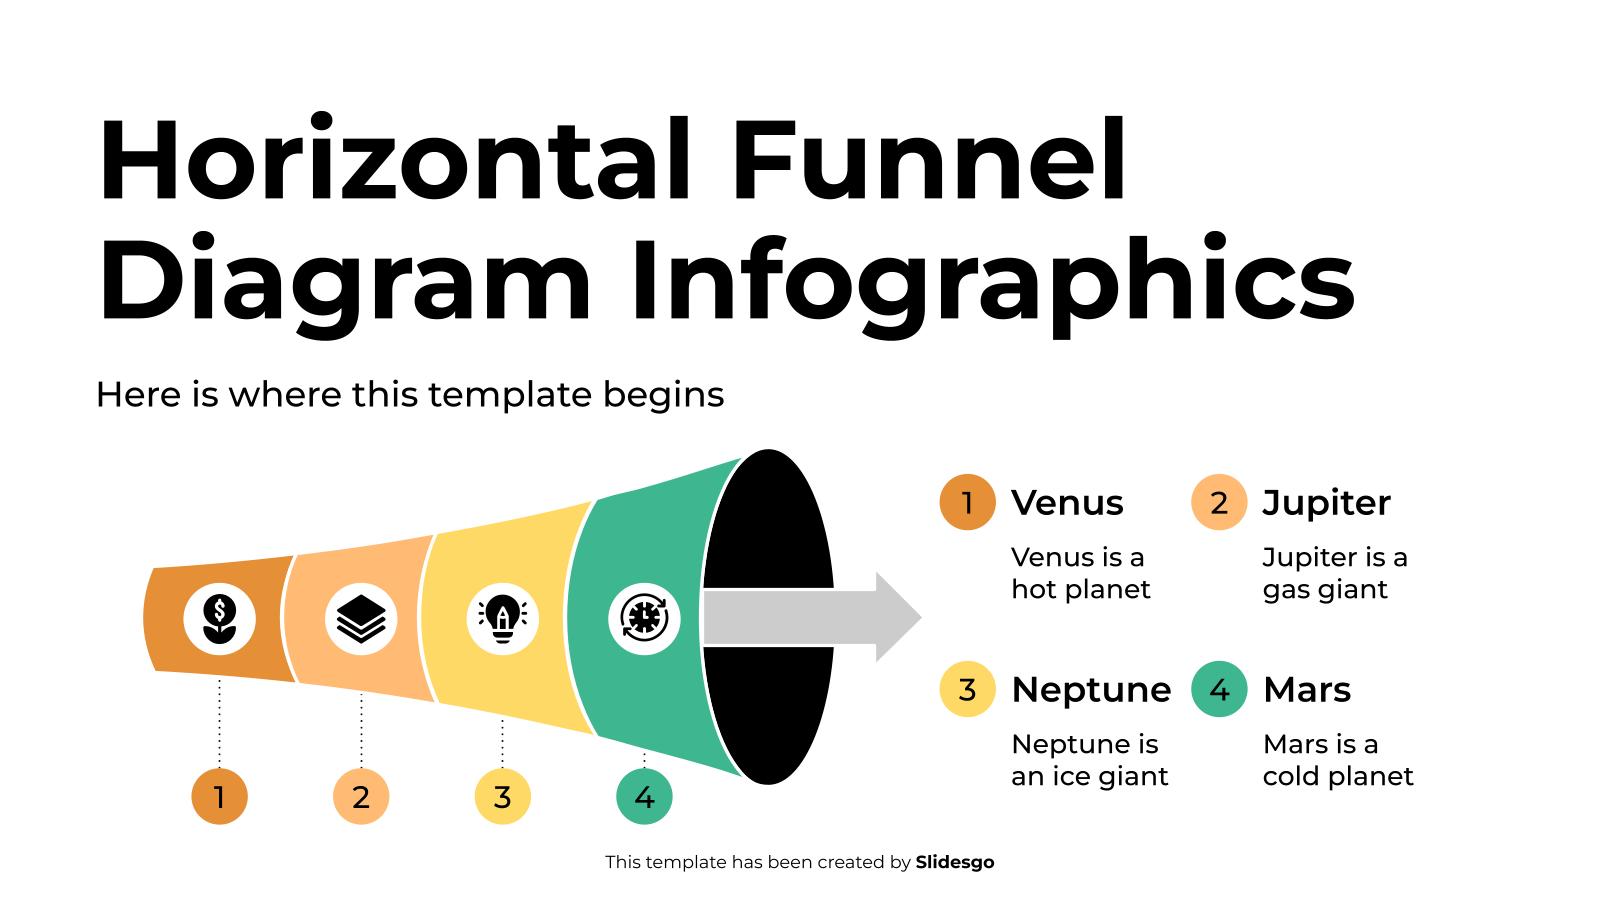
Download the Horizontal Funnel Diagram Infographics template for PowerPoint or Google Slides to get the most out of infographics. Whether you want to organize your business budget in a table or schematically analyze your sales over the past year, this set of infographic resources will be of great help. Start...
Ready to use funnel infographics? They are perfect for business and marketing. Thanks to their conical shapes, you can depict the different steps to achieve your goal (e.g. a given client or lead.) Each section represents a percentage of loss for each stage of the process, that’s why they are...

Imagine this: a swirling vortex of information that leads you straight down a path to success. That's the power of a great funnel infographic. With a little bit of creativity, these editable visual aids can guide potential customers through the twists and turns of the decision-making process with ease. And...

Have you ever heard of "AIDA"? The name of your Spanish daughter-in-law, you say? Nah, we're talking about a model in marketing that means "Attention, Interest, Desire and Action", the steps to take in order to convince a potential customer of buying your product. A process that can be illustrated...
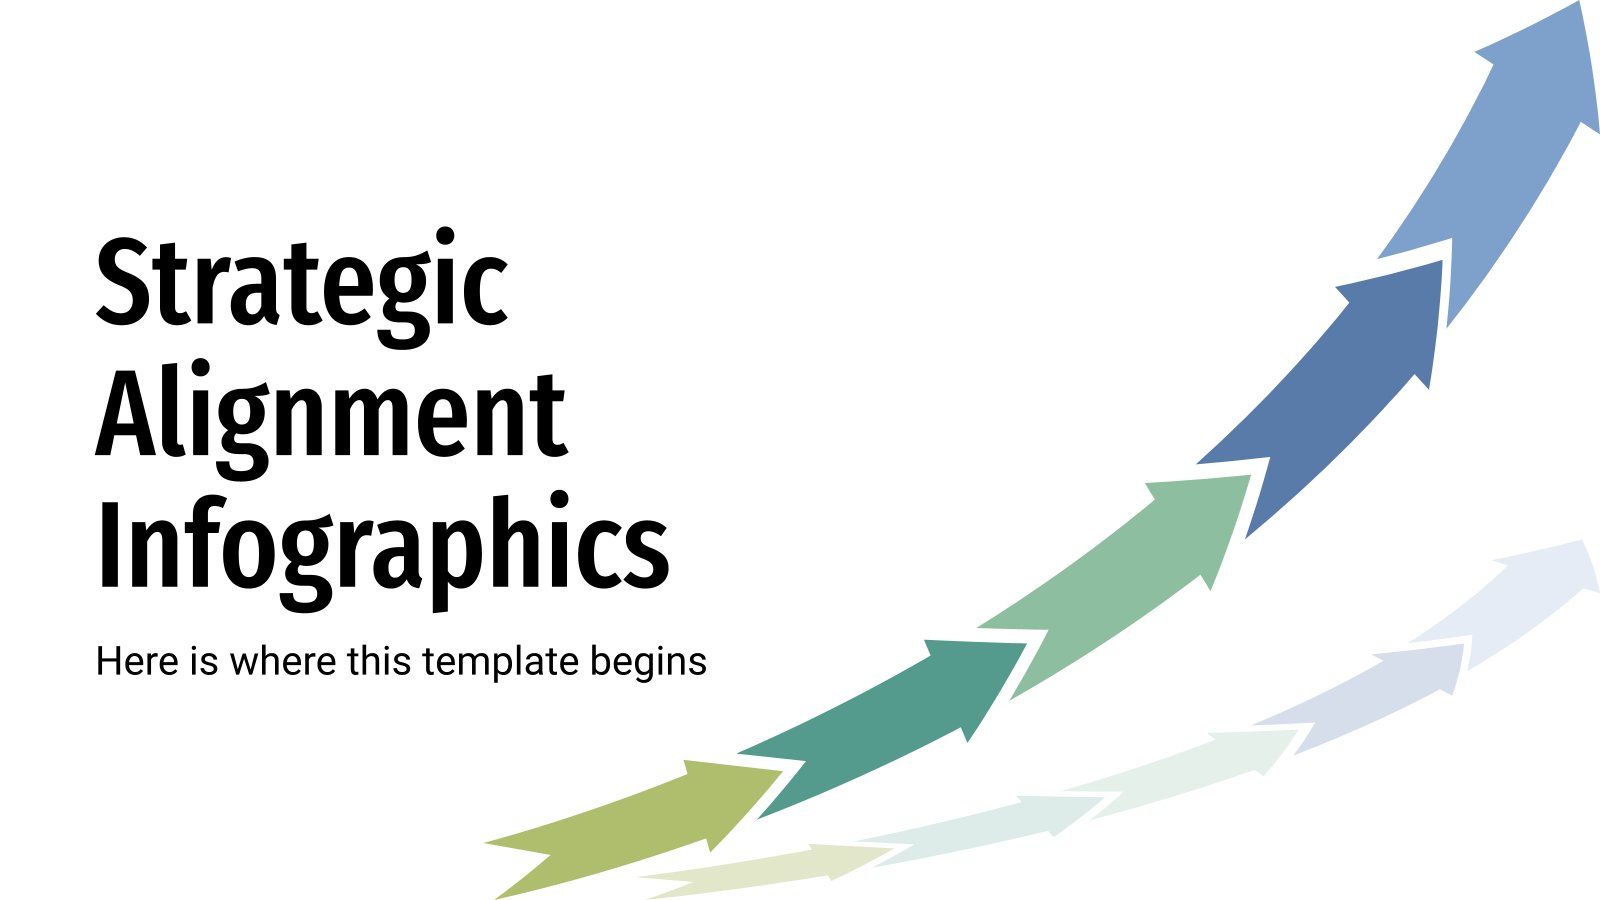
Strategic alignment in a business is fundamental. It consists, as its name suggests, in aligning the overall objectives of the company with those of each of its departments, so that together they contribute to achieving business success. This infographic template will help you establish those goals and distinguish the different...

It's obvious that any business wants to reach to as many customers as possible, and maintain a nice commercial relationship with them. "Leads" and "nurturing" are two concepts that can go together too, but how to define them? Use these infographics and illustrate your audience with all kinds of diagrams,...

Download the Lead Funnel Infographics template for PowerPoint or Google Slides to get the most out of infographics. Whether you want to organize your business budget in a table or schematically analyze your sales over the past year, this set of infographic resources will be of great help. Start using...

Download the Marketing Sales Funnel Infographics template for PowerPoint or Google Slides to get the most out of infographics. Whether you want to organize your business budget in a table or schematically analyze your sales over the past year, this set of infographic resources will be of great help. Start...

Download the Sales Funnel Infographics template for PowerPoint or Google Slides to get the most out of infographics. Whether you want to organize your business budget in a table or schematically analyze your sales over the past year, this set of infographic resources will be of great help. Start using...

These Spiral Diagrams with gradients represent sequences or progressions, and we have added some text columns, icons, enumerations, colors and other resources to create hierarchies and to differentiate their 4 to 6 sections. They are great for providing business data. They appear as spiral and circle charts displaying gradients.

Download the Sales Funnel infographics presentation for PowerPoint or Google Slides. Conveying your business plan accurately and effectively is the cornerstone of any successful venture. This template allows you to pinpoint essential elements of your operation while your audience will appreciate the clear and concise presentation, eliminating any potential misunderstandings....
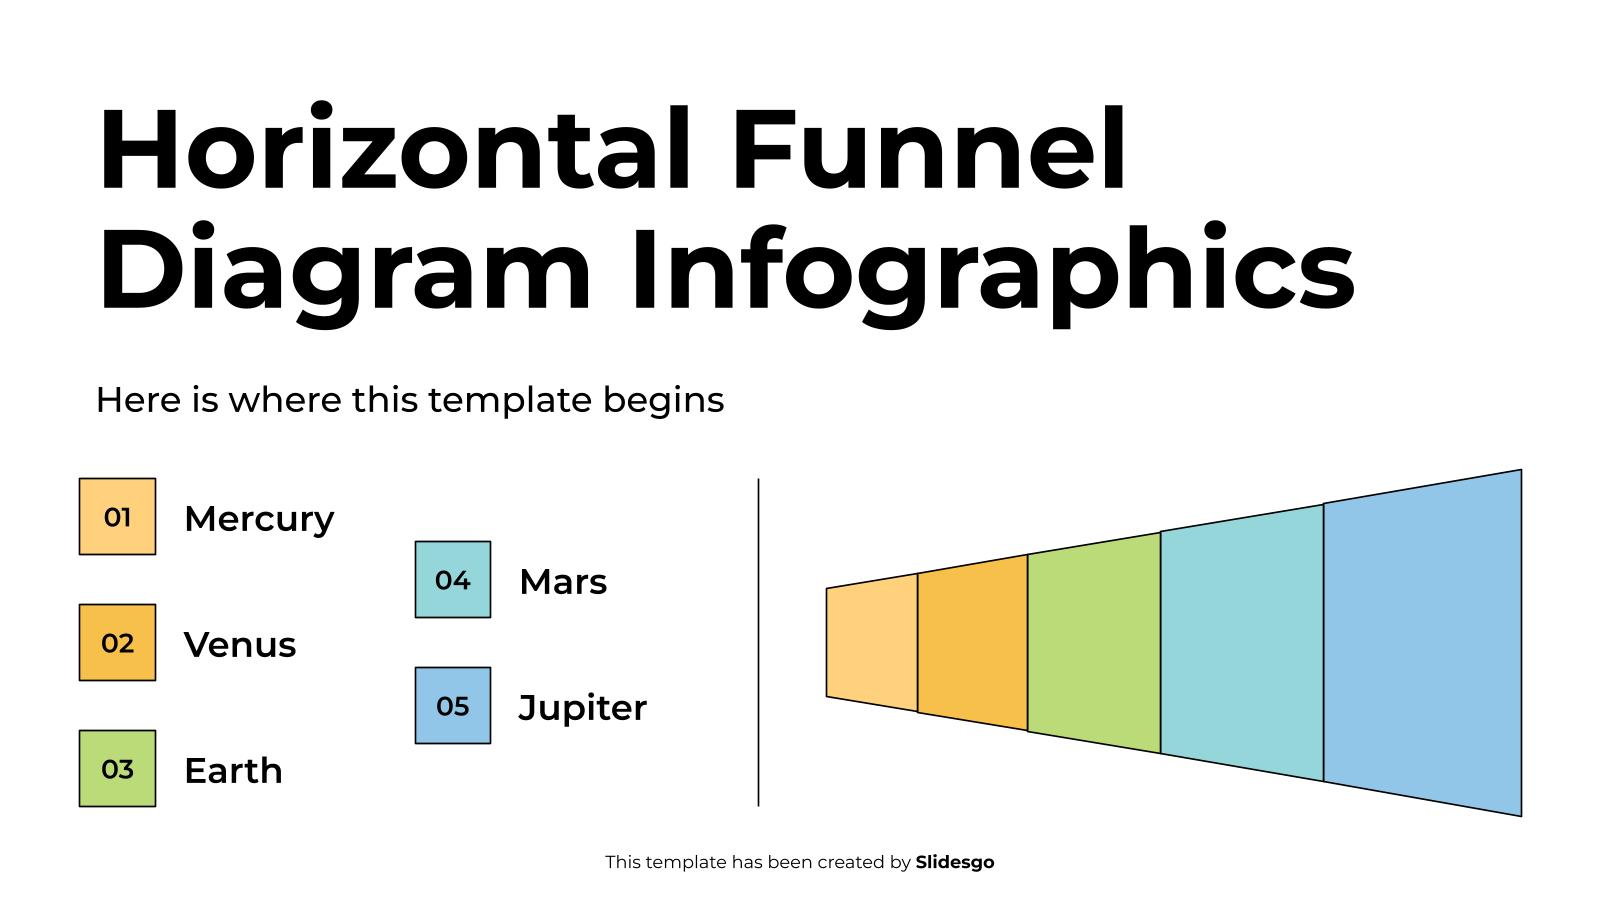
Download the Horizontal Funnel Diagram Infographics template for PowerPoint or Google Slides to get the most out of infographics. Whether you want to organize your business budget in a table or schematically analyze your sales over the past year, this set of infographic resources will be of great help. Start...

Pyramid diagrams are great for representing hierarchies! As you may imagine, they have a triangular shape. The most important (or main) idea will be placed at the top. This way, the widest part will represent a general idea. They can be used in different arenas: to talk about your products,...

This pack of infographics is intended for marketing gurus. We propose several ways of representing data within several well-known frameworks in marketing. If “PESTLE”, “SWOT” or “7S” sound familiar to you, do not hesitate to download this template and start editing the contents with some campaign results or analyses!
Download the Lead Funnel Infographics template for PowerPoint or Google Slides to get the most out of infographics. Whether you want to organize your business budget in a table or schematically analyze your sales over the past year, this set of infographic resources will be of great help. Start using...

Download the "Lead Funnel Infographics" template for PowerPoint or Google Slides and discover the power of infographics. An infographic resource gives you the ability to showcase your content in a more visual way, which will make it easier for your audience to understand your topic. Slidesgo infographics like this set...