Funnel Infographics Presentation templates - Page 2
There's a type of chart, diagram or infographics (depending on who you ask) that shows a progression of different blocks of data in increasing or decreasing order and, as such, are called "funnel". How convenient! Slidesgo has some sets of these infographics for Google Slides and PowerPoint presentations, totally customizable and adaptable!


It seems that you like this template!

Register for free and start downloading now
Download the Sales Funnel Growth template for PowerPoint or Google Slides to get the most out of infographics. Whether you want to organize your business budget in a table or schematically analyze your sales over the past year, this set of infographic resources will be of great help. Start using...
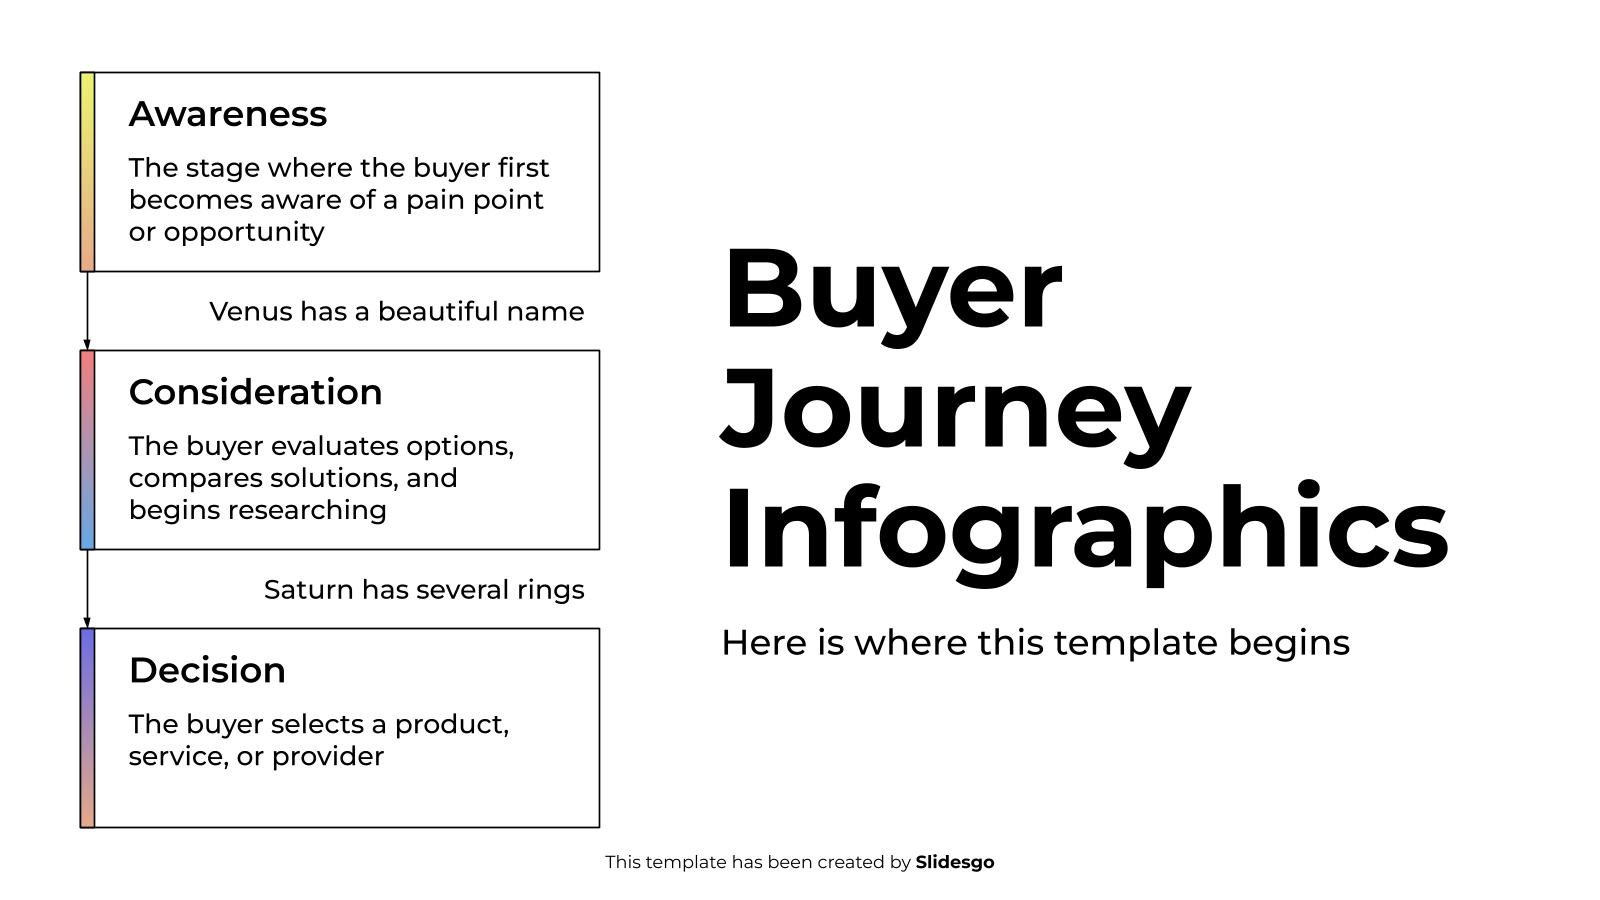
Download the Buyer Journey Infographics template for PowerPoint or Google Slides to get the most out of infographics. Whether you want to organize your business budget in a table or schematically analyze your sales over the past year, this set of infographic resources will be of great help. Start using...
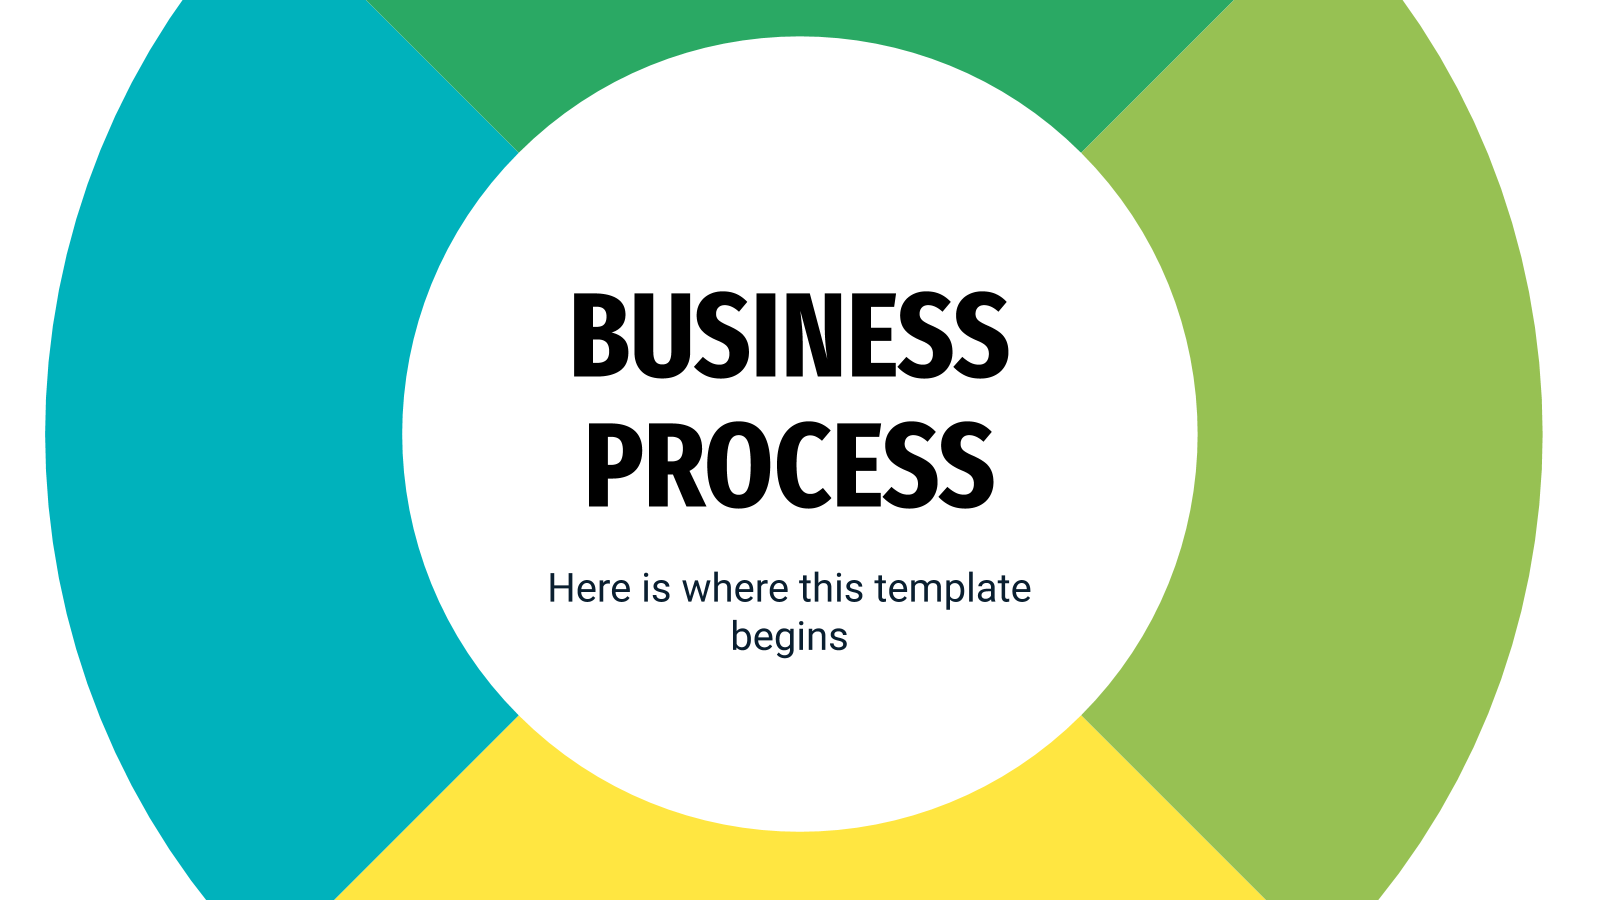
The following set of infographics has been designed to represent the making of business processes. As such, most of the designs involve different steps or phases, each one with different colors for maximum clarity. Some slides incorporate timelines, others make use of cycle diagrams, others look like tables... There's a...
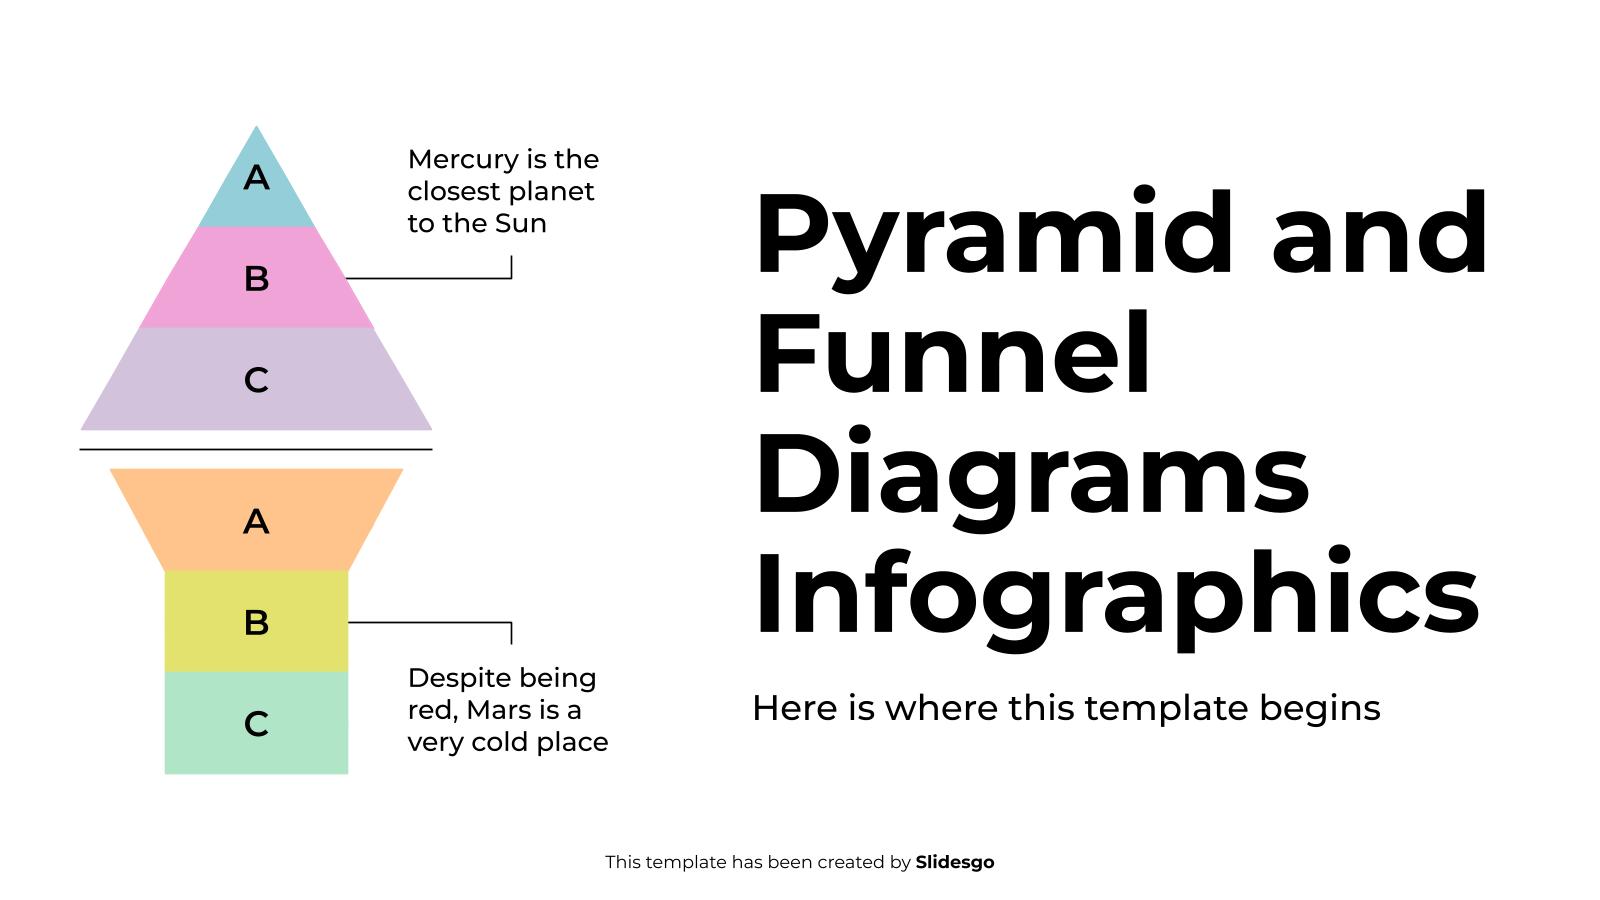
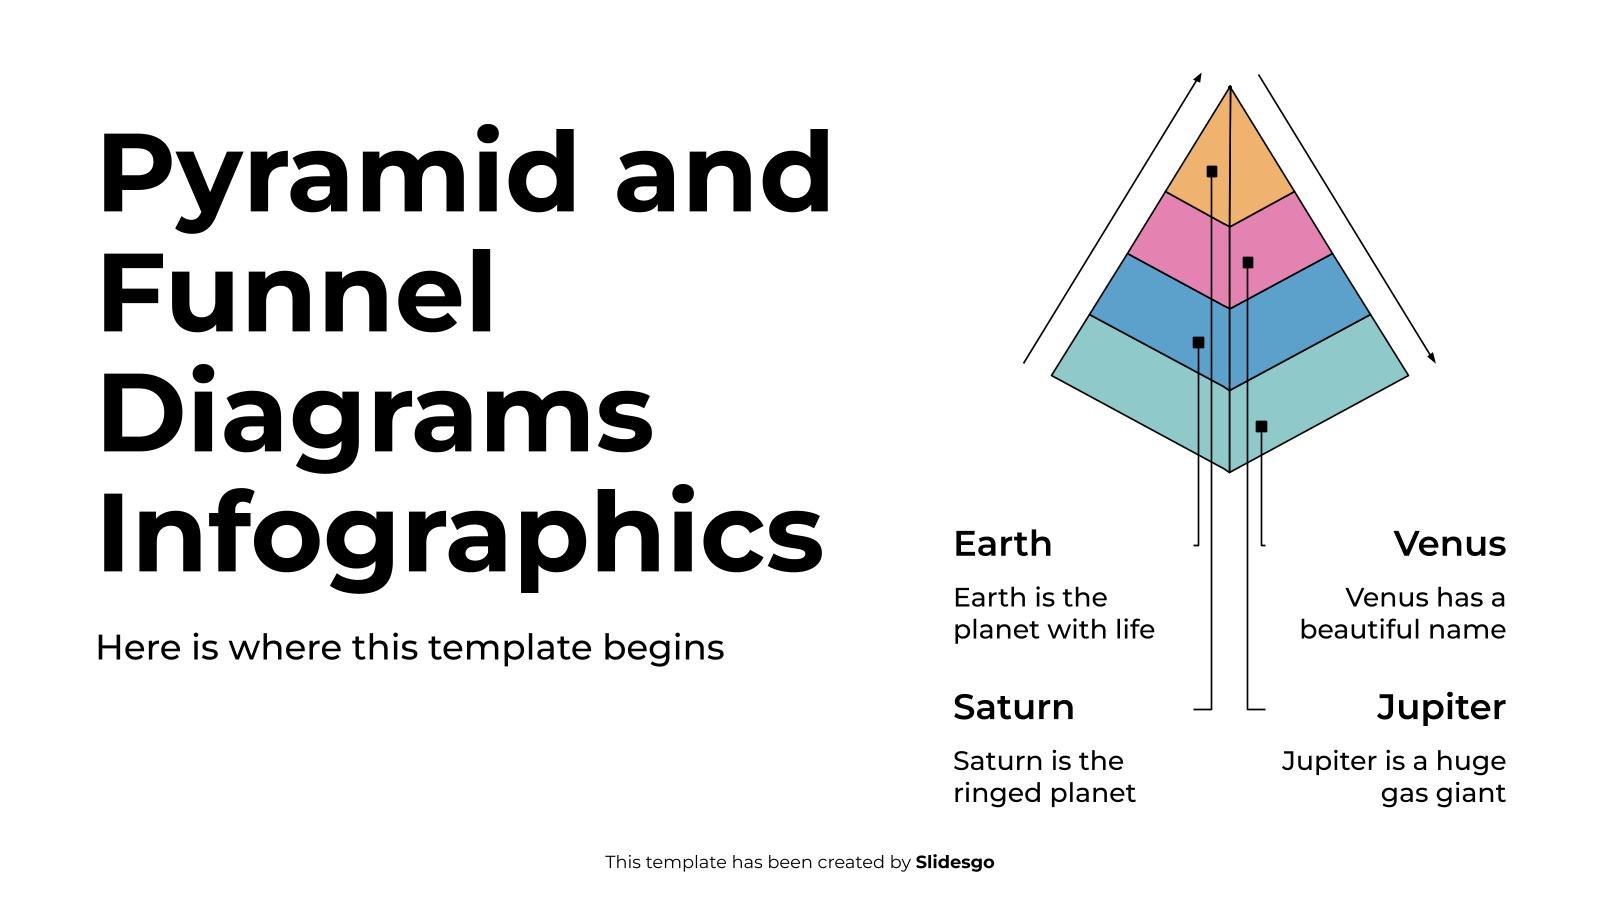
Download the Pyramid and Funnel Diagrams Infographics template for PowerPoint or Google Slides to get the most out of infographics. Whether you want to organize your business budget in a table or schematically analyze your sales over the past year, this set of infographic resources will be of great help....
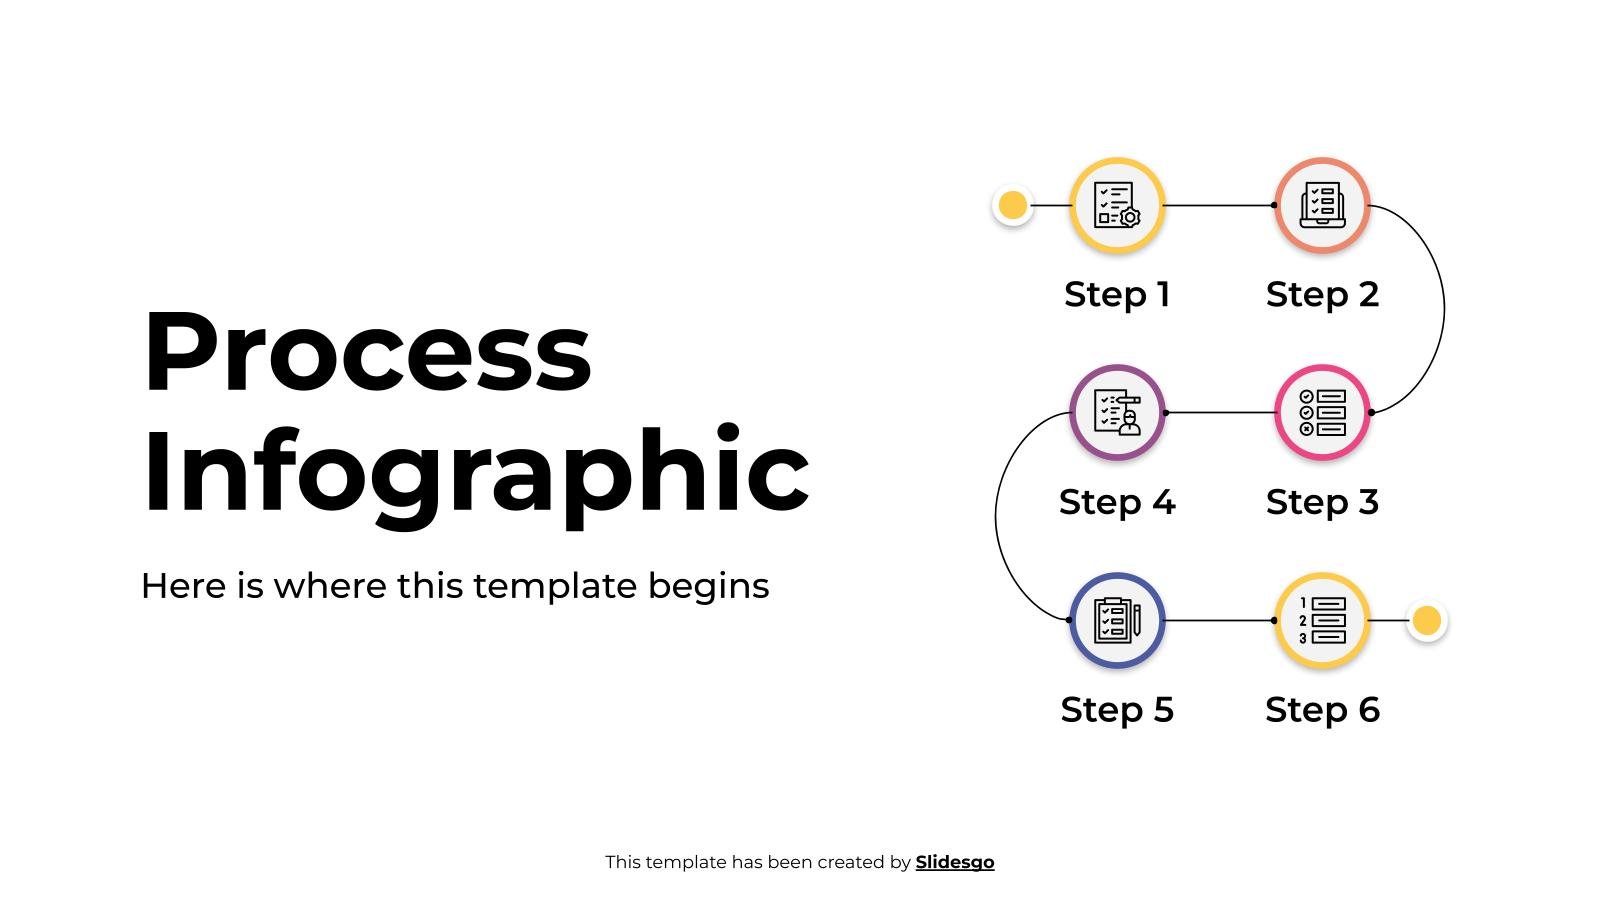
Download the Process Infographics template for PowerPoint or Google Slides to get the most out of infographics. Whether you want to organize your business budget in a table or schematically analyze your sales over the past year, this set of infographic resources will be of great help. Start using infographics...

Imagine this: a swirling vortex of information that leads you straight down a path to success. That's the power of a great funnel infographic. With a little bit of creativity, these editable visual aids can guide potential customers through the twists and turns of the decision-making process with ease. And...

Download the Language Arts Subject for Middle School: Artwork Analysis Infographics presentation for PowerPoint or Google Slides. If you’re looking for a way to motivate and engage students who are undergoing significant physical, social, and emotional development, then you can’t go wrong with an educational template designed for Middle School...

Imagine this: a swirling vortex of information that leads you straight down a path to success. That's the power of a great funnel infographic. With a little bit of creativity, these editable visual aids can guide potential customers through the twists and turns of the decision-making process with ease. And...

Maturity models assess different aspects of a company, looking for ways to improve performance and resource allocation. You have already the results? Lay them down in these infographics and show them to your colleagues in a visually appealing way. You can edit these graphs and diagrams to reflect your data...

Your entrepreneurship is starting to come out. Yes, you've decided to run a startup! That sounds great, so let us help you with your presentations: here's our new template full of infographics. This set includes everything you might need: graphs, tables, diagrams, SWOT analyses… They are easily editable and can...

We want to help you better represent visually the strategy or the steps needed in order to achieve a certain goal, and for that we've created these infographics. Review the process from start to finish with your teammates and facilitate the understanding of the data by inserting our designs into...

Account-based marketing tries to break with the thought that "we must sell this product to everyone" and, instead, tries to market several products to an individual customer (or account). The steps to take can be explained visually in these editable infographics for presentations. We've created a good variety of flat-styled...

Managing a company's revenue can be a complicated task. However, from Slidesgo we want to help you and, for that reason, here you have a set of infographics on revenue management. With the 32 infographics included, organize your company's performance and take advantage of all the resources included, such as...
Download the Pyramid and Funnel Diagrams Infographics template for PowerPoint or Google Slides to get the most out of infographics. Whether you want to organize your business budget in a table or schematically analyze your sales over the past year, this set of infographic resources will be of great help....

Make your sales strategy understandable and impress everyone with this business template. Use the different infographics to explain the whole process from start to finish. Show all the different elements of the sales procedure and how they interact with each other and indicate the goals and deadlines of your plan.

Download the Sales Progress Infographics template for PowerPoint or Google Slides to get the most out of infographics. Whether you want to organize your business budget in a table or schematically analyze your sales over the past year, this set of infographic resources will be of great help. Start using...

Imagine this: a swirling vortex of information that leads you straight down a path to success. That's the power of a great funnel infographic. With a little bit of creativity, these editable visual aids can guide potential customers through the twists and turns of the decision-making process with ease. And...

These traction infographics present different data categories. They are helpful to deal with investments, companies, startups, goals, big data… We have included bar, circle, pie charts, pyramids, banners.