The latest Google Slides themes and PowerPoint templates - Page 1713
Download our cool PowerPoint templates and Google Slides themes to create attractive designs for your presentations. Make the most of the beautiful backgrounds and take advantage of the easy-to-edit resources included.


It seems that you like this template!

Register for free and start downloading now
Comparing items or listing items is easy if you use triangle infographics. They are pretty helpful, no matter which type or numeric data you want to present. Employ steps, timelines, progressions, calendars, funnels, anatomic infographics or the blocks we include!
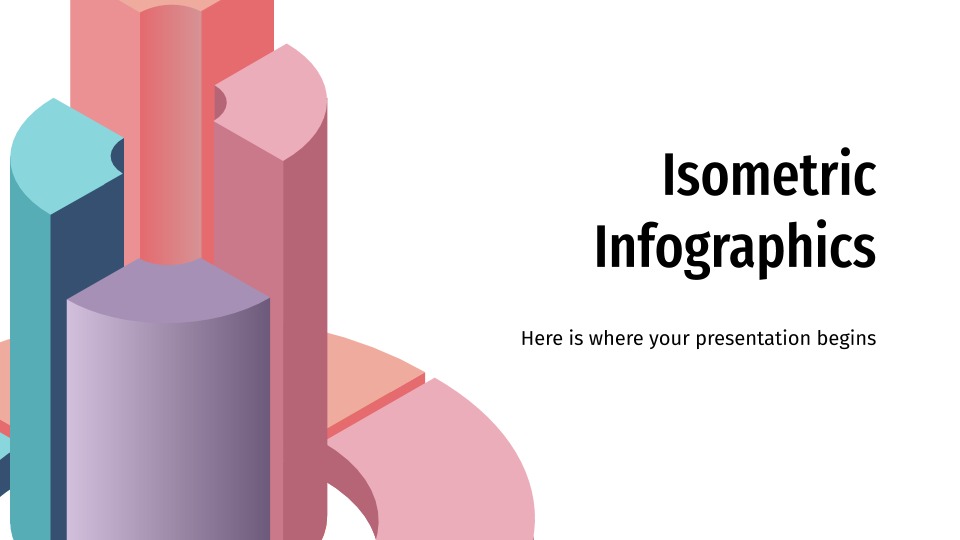
Talk about your data and show it in a visual way using Isometric Infographics. They are ideal to compare items as well! The design is isometric, with 3D touches. You’ll find timelines, steps, processes, comparatives, pyramids, radial and pie charts, blocks and many other resources.

Create a cool sales strategy for your fashion company with this pitch deck. Talk about problems that you can solve thanks to your product or service, competitors and provide reliable data using infographics and a SWOT analysis.

Create your own workshop about stamping with this creative presentation. Give a brief outline of the theory, features, tips and practical exercises and add some maps. Your students will love it!

If you need to present your data in a visual way and to compare different items, banner infographics are simply perfect for you. They include steps, processes, blocks, tables, price tables or comparisons, so they are multi-purpose. There are four sections per slide.

It’s time to advertise your digital company with this presentation full of gradients. Talk about your company, provide data, edit its maps and work with tables and timelines. Get ready to succeed!

Use our newest presentation to talk about breakthroughs and medical discoveries. It’s simple, it includes lovely illustrations and it also contains sections to talk about the objectives, methodology, results and conclusions. Employ the different infographics that we have inserted in these slides!

Use these stairs infographics to represent different levels, stages or processes in ascending or descending order. They can be very helpful in business. You’ll find different designs: 3D, isometric, flat, filled, timelines… Give them a go.
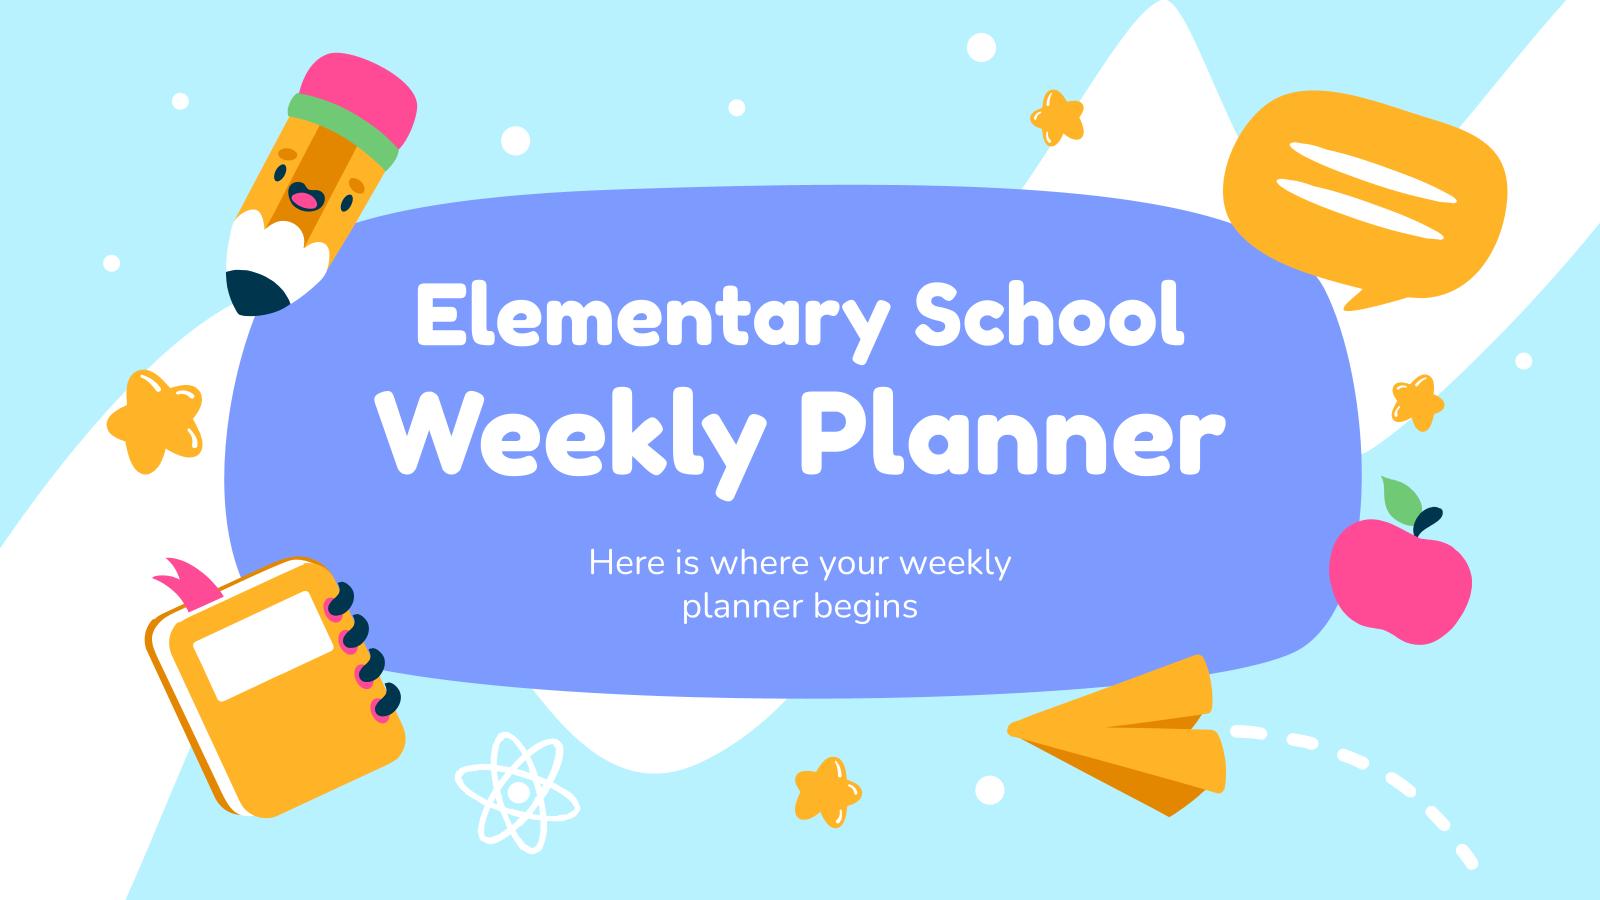
Help your students organize their weeks with this cool planner. It contains lots of cute illustrations that your pupils will recognize easily. There are tables, graphs, to-do lists and many more helpful sections.

Share the company newsletter with the rest of the team using this template with a retro color palette. Talk about announcements, events, new hirings and much more. You’ll also find some infographics at your disposal to help you present your information.

Are you looking for a professional template with geometric patterns and illustrations that you can adapt to your own project? This IT Services template is versatile: give some details about your analyses, conclusions or represent your data with maps and graphs.

Represent educational pieces of information with these infographics that look like pencils. They evoke different topics like education, learning, school, writing, creativity, kids... We have included banners, text blocks, timelines and charts. Let’s go back to school!

Planning a meeting related to administrative tasks will be a piece of cake thanks to this new presentation. Let your team know about the project schedule, status report, timelines and upcoming events and show different graphs and maps.

Time to defend your thesis on planets and stars! We have just created a presentation with many illustrations that is perfect for you. Provide some info about your objectives, methodology, results and conclusions and show your data using timelines or pie charts.

Present the different uses of the internet for your marketing purposes with these infographics. It’s great for e-commerce. It includes different sorts of resources with many designs: hand-drawn, flat, filled… They are pretty creative. They include up to 6 sections per slide.

These Supply Chain Infographics are great to explain the production and relation between a given company and its suppliers until the product reaches the final buyer. It is also great to represent the steps of a product or service until someone buys it. To do so, we have added different...

Design now a Business Plan for your Agriculture company with this presentation. It contains a food pattern in the background, pictures and illustrations. Provide a business overview, market analysis, marketing plan, management plan or financial plan thanks to its different sections.

If you are a financial advisor, why don’t you try this Marketing Plan presentation? Talk about your company, market analysis, content plan, KPI overview and edit the different timelines and infographics.