
Diagram Infographics Presentation templates - Page 4
Do you have some concepts that are related to each other? It's good to put your trust in infographics, especially if you want leave your audience in awe and clapping!


It seems that you like this template!

Register for free and start downloading now
Download the Cycle Diagrams Infographics template for PowerPoint or Google Slides to get the most out of infographics. Whether you want to organize your business budget in a table or schematically analyze your sales over the past year, this set of infographic resources will be of great help. Start using...
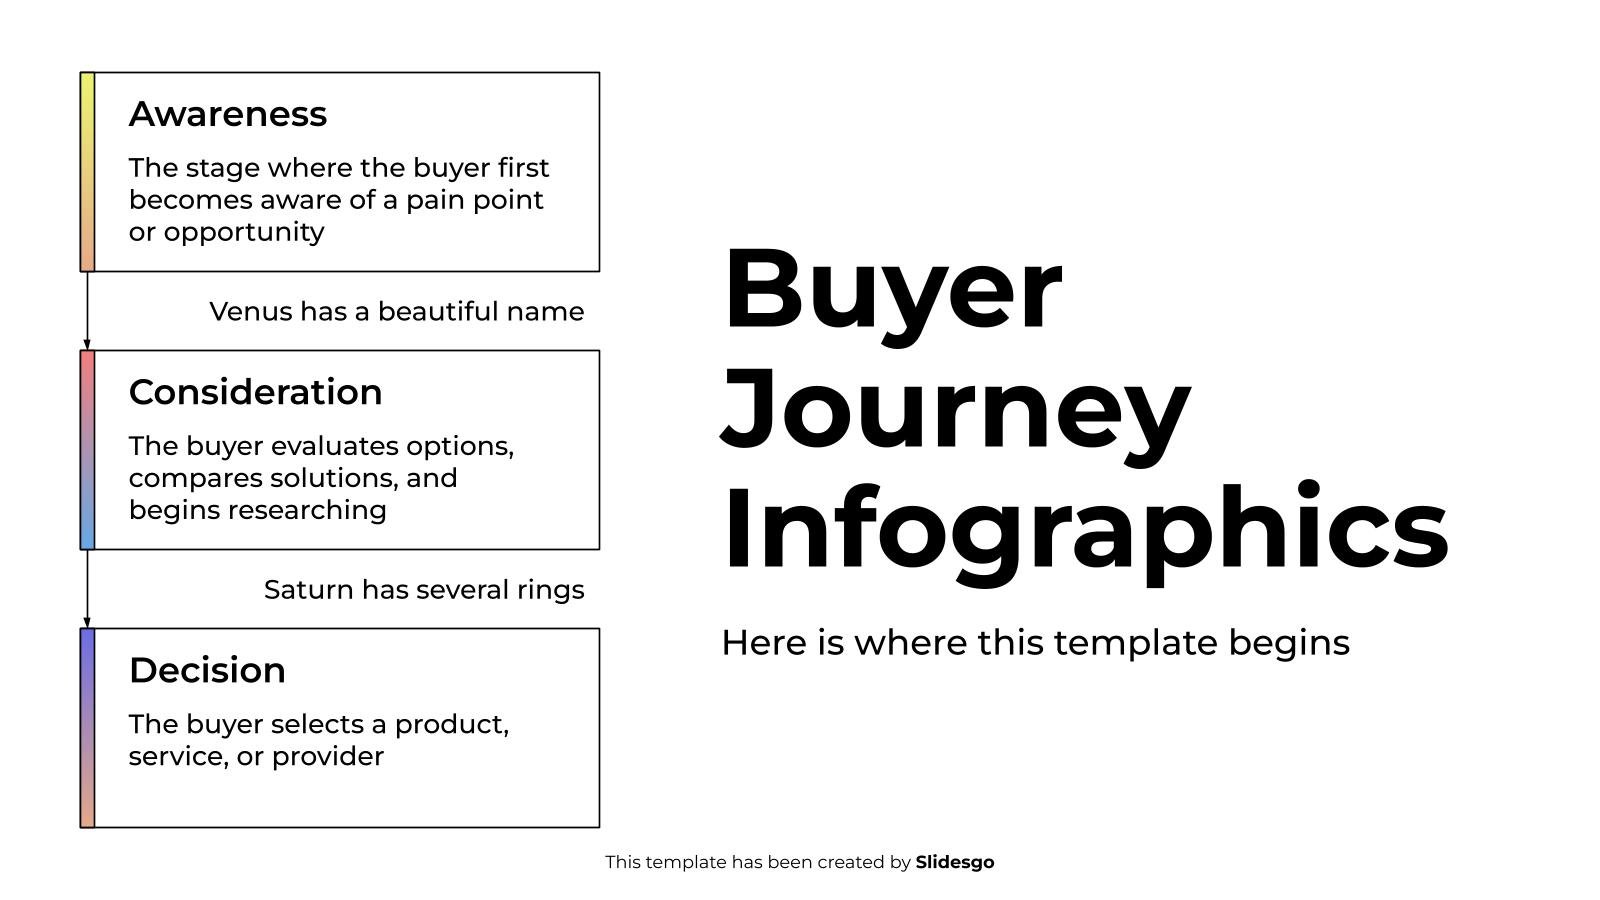
Download the Buyer Journey Infographics template for PowerPoint or Google Slides to get the most out of infographics. Whether you want to organize your business budget in a table or schematically analyze your sales over the past year, this set of infographic resources will be of great help. Start using...

Download the Circular Infographics template for PowerPoint or Google Slides and discover the power of infographics. An infographic resource gives you the ability to showcase your content in a more visual way, which will make it easier for your audience to understand your topic. Slidesgo infographics like this set here...

Download the Change Management Process: Flow Diagrams for Business Infographics template for PowerPoint or Google Slides and discover the power of infographics. An infographic resource gives you the ability to showcase your content in a more visual way, which will make it easier for your audience to understand your topic....

Download the "Medical Disease Explained With Cycle Diagrams" presentation for PowerPoint or Google Slides. Taking care of yourself and of those around you is key! By learning about various illnesses and how they are spread, people can get a better understanding of them and make informed decisions about eating, exercise,...

Download the Change Management Process: Flow Diagrams for a Business Plan Infographics presentation for PowerPoint or Google Slides. Conveying your business plan accurately and effectively is the cornerstone of any successful venture. This template allows you to pinpoint essential elements of your operation while your audience will appreciate the clear...

Download the Circle Infographics template for PowerPoint or Google Slides and discover the power of infographics. An infographic resource gives you the ability to showcase your content in a more visual way, which will make it easier for your audience to understand your topic. Slidesgo infographics like this set here...
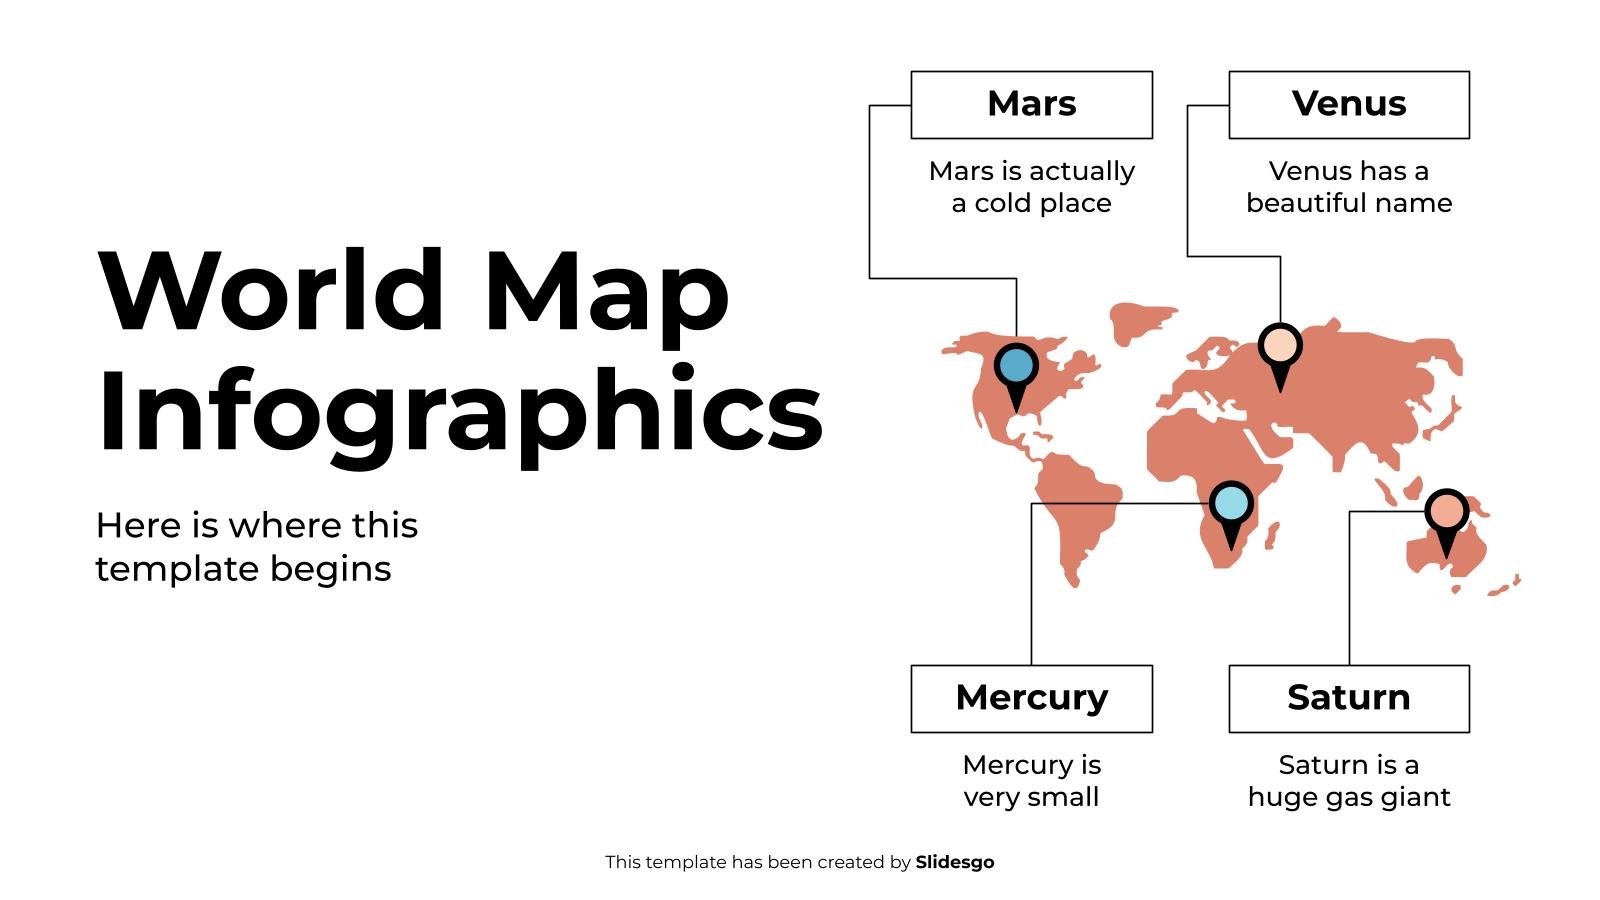
Download the World Map Infographics template for PowerPoint or Google Slides to get the most out of infographics. Whether you want to organize your business budget in a table or schematically analyze your sales over the past year, this set of infographic resources will be of great help. Start using...

If you feel that bullet points and pictures are not doing justice to your company profile, there’s no better way to highlight your achievements and metrics than by spicing up your presentation using creative and visually appealing infographics! Adding infographics to your company profile can vividly illustrate even the most...

Download the Cycle Diagrams Theme for Education presentation for PowerPoint or Google Slides. The education sector constantly demands dynamic and effective ways to present information. This template is created with that very purpose in mind. Offering the best resources, it allows educators or students to efficiently manage their presentations and...

Download the "Medical Cycle Diagrams Theme" presentation for PowerPoint or Google Slides. Healthcare goes beyond curing patients and combating illnesses. Raising awareness about diseases, informing people about prevention methods, discussing some good practices, or even talking about a balanced diet—there are many topics related to medicine that you could be...

Download the Venn Diagram Infographics template for PowerPoint or Google Slides to get the most out of infographics. Whether you want to organize your business budget in a table or schematically analyze your sales over the past year, this set of infographic resources will be of great help. Start using...

Radial diagrams are great to compare quantitative variables. They appear as circles, some of them are concentric. They are colorful, and they also show flat, filled, colorful, linear styles, and sometimes you’ll see them as arrows. You’ll find up to 8 sections in each diagram.

What you’ll find in this template is a nice set of ring-shaped infographics with a 3D effect that simulates depth. These are useful for business presentations where data must be shown clearly and understood by the audience at a glance.

Download the "Cycle Diagrams Theme for a Company Profile" presentation for PowerPoint or Google Slides. Presenting a comprehensive company profile can be a game-changer for your business. A well-crafted profile connects with potential clients and vendors on another level, giving them a deep understanding of your organization. This company profile...

Download the Corporate Org Chart Infographics template for PowerPoint or Google Slides to get the most out of infographics. Whether you want to organize your business budget in a table or schematically analyze your sales over the past year, this set of infographic resources will be of great help. Start...

Download the "Cycle Diagrams Theme for a Business Plan" presentation for PowerPoint or Google Slides. Conveying your business plan accurately and effectively is the cornerstone of any successful venture. This template allows you to pinpoint essential elements of your operation while your audience will appreciate the clear and concise presentation,...
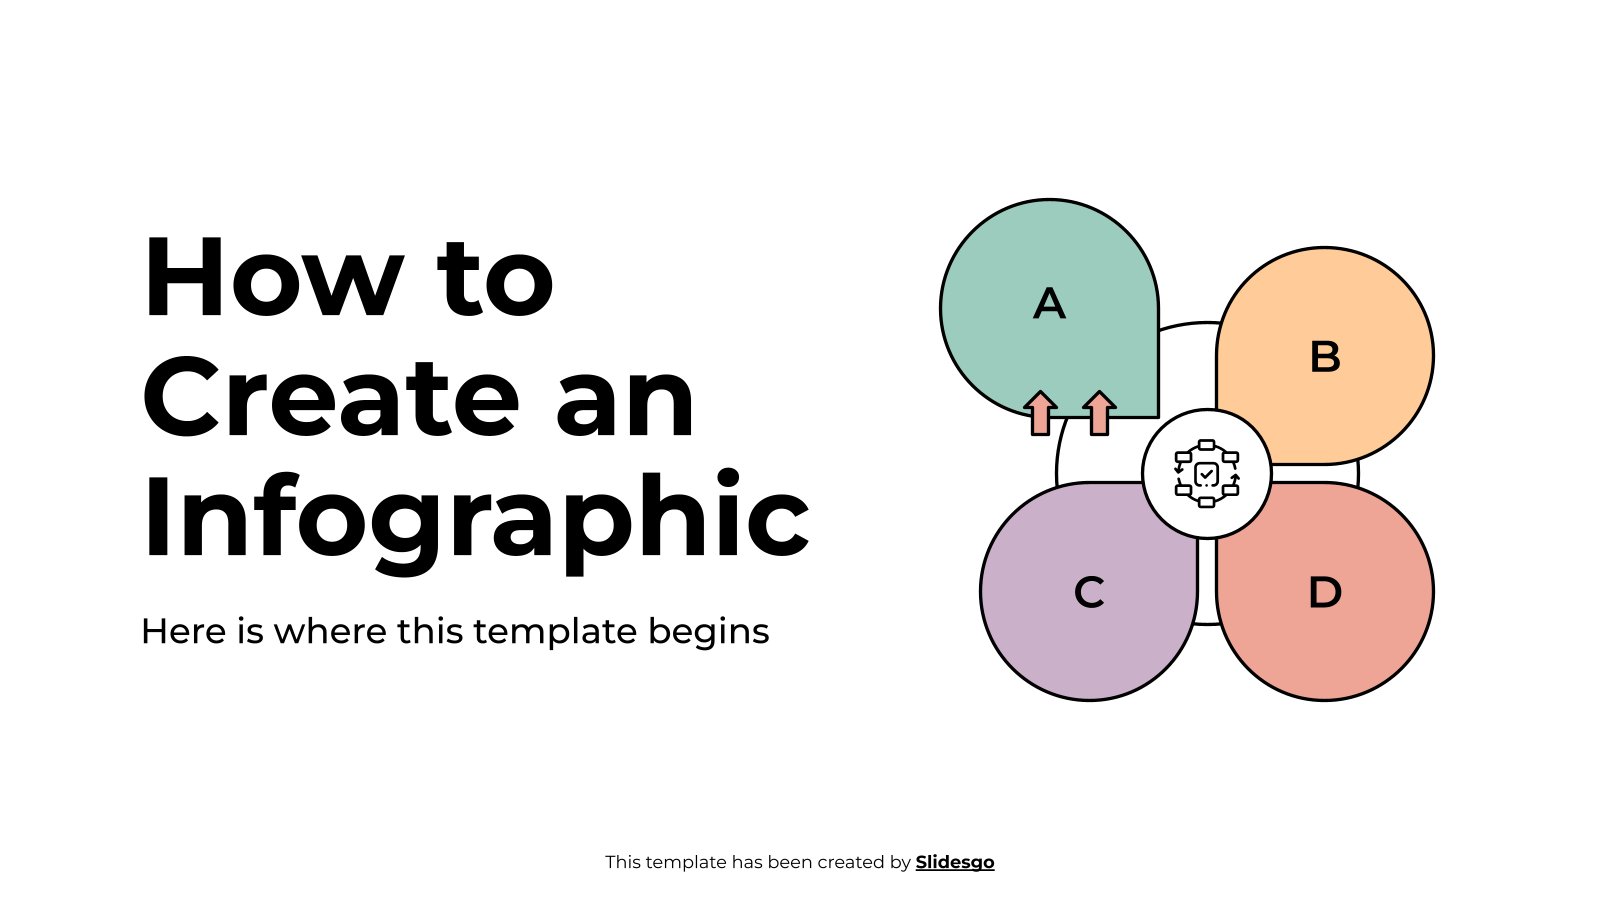
Download the How To Create An Infographic template for PowerPoint or Google Slides and discover the power of infographics. An infographic resource gives you the ability to showcase your content in a more visual way, which will make it easier for your audience to understand your topic. Slidesgo infographics like...