Diagram Infographics Presentation templates - Page 3
Do you have some concepts that are related to each other? It's good to put your trust in infographics, especially if you want leave your audience in awe and clapping!


It seems that you like this template!

Register for free and start downloading now
If you need infographics that depict the origin of a given event, these cause and effect diagrams are perfect for you. Use them to show details about your company, to present your marketing strategy or when preparing your classes. Download them now!
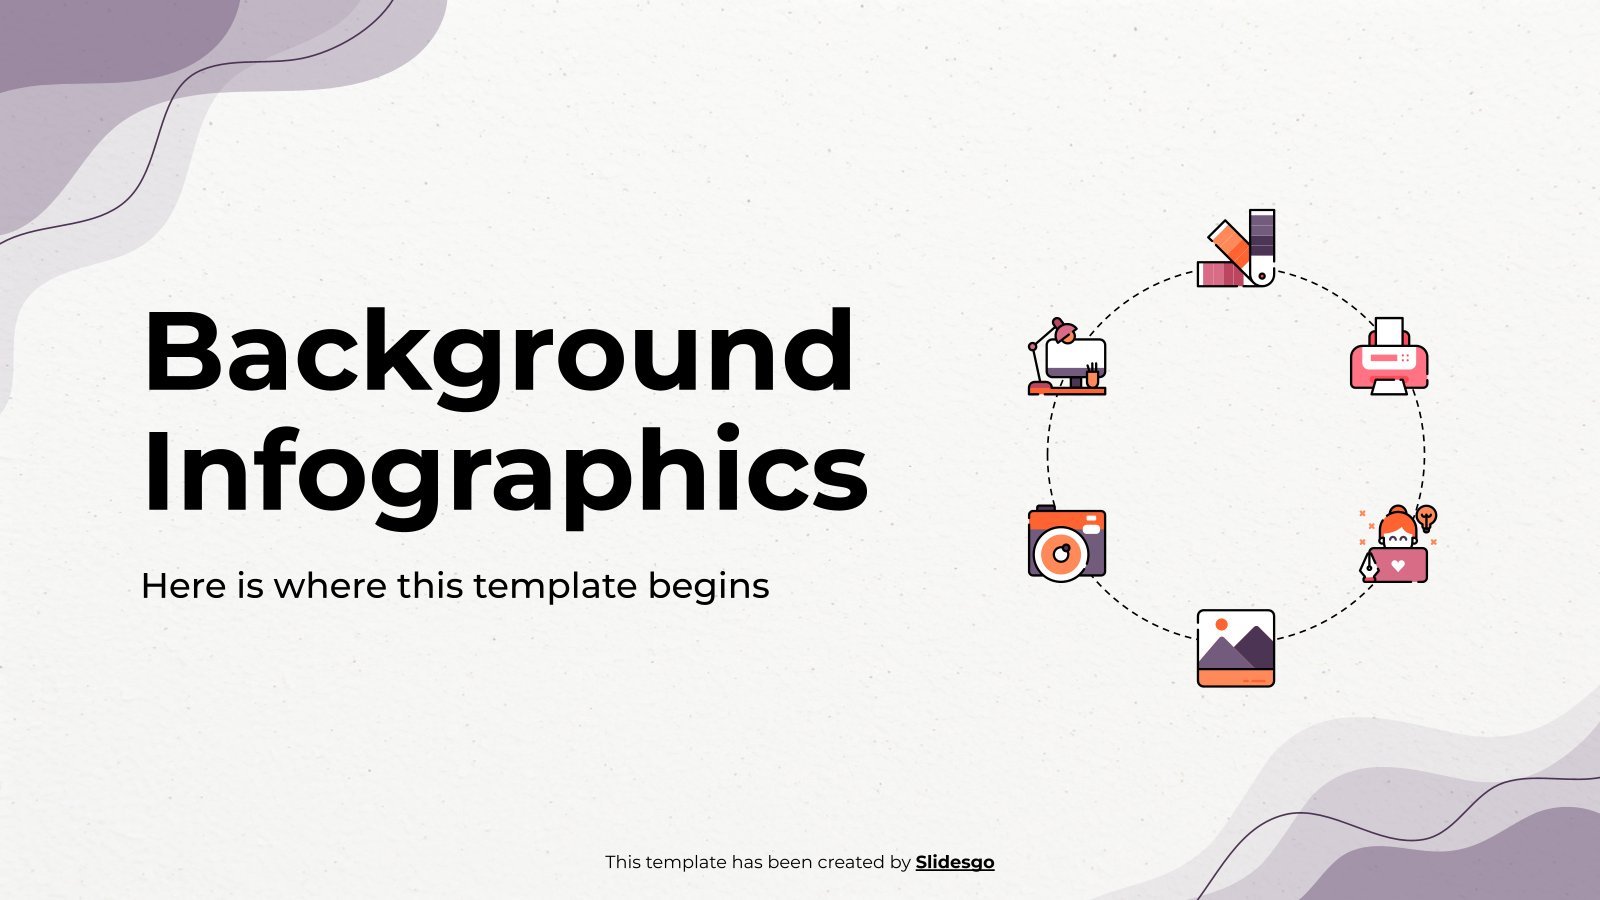
Download the Background Infographics presentation for PowerPoint or Google Slides. High school students are approaching adulthood, and therefore, this template’s design reflects the mature nature of their education. Customize the well-defined sections, integrate multimedia and interactive elements and allow space for research or group projects—the possibilities of this engaging and...

A great way of speaking about this year’s lessons is a petal. Petals have been used for organization and visualization of ideas for many years, and their effectivity is undeniable. There is no better way to go back to school than with this template full of petal infographics for education!...

Download the AI Tech Infographics template for PowerPoint or Google Slides to get the most out of infographics. Whether you want to organize your business budget in a table or schematically analyze your sales over the past year, this set of infographic resources will be of great help. Start using...

Flowcharts are representations of a process or a workflow, and we know that including one in your presentations can be a good idea. All the designs are in linear style, which means that shapes have no color fill, only stroke. Give them a try!
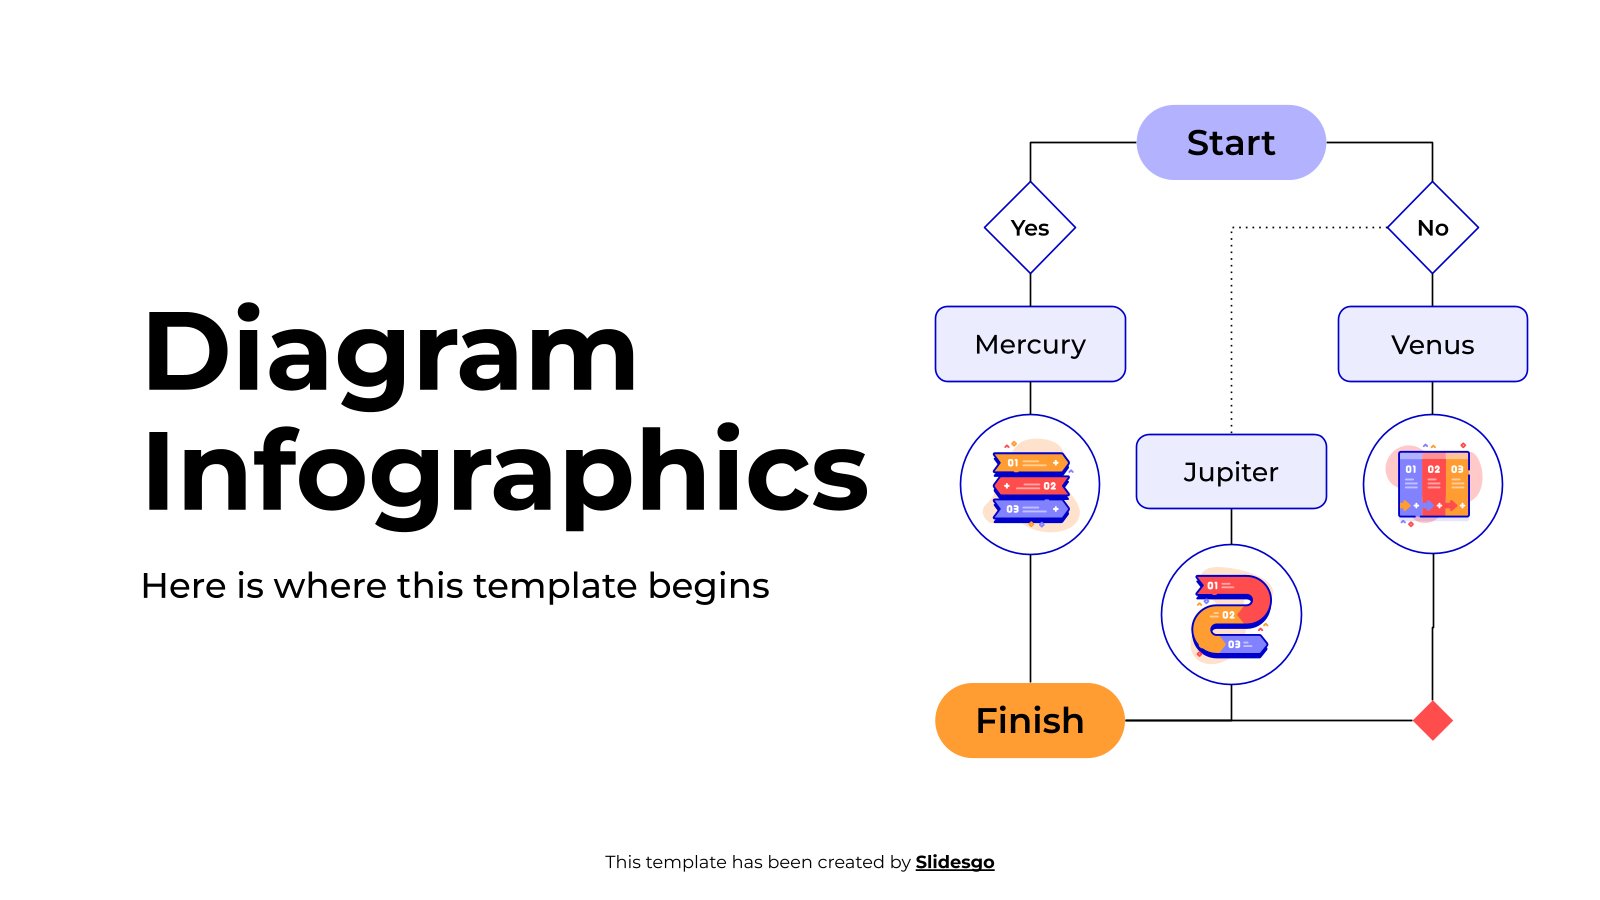
Download the Diagram Infographics template for PowerPoint or Google Slides and discover the power of infographics. An infographic resource gives you the ability to showcase your content in a more visual way, which will make it easier for your audience to understand your topic. Slidesgo infographics like this set here...
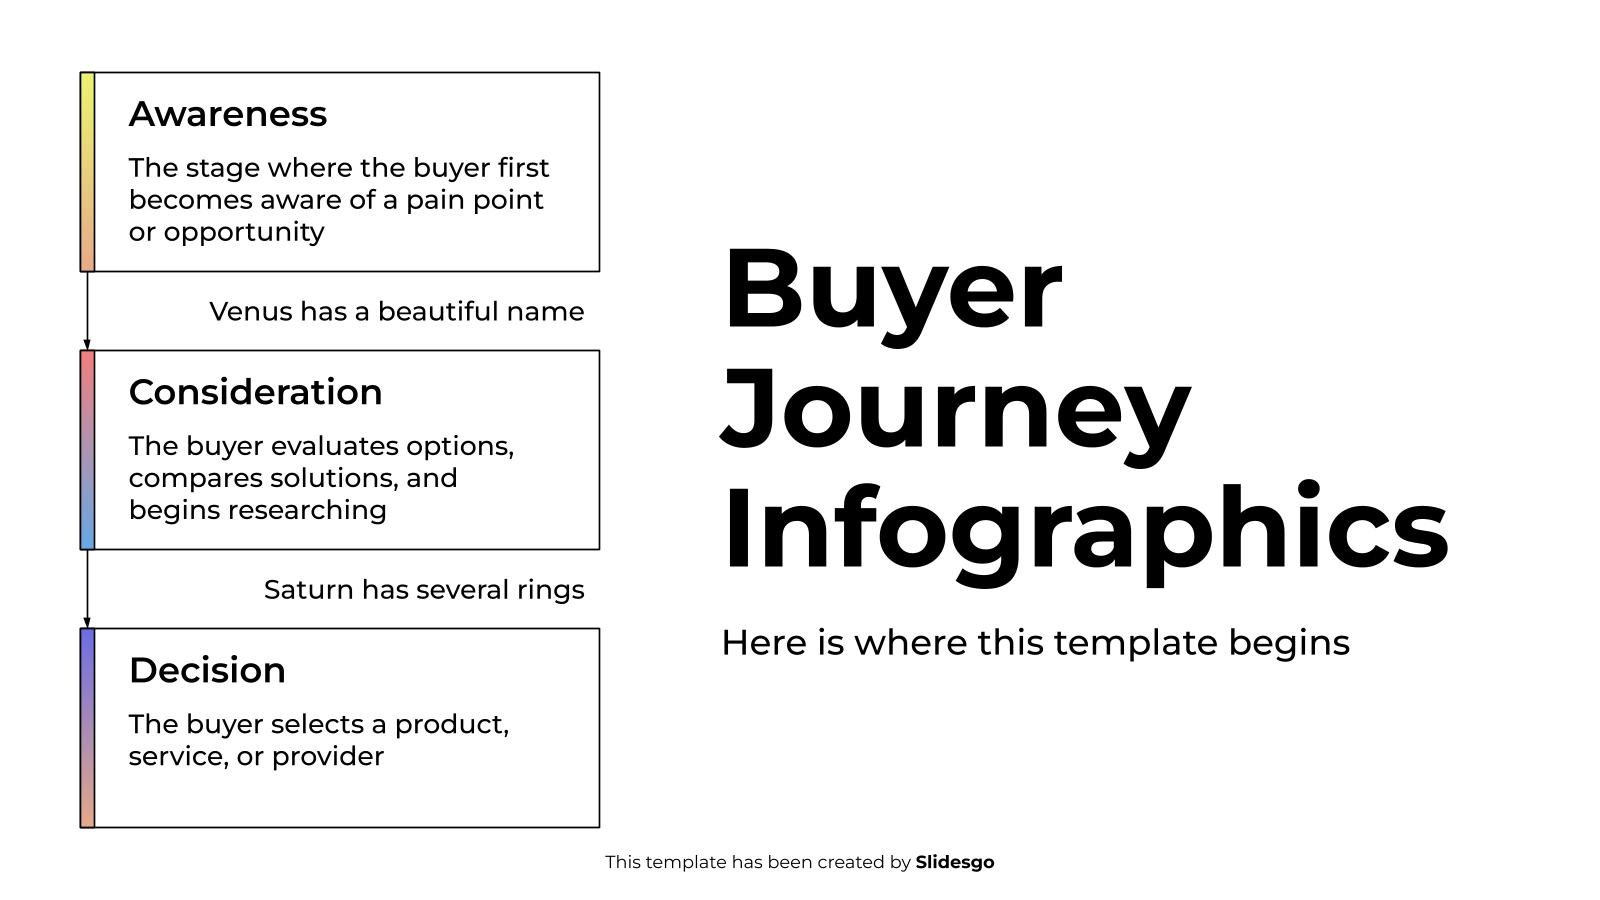
Download the Buyer Journey Infographics template for PowerPoint or Google Slides to get the most out of infographics. Whether you want to organize your business budget in a table or schematically analyze your sales over the past year, this set of infographic resources will be of great help. Start using...

Download the Data Driven Infographics template for PowerPoint or Google Slides to get the most out of infographics. Whether you want to organize your business budget in a table or schematically analyze your sales over the past year, this set of infographic resources will be of great help. Start using...

Download the Goal Alignment Diagram Infographics template for PowerPoint or Google Slides to get the most out of infographics. Whether you want to organize your business budget in a table or schematically analyze your sales over the past year, this set of infographic resources will be of great help. Start...
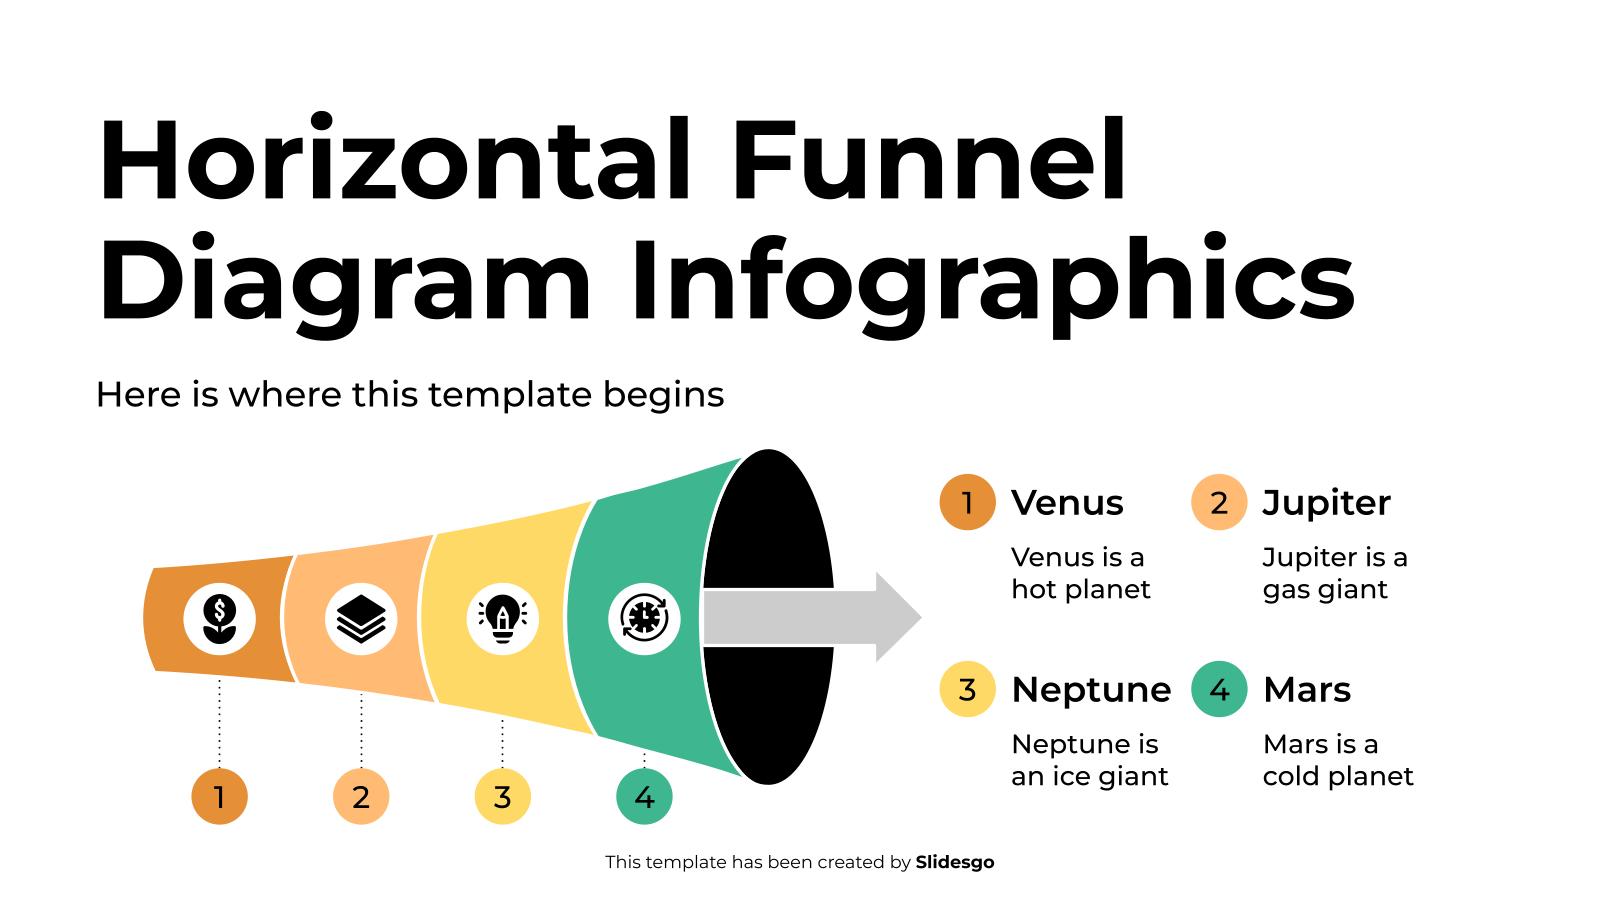
Download the Horizontal Funnel Diagram Infographics template for PowerPoint or Google Slides to get the most out of infographics. Whether you want to organize your business budget in a table or schematically analyze your sales over the past year, this set of infographic resources will be of great help. Start...

If you like to keep your work organized, take a look at this infographic template. It has a colorful design that mimics sticky notes, and they will be great to keep everything under control and not forget any important task or event. The typography is sans serif and includes different...

Download the Corporate Org Chart Infographics template for PowerPoint or Google Slides to get the most out of infographics. Whether you want to organize your business budget in a table or schematically analyze your sales over the past year, this set of infographic resources will be of great help. Start...

Download the Newsletter with Cycle Diagrams presentation for PowerPoint or Google Slides. Attention all marketers! Are you looking for a way to make your newsletters more creative and eye-catching for your target audience? This amazing template is perfect for creating the perfect newsletter that will capture your audience's attention from...

Download the Venn Diagram Infographics template for PowerPoint or Google Slides to get the most out of infographics. Whether you want to organize your business budget in a table or schematically analyze your sales over the past year, this set of infographic resources will be of great help. Start using...

Download the Diagram Infographics template for PowerPoint or Google Slides to get the most out of infographics. Whether you want to organize your business budget in a table or schematically analyze your sales over the past year, this set of infographic resources will be of great help. Start using infographics...

Download the Science Process Diagrams template for PowerPoint or Google Slides and discover this set of editable infographics for education presentations. These resources, from graphs to tables, can be combined with other presentations or used independently. The most important thing is what you will achieve: transmit information in an orderly...
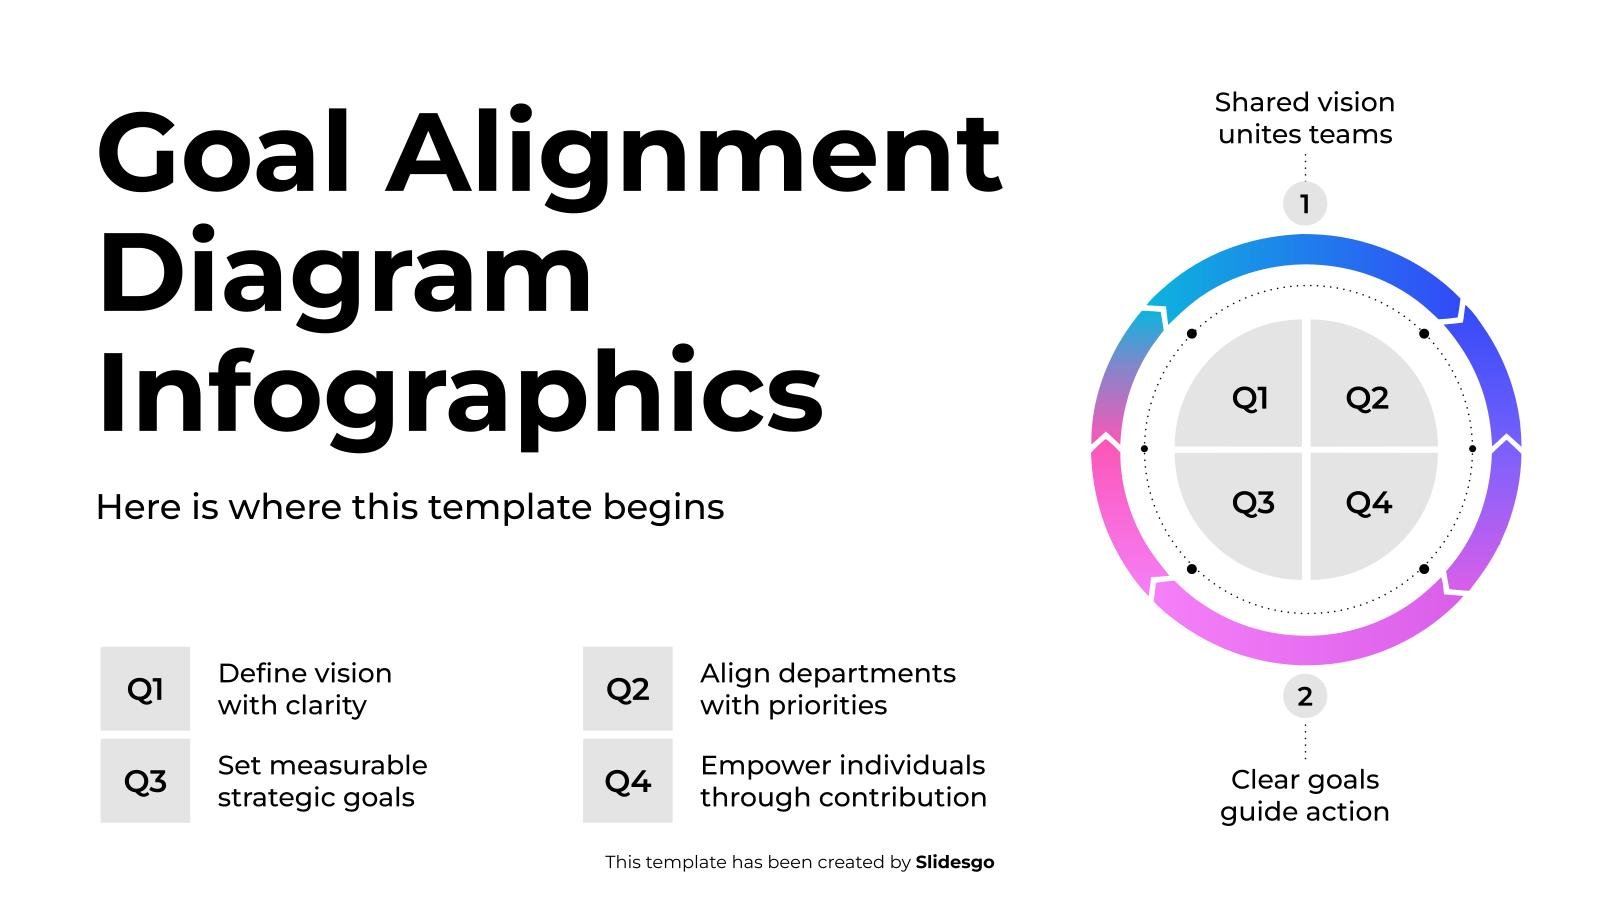
Download the Goal Alignment Diagram Infographics template for PowerPoint or Google Slides to get the most out of infographics. Whether you want to organize your business budget in a table or schematically analyze your sales over the past year, this set of infographic resources will be of great help. Start...

Download the "Medical Cycle Diagrams Theme" presentation for PowerPoint or Google Slides. Healthcare goes beyond curing patients and combating illnesses. Raising awareness about diseases, informing people about prevention methods, discussing some good practices, or even talking about a balanced diet—there are many topics related to medicine that you could be...