


Like
Share


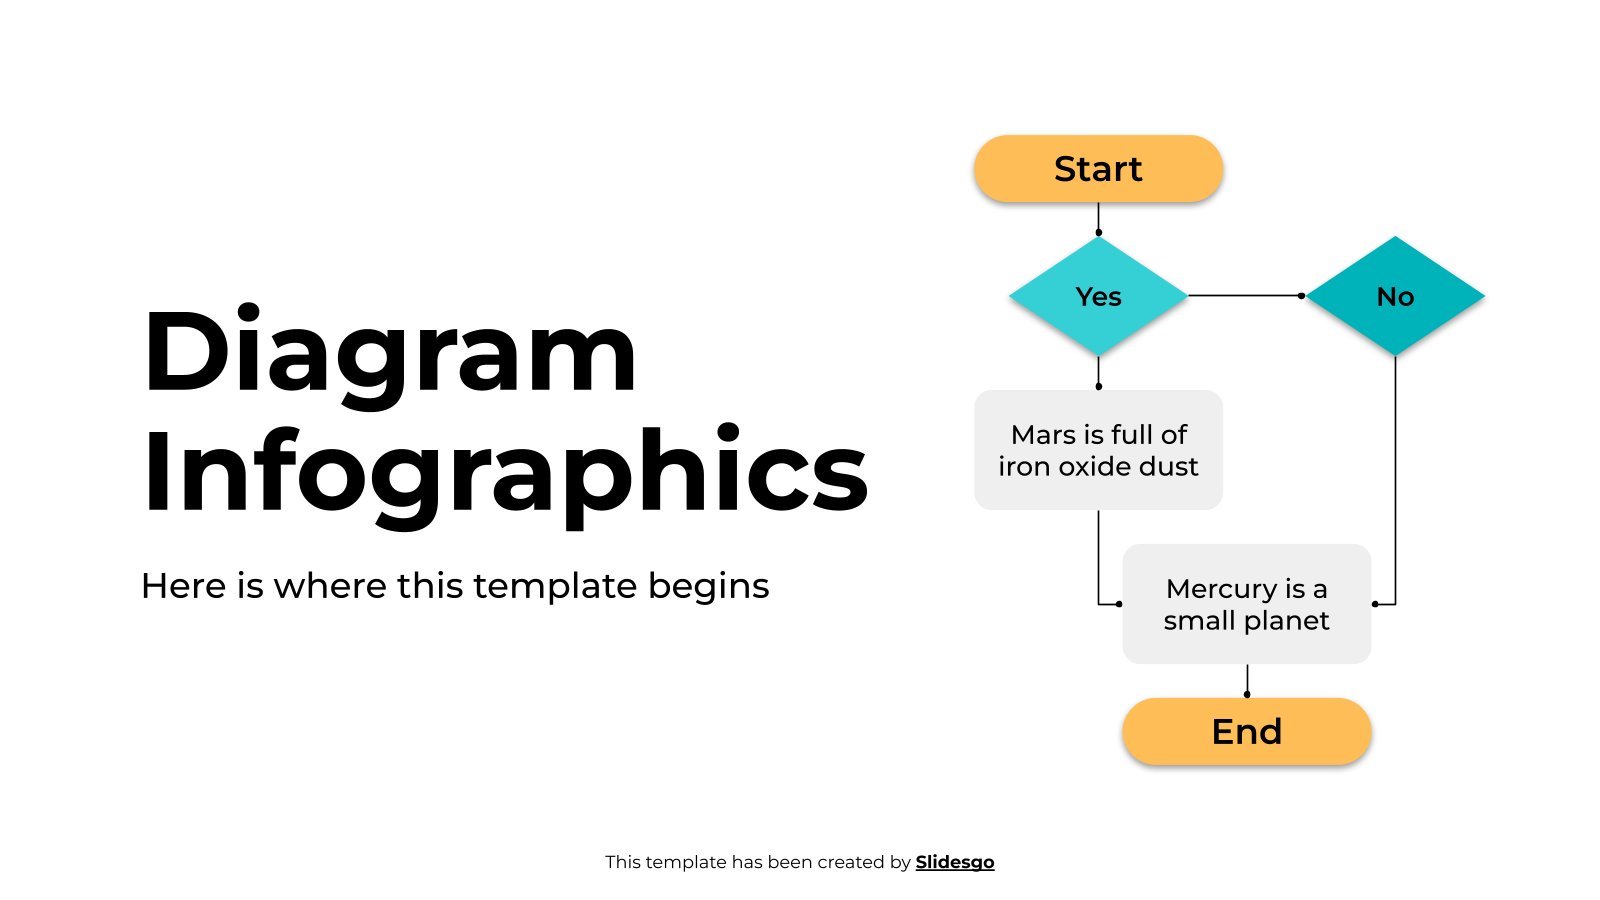
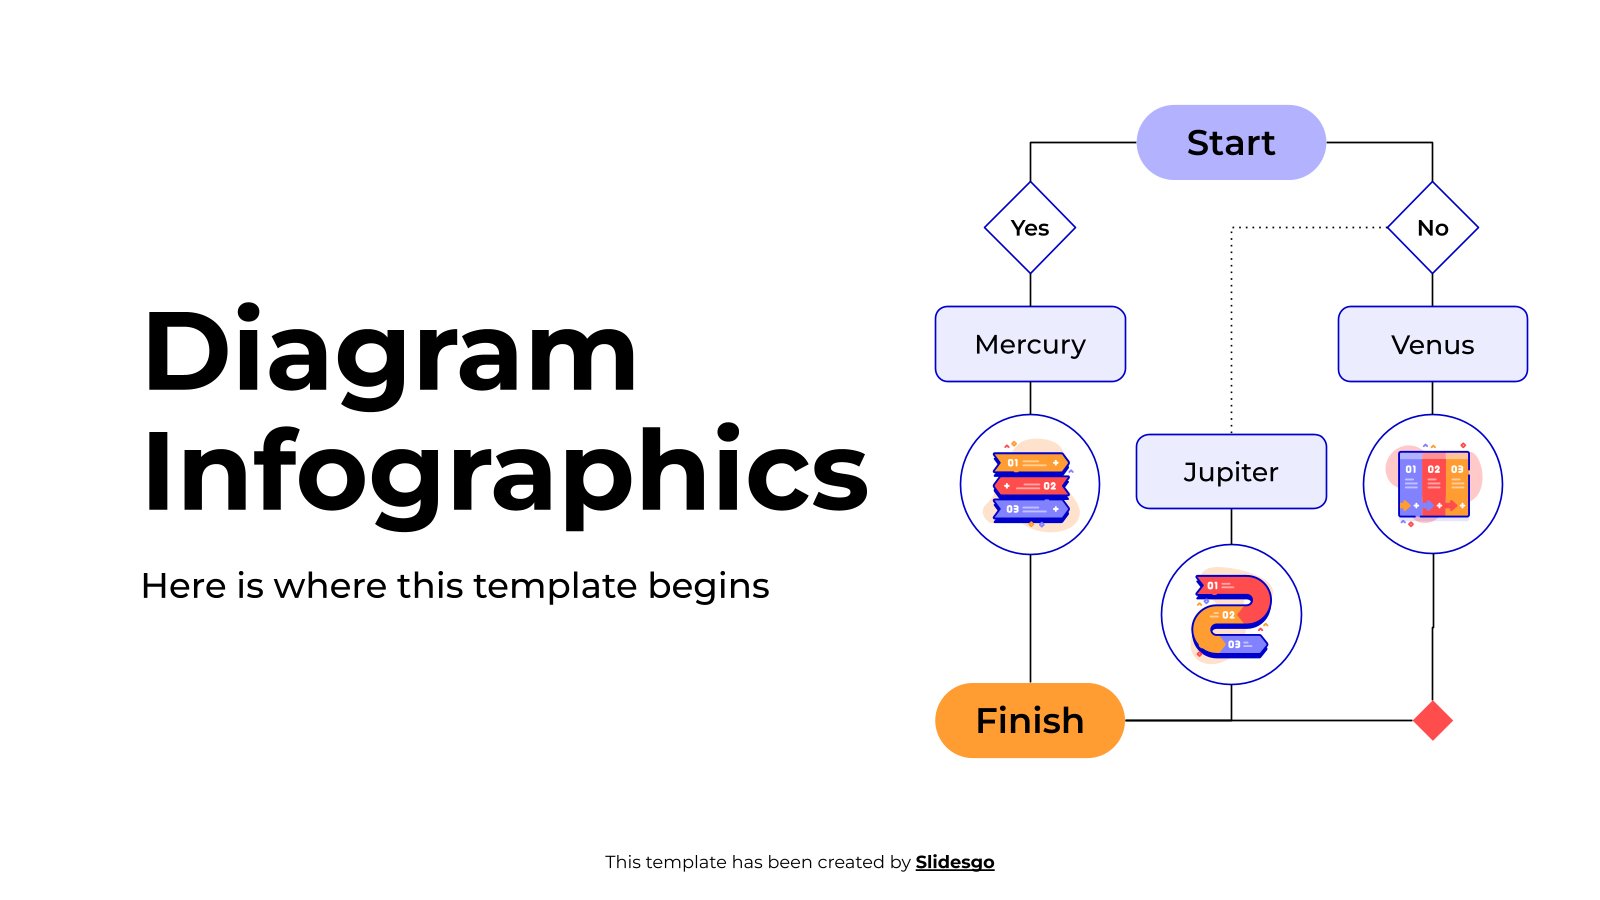
Radial Diagrams
Free template
Radial diagrams are great to compare quantitative variables. They appear as circles, some of them are concentric. They are colorful, and they also show flat, filled, colorful, linear styles, and sometimes you’ll see them as arrows. You’ll find up to 8 sections in each diagram.
Features of these infographics
- 100% editable and easy to modify
- 31 different infographics to boost your presentations
- Include icons and Flaticon’s extension for further customization
- Designed to be used in Google Slides, Canva, and Microsoft PowerPoint and Keynote
- 16:9 widescreen format suitable for all types of screens
- Include information about how to edit and customize your infographics
- Learn more in How to use this template?
Ads

Register for free and start downloading now
Register on our website to download 3 FREE templates every month, or GO Premium for unlimited downloads!
Related templates

/
Like
Download

/
Like
Download
/
Like
Download

/
Like
Download

/
Like
Download
.png)
/
Like
Download
/
Like
Download

/
Like
Download

/
Like
Download

/
Like
Download

/
Like
Download

/
Like
Download
/
Like
Download

/
Like
Download

/
Like
Download
Popular templates

/
Like
Download

/
Like
Download

/
Like
Download
Generate content with AI

/
Like
Download

/
Like
Download
Generate content with AI

/
Like
Download
Generate content with AI