Cycle Infographics Presentation templates
Things come and go, and sometimes they come and go again, and come and go again, in aeternum. That's how cycles work, and that's either the type or the theme of the editable infographics that we have here for your Google Slides and PowerPoint presentations. Customize any of them to your liking and then download another template. Customize it to your liking and then download another template again. And again. And again...


It seems that you like this template!

Register for free and start downloading now
Some things have a beginning, an ending and some steps in between, and then they start again, following the same steps endlessly. That's how cycles are, and there are many ways of representing them in a visual manner. Get inspired by this design and see if it fits your needs!...

Download the Construction Project Lifecycle Infographics template for PowerPoint or Google Slides to get the most out of infographics. Whether you want to organize your business budget in a table or schematically analyze your sales over the past year, this set of infographic resources will be of great help. Start...

Steps infographics are ideal if you want to depict the different stages of a given project. There are no fixed timelines or paths. This presentation includes circles, arrows, boxes, tables, triangles or even layers. They are very adaptable and suitable for any sort of subject matter.

Cycle diagrams are great if you want to depict a circular flow of a series of steps, stages or events that interact between each other repeatedly without a clear end. Use them when talking about company processes, in marketing, health or for educational purposes. Of course, the different sections (up...

Download the Newsletter with Cycle Diagrams presentation for PowerPoint or Google Slides. Attention all marketers! Are you looking for a way to make your newsletters more creative and eye-catching for your target audience? This amazing template is perfect for creating the perfect newsletter that will capture your audience's attention from...
The following set of infographics has been designed to represent the making of business processes. As such, most of the designs involve different steps or phases, each one with different colors for maximum clarity. Some slides incorporate timelines, others make use of cycle diagrams, others look like tables... There's a...

Download the Water Cycle Infographics template for PowerPoint or Google Slides and discover the power of infographics. An infographic resource gives you the ability to showcase your content in a more visual way, which will make it easier for your audience to understand your topic. Slidesgo infographics like this set...

Download the Cycle Infographics template for PowerPoint or Google Slides and discover the power of infographics. An infographic resource gives you the ability to showcase your content in a more visual way, which will make it easier for your audience to understand your topic. Slidesgo infographics like this set here...

Download the "Cycle Diagrams Theme for a Company Profile" presentation for PowerPoint or Google Slides. Presenting a comprehensive company profile can be a game-changer for your business. A well-crafted profile connects with potential clients and vendors on another level, giving them a deep understanding of your organization. This company profile...
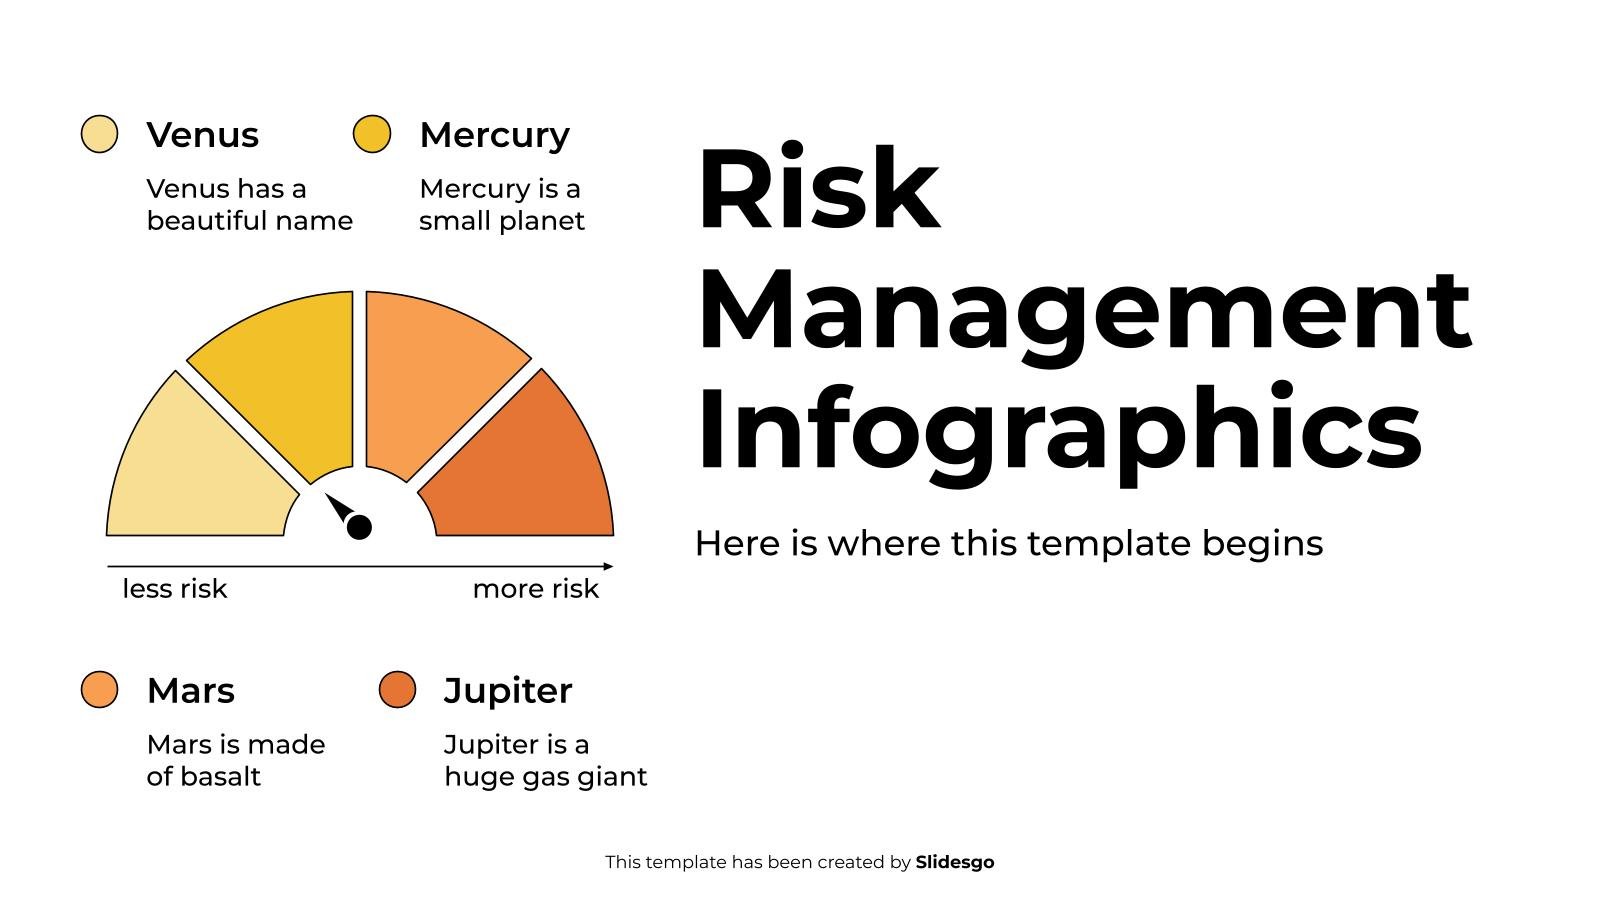
Download the Risk Management Infographics template for PowerPoint or Google Slides to get the most out of infographics. Whether you want to organize your business budget in a table or schematically analyze your sales over the past year, this set of infographic resources will be of great help. Start using...

Do you have a presentation that includes a slide to specifically talk about the methodology? Use these infographics to power up the visuals of your deck and help the audience visualize the data. Roadmaps, timelines, processes, steps; the choice is yours! We’ve also included some linear icons that could come...

Download the "Cycle Diagrams Theme for a Case Report" presentation for PowerPoint or Google Slides. A clinical case is more than just a set of symptoms and a diagnosis. It is a unique story of a patient, their experiences, and their journey towards healing. Each case is an opportunity for...

The oxygen cycle is one of the most fascinating natural cycles found in the environment. Oxygen is a key component for life on Earth and its presence in our atmosphere is enabled by this remarkable cycle. This cycle consists of multiple stages where atmospheric gases, water, and soil components interact...

Representing information in a circular way can be a little bit difficult! The different points you want to show are somewhat connected to each other and they don’t follow any particular order, or rather they present a process that repeats. If you need to represent the principal components of a...
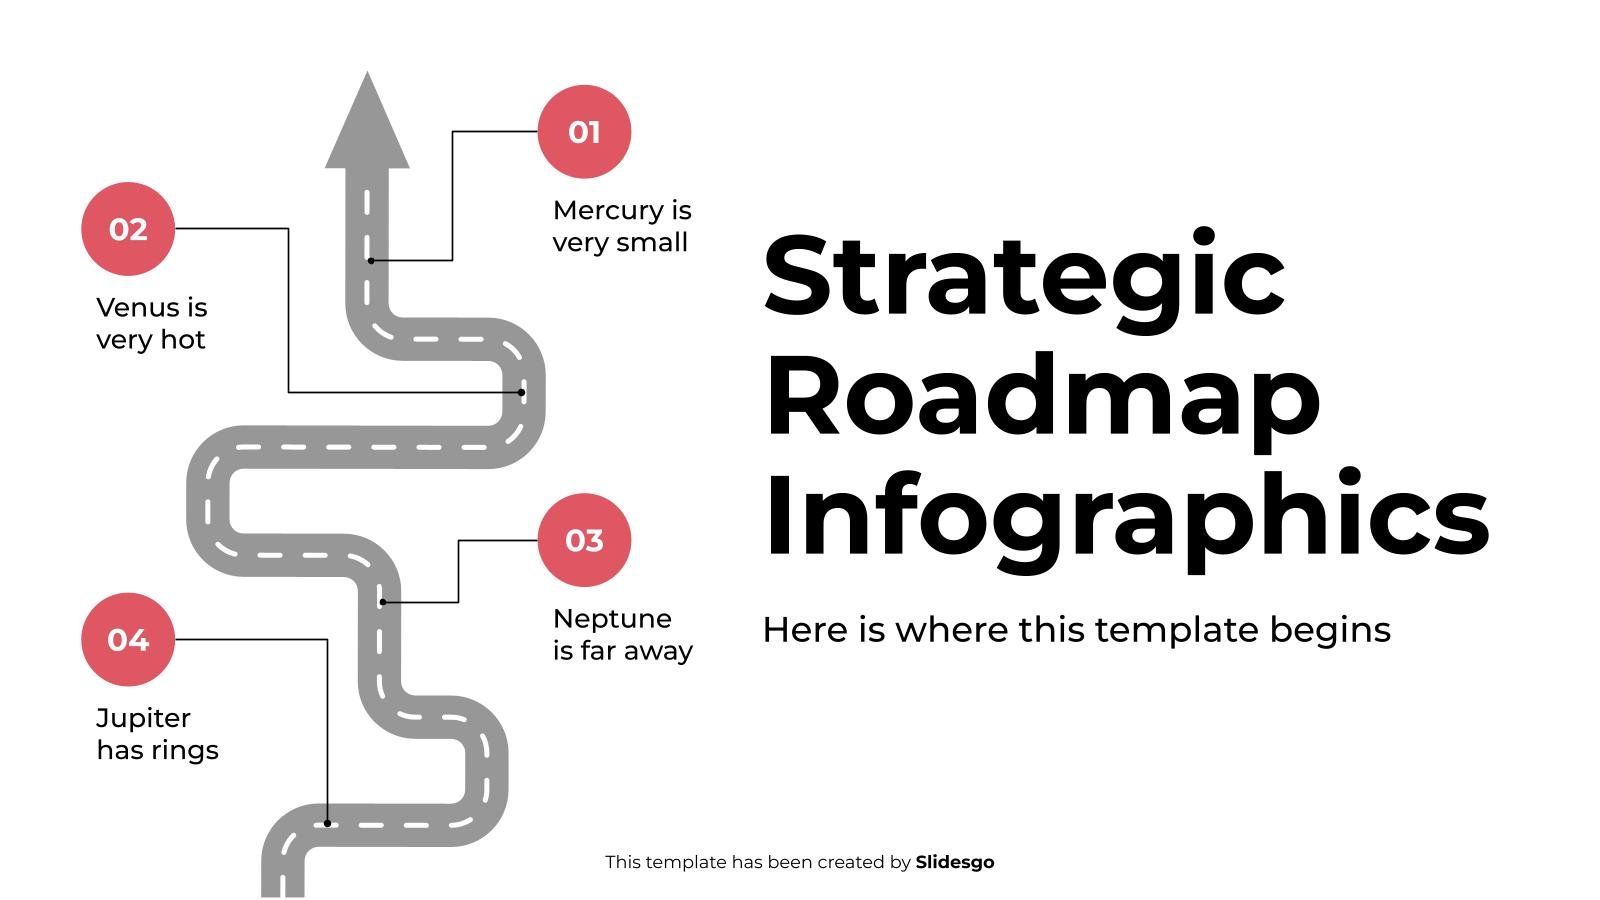
Download the Strategic Roadmap Infographics template for PowerPoint or Google Slides to get the most out of infographics. Whether you want to organize your business budget in a table or schematically analyze your sales over the past year, this set of infographic resources will be of great help. Start using...
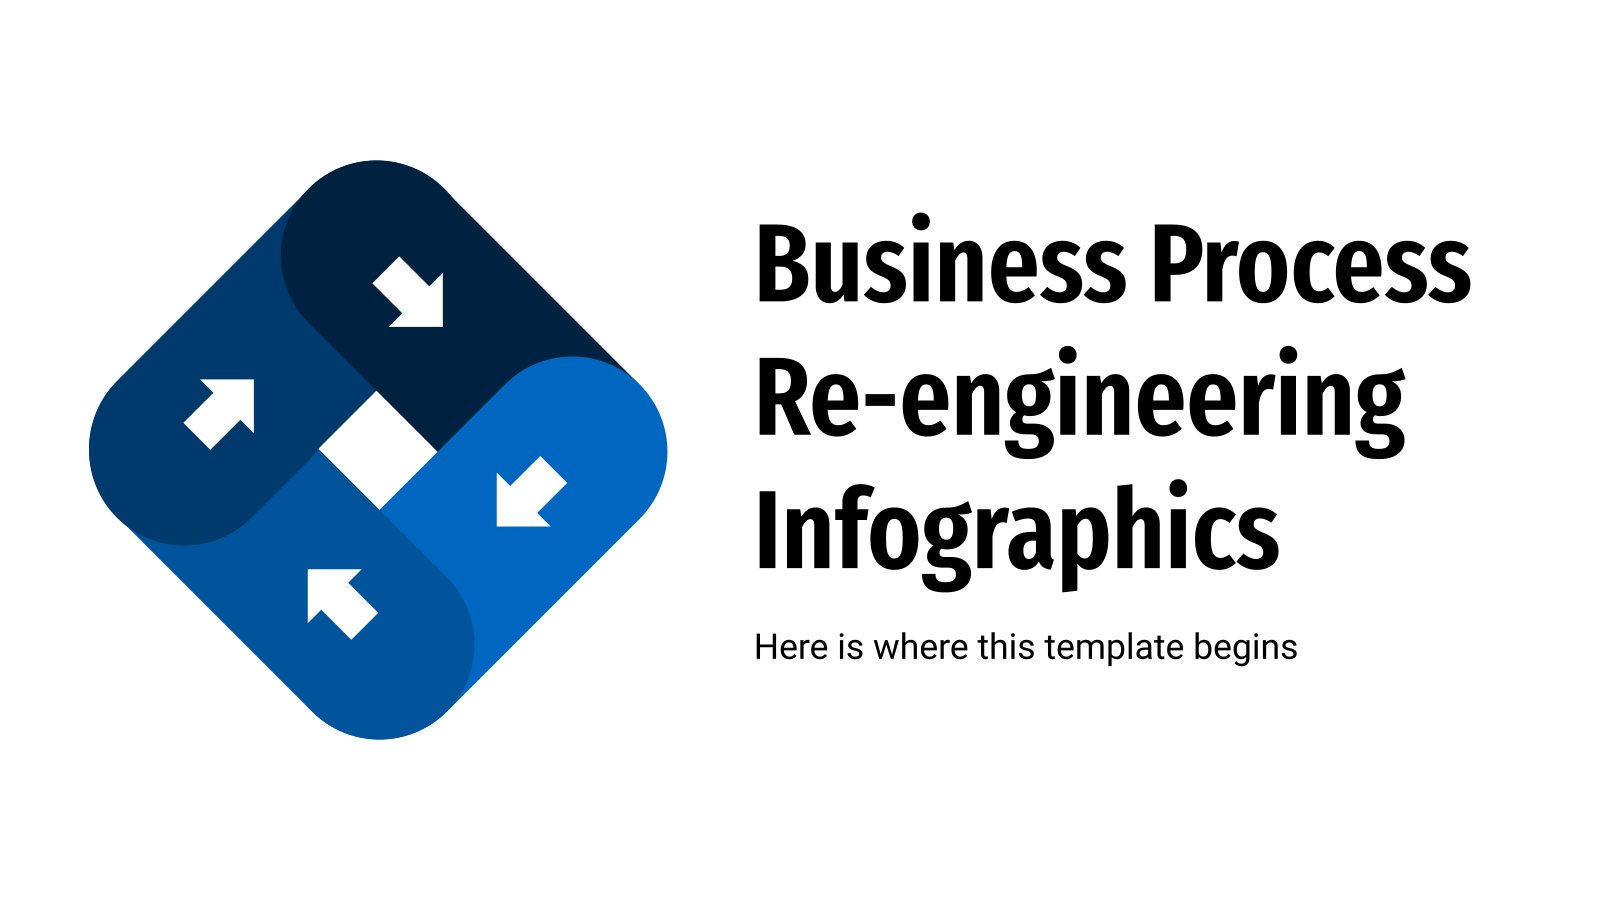
Business process re-engineering is a strategy in business management where workflows are analyzed and, if possible implemented to improve the performance and the services offered by a company. "Workflows", huh? That means processes, steps, phases... Exactly the kind of infographics that you'll find in this template! All of them incorporate...

Download the Cycle Infographics template for PowerPoint or Google Slides and discover the power of infographics. An infographic resource gives you the ability to showcase your content in a more visual way, which will make it easier for your audience to understand your topic. Slidesgo infographics like this set here...

Infographics can turn a boring presentation into something the audience remembers. These designs are optimized for business plans, so you can represent sequences, processes, timelines and the steps to follow. Use them in your corporate presentations and edit their colors to better suit your needs.