Cycle Infographics Presentation templates - Page 2
Things come and go, and sometimes they come and go again, and come and go again, in aeternum. That's how cycles work, and that's either the type or the theme of the editable infographics that we have here for your Google Slides and PowerPoint presentations. Customize any of them to your liking and then download another template. Customize it to your liking and then download another template again. And again. And again...


It seems that you like this template!

Register for free and start downloading now
Download the "Cycle Diagrams Theme for a Pitch Deck" presentation for PowerPoint or Google Slides. Whether you're an entrepreneur looking for funding or a sales professional trying to close a deal, a great pitch deck can be the difference-maker that sets you apart from the competition. Let your talent shine...

Download the "Medical Cycle Diagrams Theme" presentation for PowerPoint or Google Slides. Healthcare goes beyond curing patients and combating illnesses. Raising awareness about diseases, informing people about prevention methods, discussing some good practices, or even talking about a balanced diet—there are many topics related to medicine that you could be...

Download the "Medical Cycle Diagrams Theme" presentation for PowerPoint or Google Slides. Healthcare goes beyond curing patients and combating illnesses. Raising awareness about diseases, informing people about prevention methods, discussing some good practices, or even talking about a balanced diet—there are many topics related to medicine that you could be...

Download the "Medical Disease Explained With Cycle Diagrams" presentation for PowerPoint or Google Slides. Taking care of yourself and of those around you is key! By learning about various illnesses and how they are spread, people can get a better understanding of them and make informed decisions about eating, exercise,...
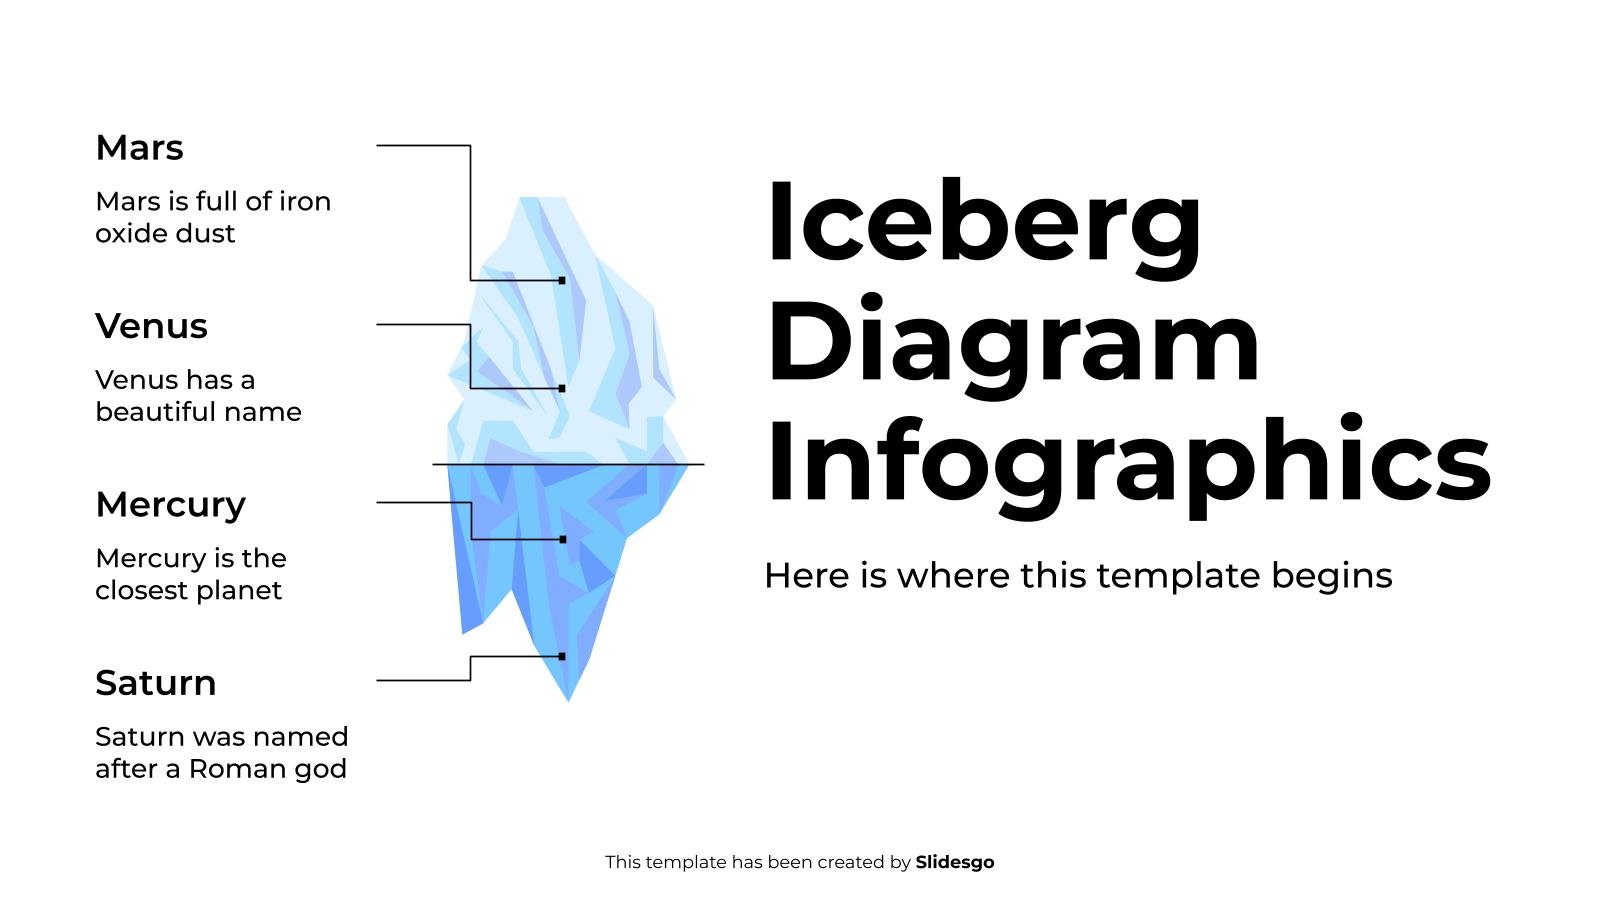
Download the Iceberg Diagram Infographics template for PowerPoint or Google Slides to get the most out of infographics. Whether you want to organize your business budget in a table or schematically analyze your sales over the past year, this set of infographic resources will be of great help. Start using...

Download the "Cycle Diagrams Theme for Business" presentation for PowerPoint or Google Slides. The world of business encompasses a lot of things! From reports to customer profiles, from brainstorming sessions to sales—there's always something to do or something to analyze. This customizable design, available for Google Slides and PowerPoint, is...

Download the Cycle Diagrams Theme for Education presentation for PowerPoint or Google Slides. The education sector constantly demands dynamic and effective ways to present information. This template is created with that very purpose in mind. Offering the best resources, it allows educators or students to efficiently manage their presentations and...

Download the Steps Infographics template for PowerPoint or Google Slides to get the most out of infographics. Whether you want to organize your business budget in a table or schematically analyze your sales over the past year, this set of infographic resources will be of great help. Start using infographics...

Download the Cycle Diagrams Theme for Education presentation for PowerPoint or Google Slides. The education sector constantly demands dynamic and effective ways to present information. This template is created with that very purpose in mind. Offering the best resources, it allows educators or students to efficiently manage their presentations and...

Download the "Marketing Theme with Cycle Diagrams" presentation for PowerPoint or Google Slides and take your marketing projects to the next level. This template is the perfect ally for your advertising strategies, launch campaigns or report presentations. Customize your content with ease, highlight your ideas and captivate your audience with...

Download the "Cycle Diagrams Theme for Business" presentation for PowerPoint or Google Slides. The world of business encompasses a lot of things! From reports to customer profiles, from brainstorming sessions to sales—there's always something to do or something to analyze. This customizable design, available for Google Slides and PowerPoint, is...

Download the Circular Infographics template for PowerPoint or Google Slides and discover the power of infographics. An infographic resource gives you the ability to showcase your content in a more visual way, which will make it easier for your audience to understand your topic. Slidesgo infographics like this set here...

Download the College Lessons with Cycle Diagrams presentation for PowerPoint or Google Slides. As university curricula increasingly incorporate digital tools and platforms, this template has been designed to integrate with presentation software, online learning management systems, or referencing software, enhancing the overall efficiency and effectiveness of student work. Edit this...

Let’s say you need to talk about five steps of your project or list exactly five elements in order of importance. Good, then use these infographics. They’re layered out in a sequence so you can describe a process over time, but there’s also some pyramids to sort things from the...

Download the Cycle Diagrams Theme for Education presentation for PowerPoint or Google Slides. The education sector constantly demands dynamic and effective ways to present information. This template is created with that very purpose in mind. Offering the best resources, it allows educators or students to efficiently manage their presentations and...

Make your sales strategy understandable and impress everyone with this business template. Use the different infographics to explain the whole process from start to finish. Show all the different elements of the sales procedure and how they interact with each other and indicate the goals and deadlines of your plan.

Download the "Cycle Diagrams Theme for a Business Meeting" presentation for PowerPoint or Google Slides. Gone are the days of dreary, unproductive meetings. Check out this sophisticated solution that offers you an innovative approach to planning and implementing meetings! Detailed yet simplified, this template ensures everyone is on the same...

Download the Cycle Diagrams Infographics template for PowerPoint or Google Slides to get the most out of infographics. Whether you want to organize your business budget in a table or schematically analyze your sales over the past year, this set of infographic resources will be of great help. Start using...