Chart Infographics Presentation templates - Page 3
Charts come in many different forms: bar, pie, pyramid, cycle, you name it. Browse our infographics for Google Slides and PowerPoint and use the type that you need for your slides!

It seems that you like this template!

Register for free and start downloading now
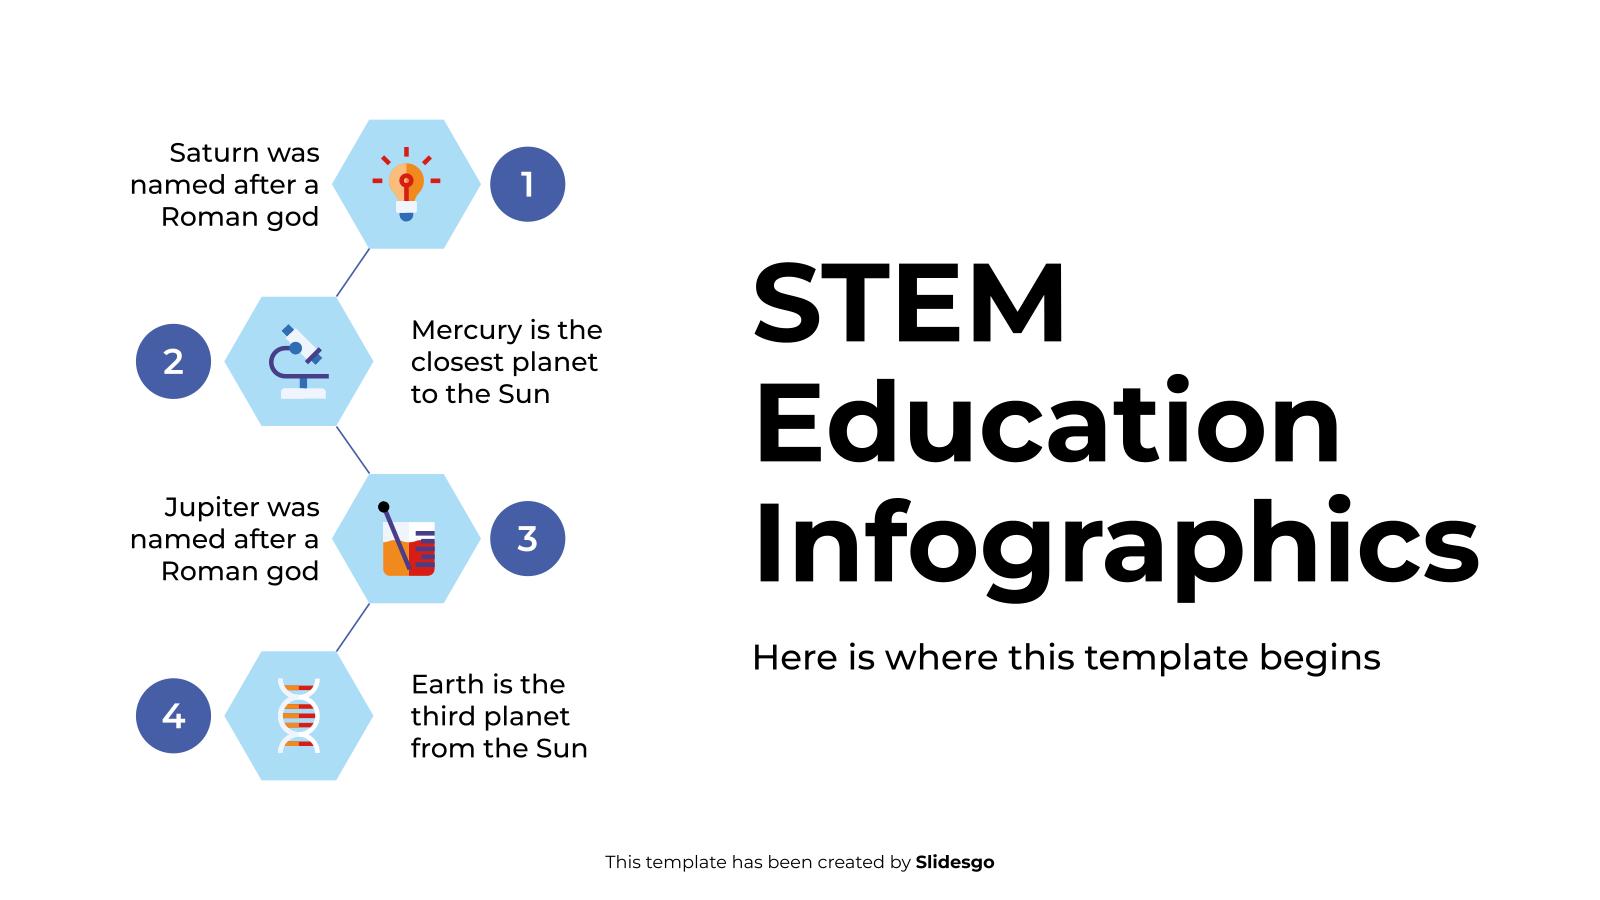
Download the STEM Education Infographics template for PowerPoint or Google Slides and discover this set of editable infographics for education presentations. These resources, from graphs to tables, can be combined with other presentations or used independently. The most important thing is what you will achieve: transmit information in an orderly...

Download the Architect Infographics template for PowerPoint or Google Slides to get the most out of infographics. Whether you want to organize your business budget in a table or schematically analyze your sales over the past year, this set of infographic resources will be of great help. Start using infographics...

It's obvious that any business wants to reach to as many customers as possible, and maintain a nice commercial relationship with them. "Leads" and "nurturing" are two concepts that can go together too, but how to define them? Use these infographics and illustrate your audience with all kinds of diagrams,...

Download the Annual Report Infographics template for PowerPoint or Google Slides to get the most out of infographics. Whether you want to organize your business budget in a table or schematically analyze your sales over the past year, this set of infographic resources will be of great help. Start using...

Download the Most Famous Murder Cases - Thesis Defense Infographics template for PowerPoint or Google Slides and discover the power of infographics. An infographic resource gives you the ability to showcase your content in a more visual way, which will make it easier for your audience to understand your topic....
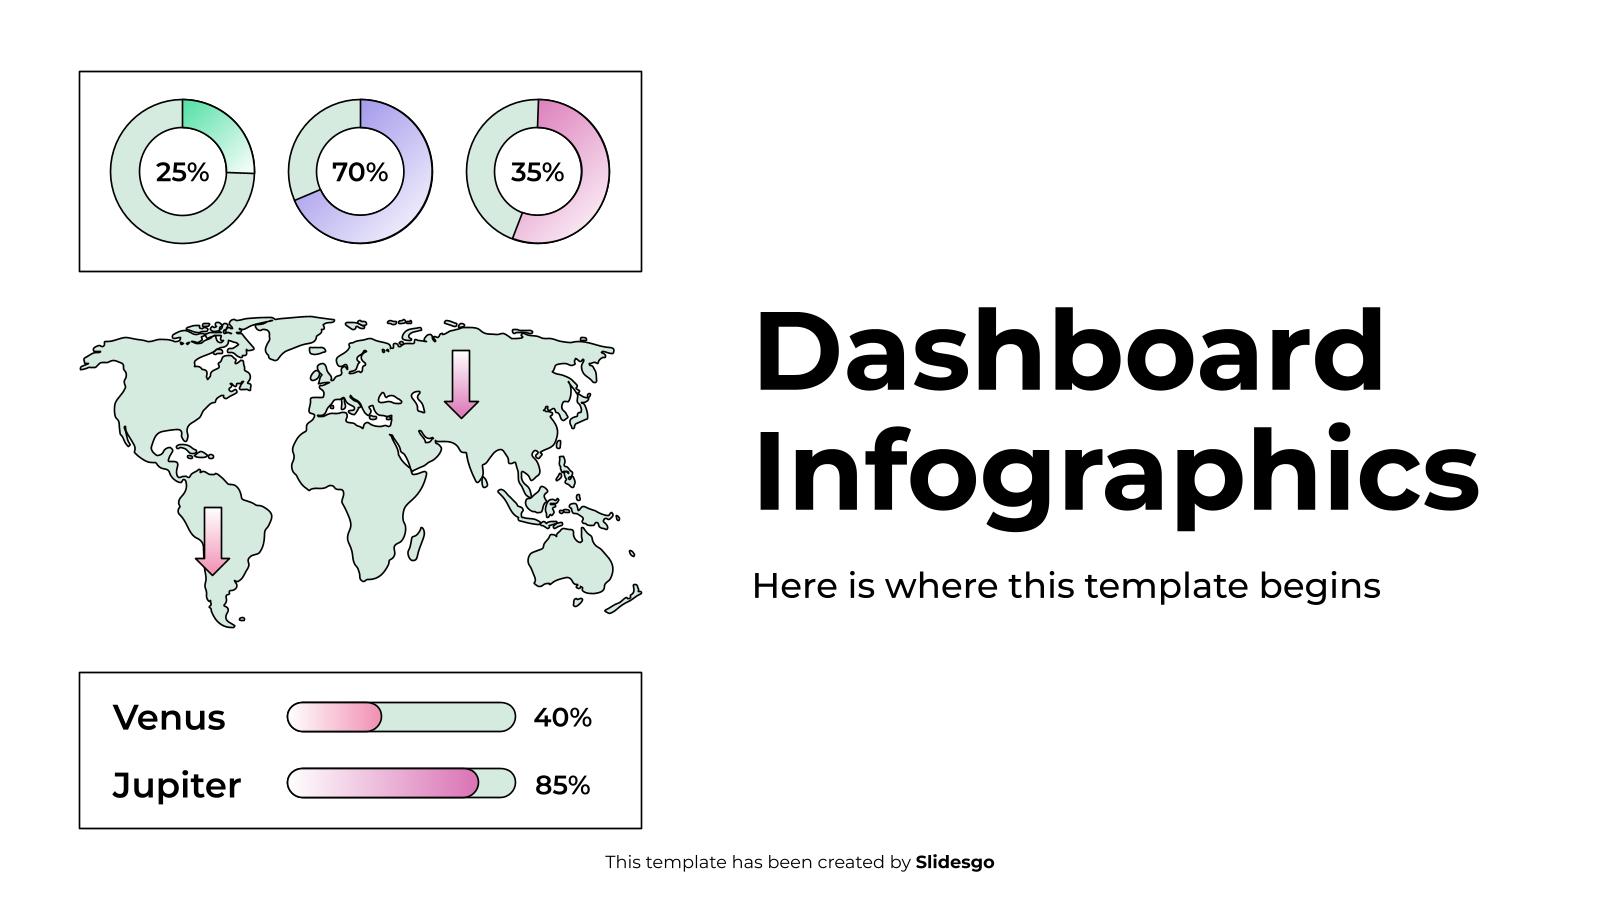
Download the Dashboard Infographics template for PowerPoint or Google Slides to get the most out of infographics. Whether you want to organize your business budget in a table or schematically analyze your sales over the past year, this set of infographic resources will be of great help. Start using infographics...
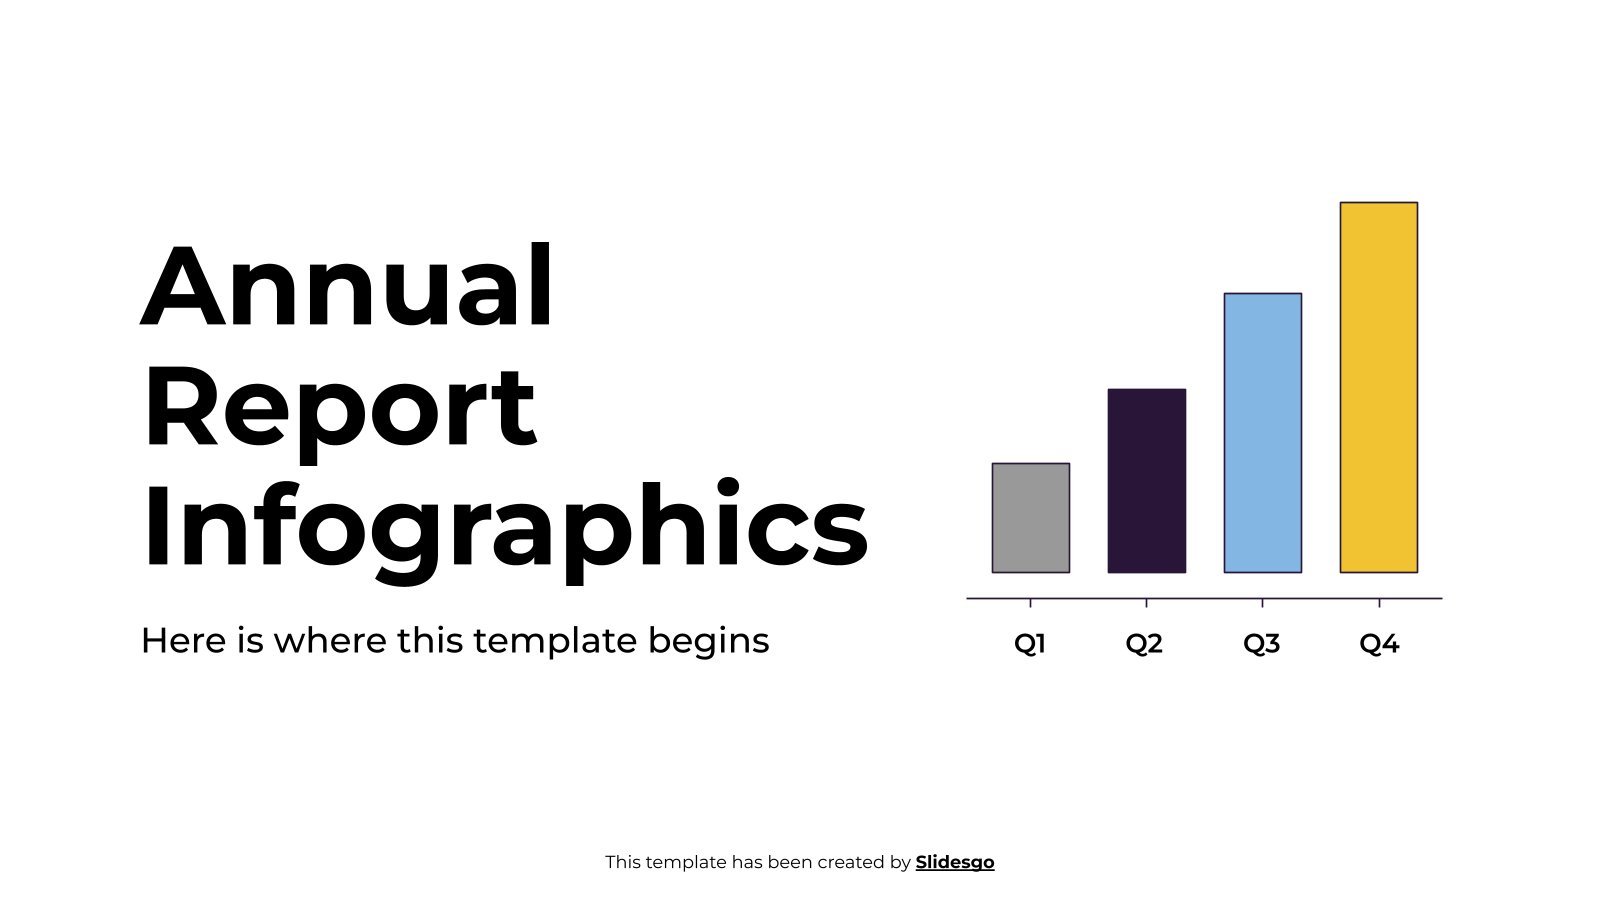
Download the "Annual Report Infographics" template for PowerPoint or Google Slides and discover the power of infographics. An infographic resource gives you the ability to showcase your content in a more visual way, which will make it easier for your audience to understand your topic. Slidesgo infographics like this set...

Slidesgo is back with a template full of line charts, one of the most common (and useful!) types of graphs. The designs play around with the representation of data, usually numeric, by the use of lines. Do you want a flat-styled one? We have it. Maybe one that looks 3D?...

Download the "Business Infographics" template for PowerPoint or Google Slides to get the most out of infographics. Whether you want to organize your business budget in a table or schematically analyze your sales over the past year, this set of infographic resources will be of great help. Start using infographics...

Download the Comparison Infographics template for PowerPoint or Google Slides to get the most out of infographics. Whether you want to organize your business budget in a table or schematically analyze your sales over the past year, this set of infographic resources will be of great help. Start using infographics...

Download the Risk Management Infographics template for PowerPoint or Google Slides to get the most out of infographics. Whether you want to organize your business budget in a table or schematically analyze your sales over the past year, this set of infographic resources will be of great help. Start using...

Everyone knows about pie charts, but have you ever heard of a little variant known as waffle chart? It uses little colored squares to show the area proportional to the percentage that is represented. Now it's your time to use them in your own presentations thanks to this template! Our...

Download the Budget Infographics template for PowerPoint or Google Slides and discover this set of editable infographics for education presentations. These resources, from graphs to tables, can be combined with other presentations or used independently. The most important thing is what you will achieve: transmit information in an orderly and...

All these charts serve one purpose: help your audience visualize statistics about the population. Whether you've conducted a market research, or you want to show some opinion polls or voting intention, you'll be able to do so with our colorful designs. Choose your preferred style among flat, fill or linear,...

Download the "Controversial Medical Substances Infographics" template for PowerPoint or Google Slides. When it's time to make a medical-themed presentation, a concern arises. "Will I manage to convey a complicated medical concept?" Thanks to this template with infographic resources for medical presentations, that concern will cease to exist. Use your...
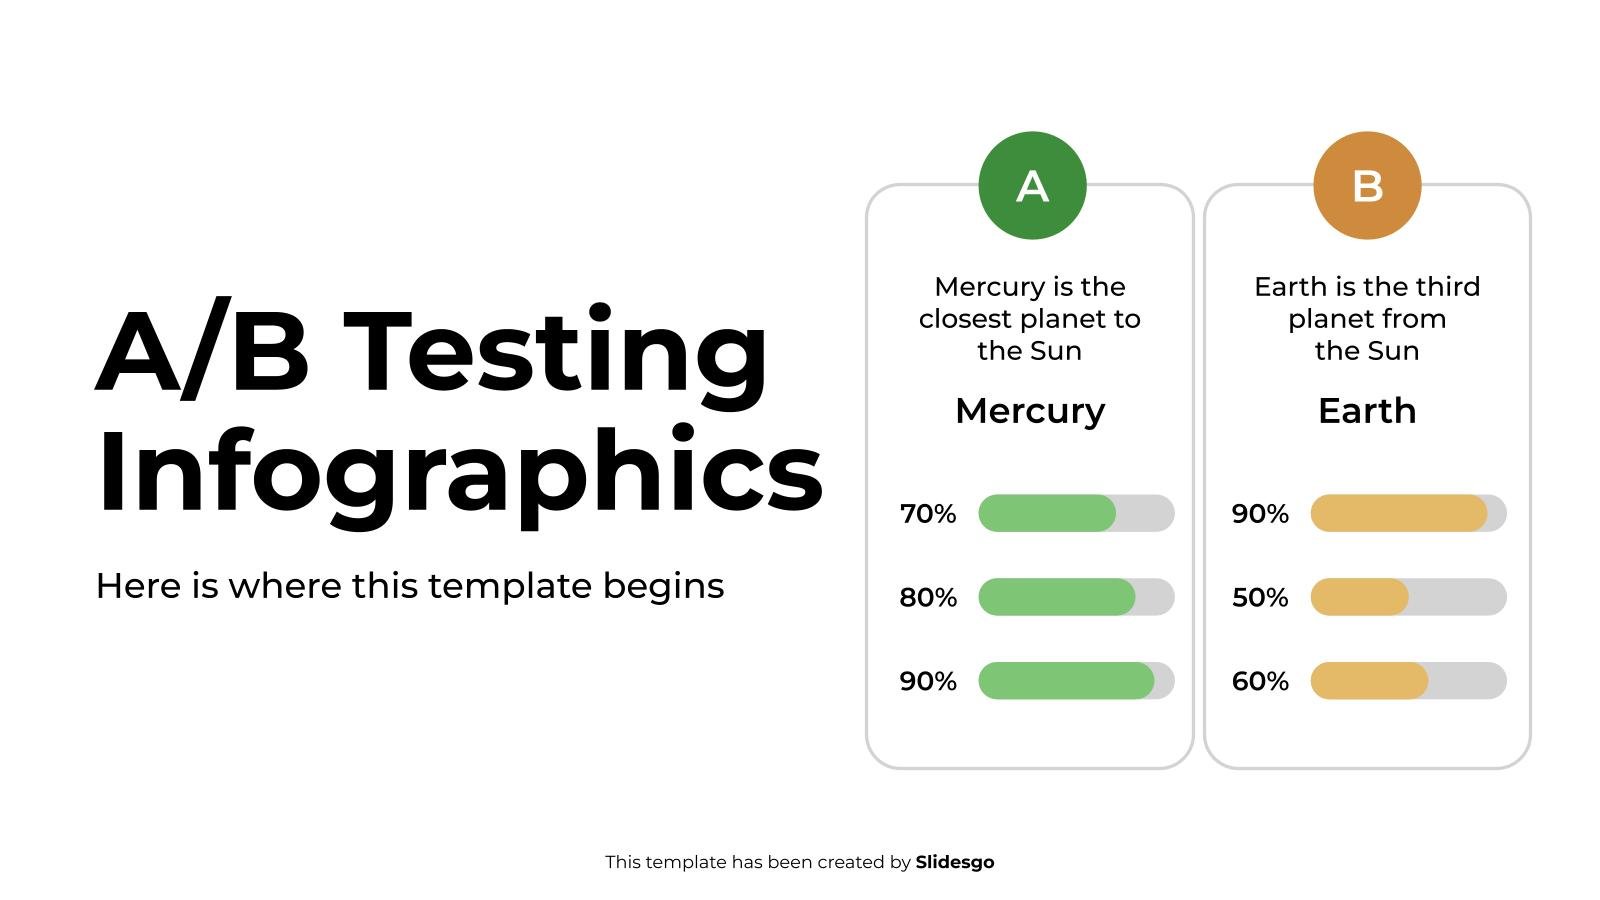
Download the A/B Testing Infographics template for PowerPoint or Google Slides to get the most out of infographics. Whether you want to organize your business budget in a table or schematically analyze your sales over the past year, this set of infographic resources will be of great help. Start using...
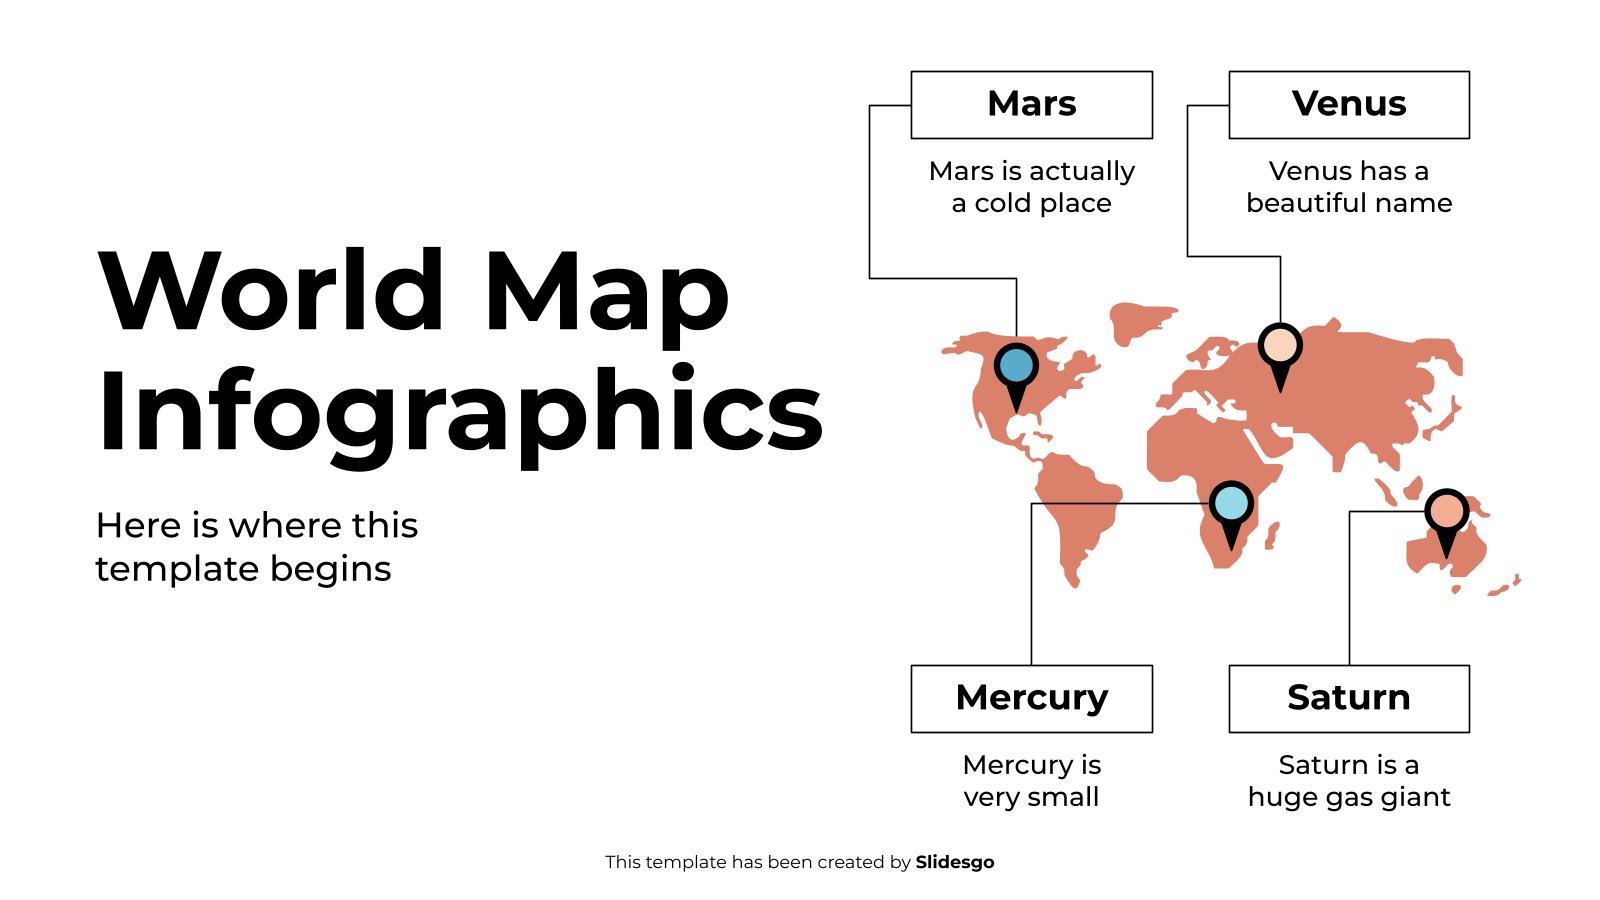
Download the World Map Infographics template for PowerPoint or Google Slides to get the most out of infographics. Whether you want to organize your business budget in a table or schematically analyze your sales over the past year, this set of infographic resources will be of great help. Start using...
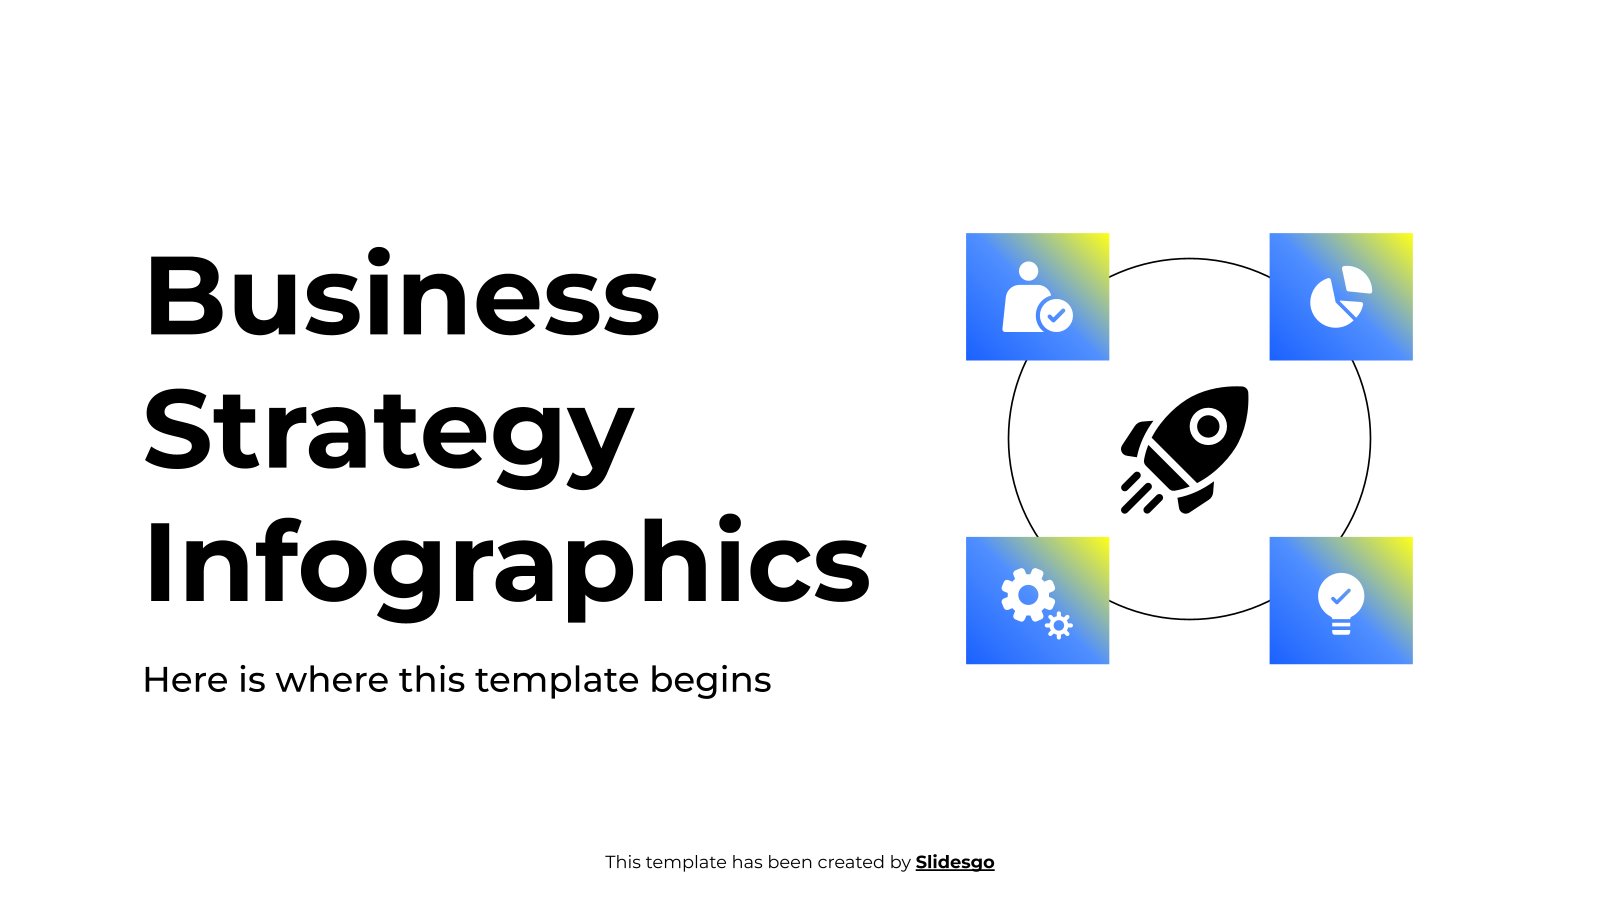
Download the "Professional Business Strategy Infographic" template for PowerPoint or Google Slides to get the most out of infographics. Whether you want to organize your business budget in a table or schematically analyze your sales over the past year, this set of infographic resources will be of great help. Start...