Chart Infographics Presentation templates - Page 4
Charts come in many different forms: bar, pie, pyramid, cycle, you name it. Browse our infographics for Google Slides and PowerPoint and use the type that you need for your slides!


It seems that you like this template!

Register for free and start downloading now
Download the "Brain Infographics" template for PowerPoint or Google Slides. When it's time to make a medical-themed presentation, a concern arises. "Will I manage to convey a complicated medical concept?" Thanks to this template with infographic resources for medical presentations, that concern will cease to exist. Use your favorite infographics...
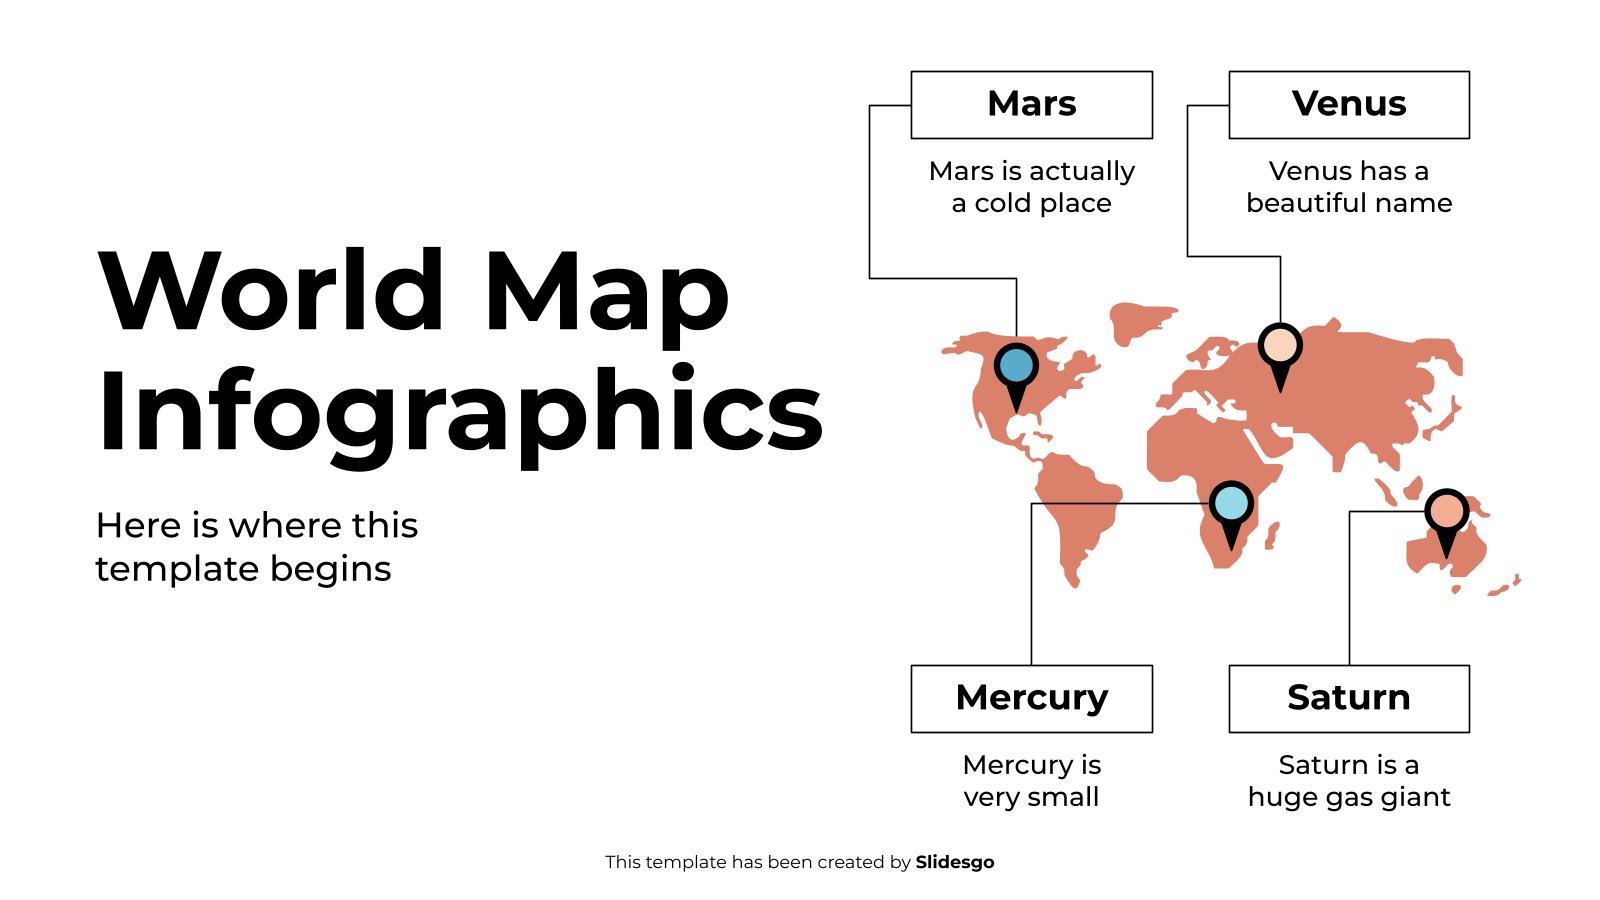
Download the World Map Infographics template for PowerPoint or Google Slides to get the most out of infographics. Whether you want to organize your business budget in a table or schematically analyze your sales over the past year, this set of infographic resources will be of great help. Start using...

Download the "How To Make An Infographic" template for PowerPoint or Google Slides and discover the power of infographics. An infographic resource gives you the ability to showcase your content in a more visual way, which will make it easier for your audience to understand your topic. Slidesgo infographics like...

Download the Gardening Infographics template for PowerPoint or Google Slides and discover the power of infographics. An infographic resource gives you the ability to showcase your content in a more visual way, which will make it easier for your audience to understand your topic. Slidesgo infographics like this set here...

The VALS framework is used in marketing to segment customers based on their values, attitudes and lifestyles. It is a qualitative methodology used to understand how consumers think. This way you can create more effective messages focused on their interests. If you want to apply this technique to your project,...
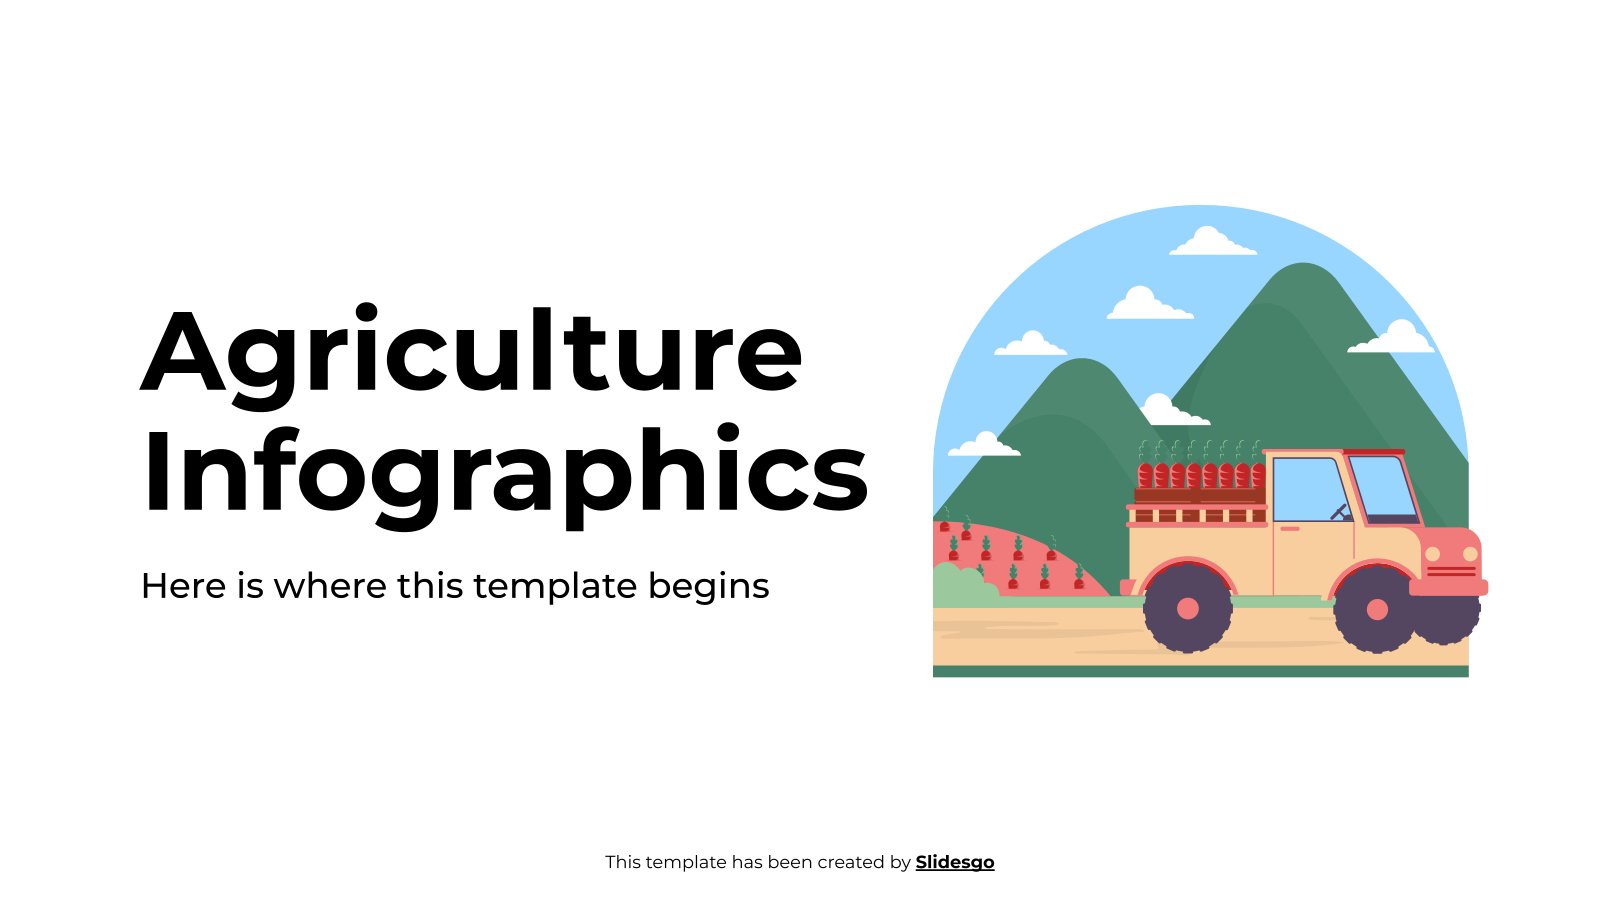
Download the "Agriculture Infographics" template for PowerPoint or Google Slides and discover the power of infographics. An infographic resource gives you the ability to showcase your content in a more visual way, which will make it easier for your audience to understand your topic. Slidesgo infographics like this set here...

Download the Employee Benefits Infographics template for PowerPoint or Google Slides and discover the power of infographics. An infographic resource gives you the ability to showcase your content in a more visual way, which will make it easier for your audience to understand your topic. Slidesgo infographics like this set...

Are you giving a speech on science, perhaps showing some statistics or the results of an experiment? Turn the conference room into a laboratory with these infographics. Represent your data visually by inserting these lab beaker charts into your slides. We have designed them in various styles, ranging from flat...

Download the Business Infographics template for PowerPoint or Google Slides to get the most out of infographics. Whether you want to organize your business budget in a table or schematically analyze your sales over the past year, this set of infographic resources will be of great help. Start using infographics...

Transform your data into a visual masterpiece with the power of chart infographics! Forget about dull spreadsheets and create something truly unique and compelling. With templates like this one, the sky's the limit when it comes to creativity and customization. And the best part? You can adapt them to your...

We told you: combining a minimalist design with abstract shapes and a palette composed of pastel colors gives as a result... pure success! When we gave you such a template, who would've thought that we'd be creating its complementary infographics after some time? Well, that moment is now, and it...
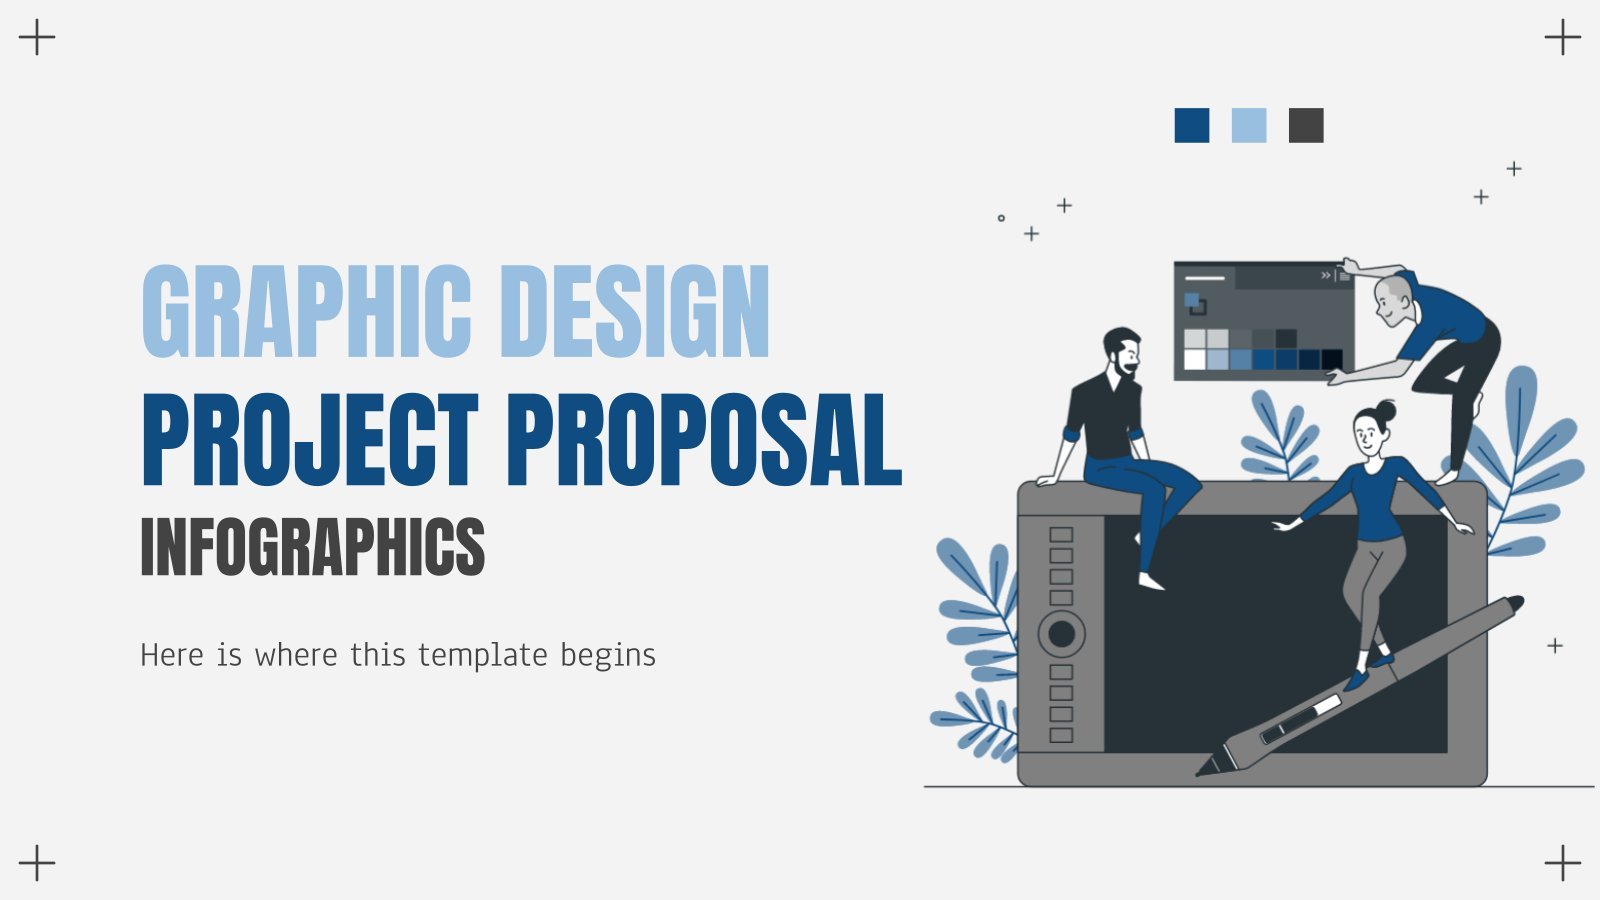
Download the Graphic Design Project Proposal Infographics template for PowerPoint or Google Slides and discover the power of infographics. An infographic resource gives you the ability to showcase your content in a more visual way, which will make it easier for your audience to understand your topic. Slidesgo infographics like...

As Aristotle said: "man is by nature a political animal". Politics is an essential part of our society since it is the system by which we govern ourselves to organize life in that society. Thus, talking about politics is a recurring theme and it is possible that you make presentations...

Download the Illustration Infographics template for PowerPoint or Google Slides and discover the power of infographics. An infographic resource gives you the ability to showcase your content in a more visual way, which will make it easier for your audience to understand your topic. Slidesgo infographics like this set here...

Download the Budget Infographics template for PowerPoint or Google Slides and discover the power of infographics. An infographic resource gives you the ability to showcase your content in a more visual way, which will make it easier for your audience to understand your topic. Slidesgo infographics like this set here...

Did you know that waterfall charts are just tailor-made for those times when you need to represent a succession of positive or negative results and their cumulative effect? Edit the design that you like the most—some of them have rounded edges—choose the amount of columns or rows and let your...

Do you have lots of ideas, but don't know how to organize them? Do you feel that chaos is taking over you? Don't despair, our friend! We bring you a resource that will save you from that chaos. This template with more than 20 different classification charts to give order...
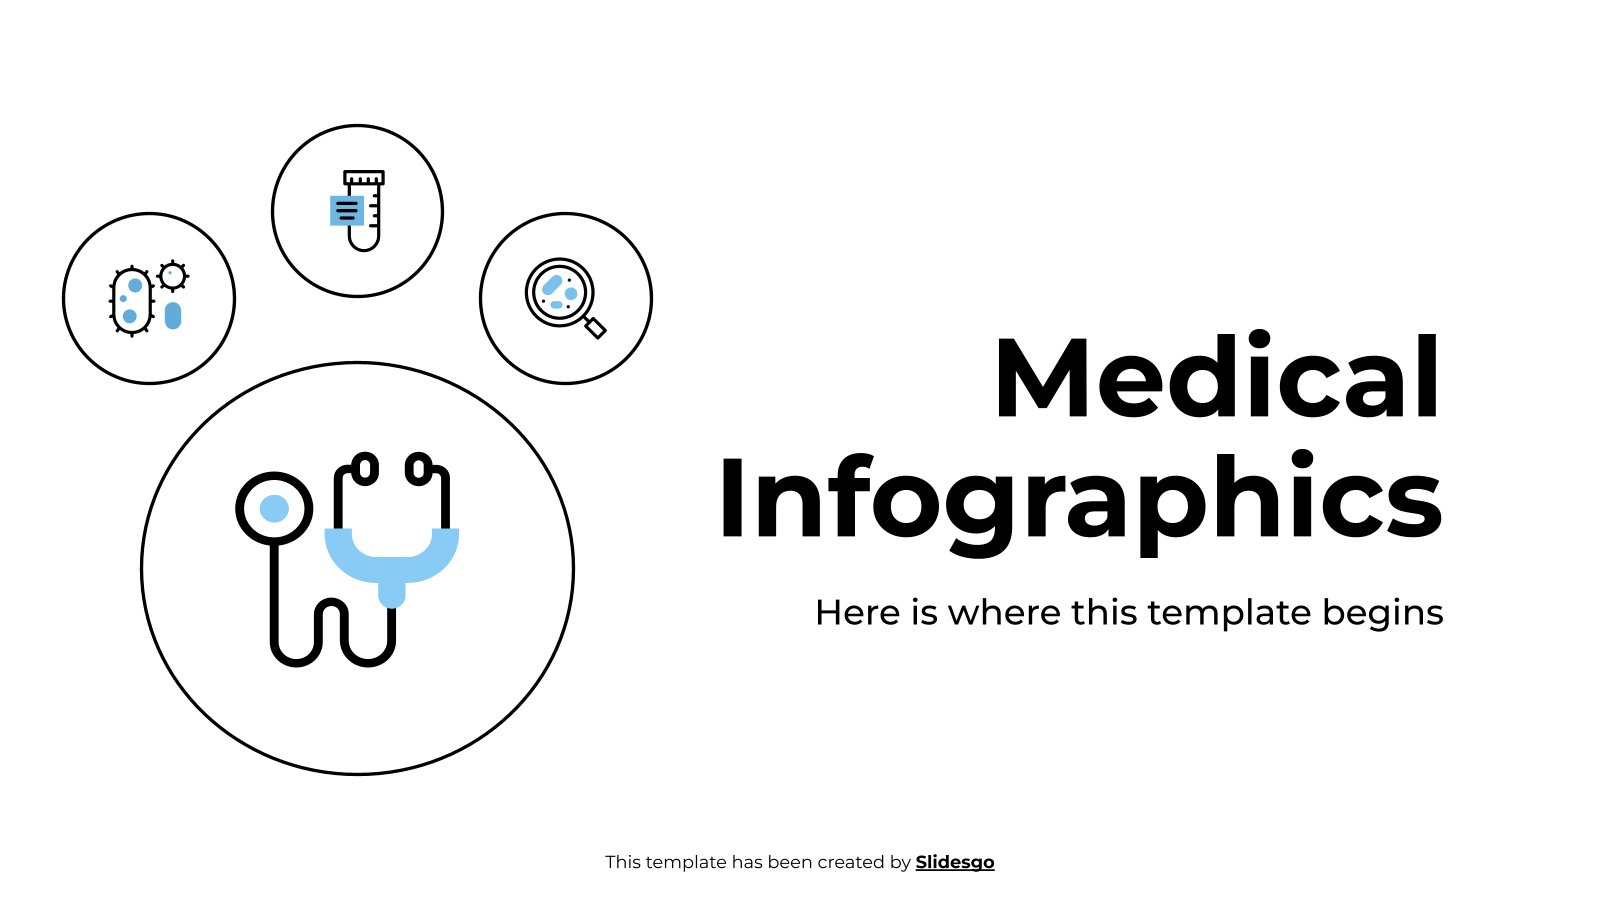
Download the "Medical Infographics" template for PowerPoint or Google Slides and discover the power of infographics. An infographic resource gives you the ability to showcase your content in a more visual way, which will make it easier for your audience to understand your topic. Slidesgo infographics like this set here...