Chart Infographics Presentation templates - Page 2
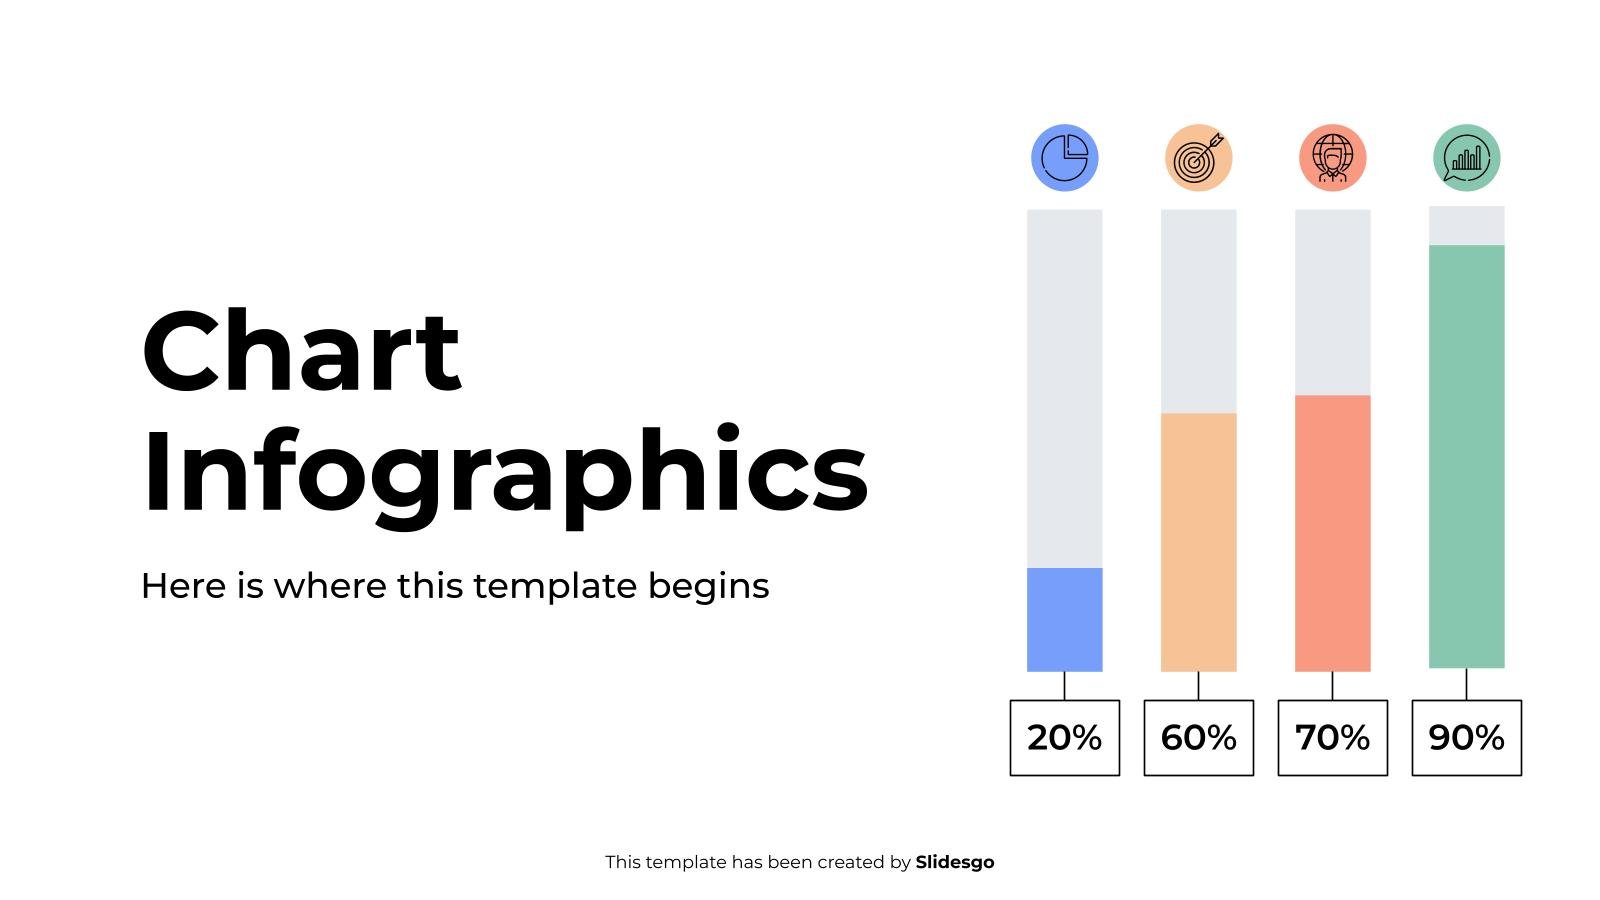
Charts come in many different forms: bar, pie, pyramid, cycle, you name it. Browse our infographics for Google Slides and PowerPoint and use the type that you need for your slides!


It seems that you like this template!

Register for free and start downloading now
Download the Stock Market Infographics template for PowerPoint or Google Slides to get the most out of infographics. Whether you want to organize your business budget in a table or schematically analyze your sales over the past year, this set of infographic resources will be of great help. Start using...

Download the Chart Infographics template for PowerPoint or Google Slides to get the most out of infographics. Whether you want to organize your business budget in a table or schematically analyze your sales over the past year, this set of infographic resources will be of great help. Start using infographics...

Download the Types of Business Structures Infographics template for PowerPoint or Google Slides to get the most out of infographics. Whether you want to organize your business budget in a table or schematically analyze your sales over the past year, this set of infographic resources will be of great help....

Download the AI Tech Infographics template for PowerPoint or Google Slides to get the most out of infographics. Whether you want to organize your business budget in a table or schematically analyze your sales over the past year, this set of infographic resources will be of great help. Start using...
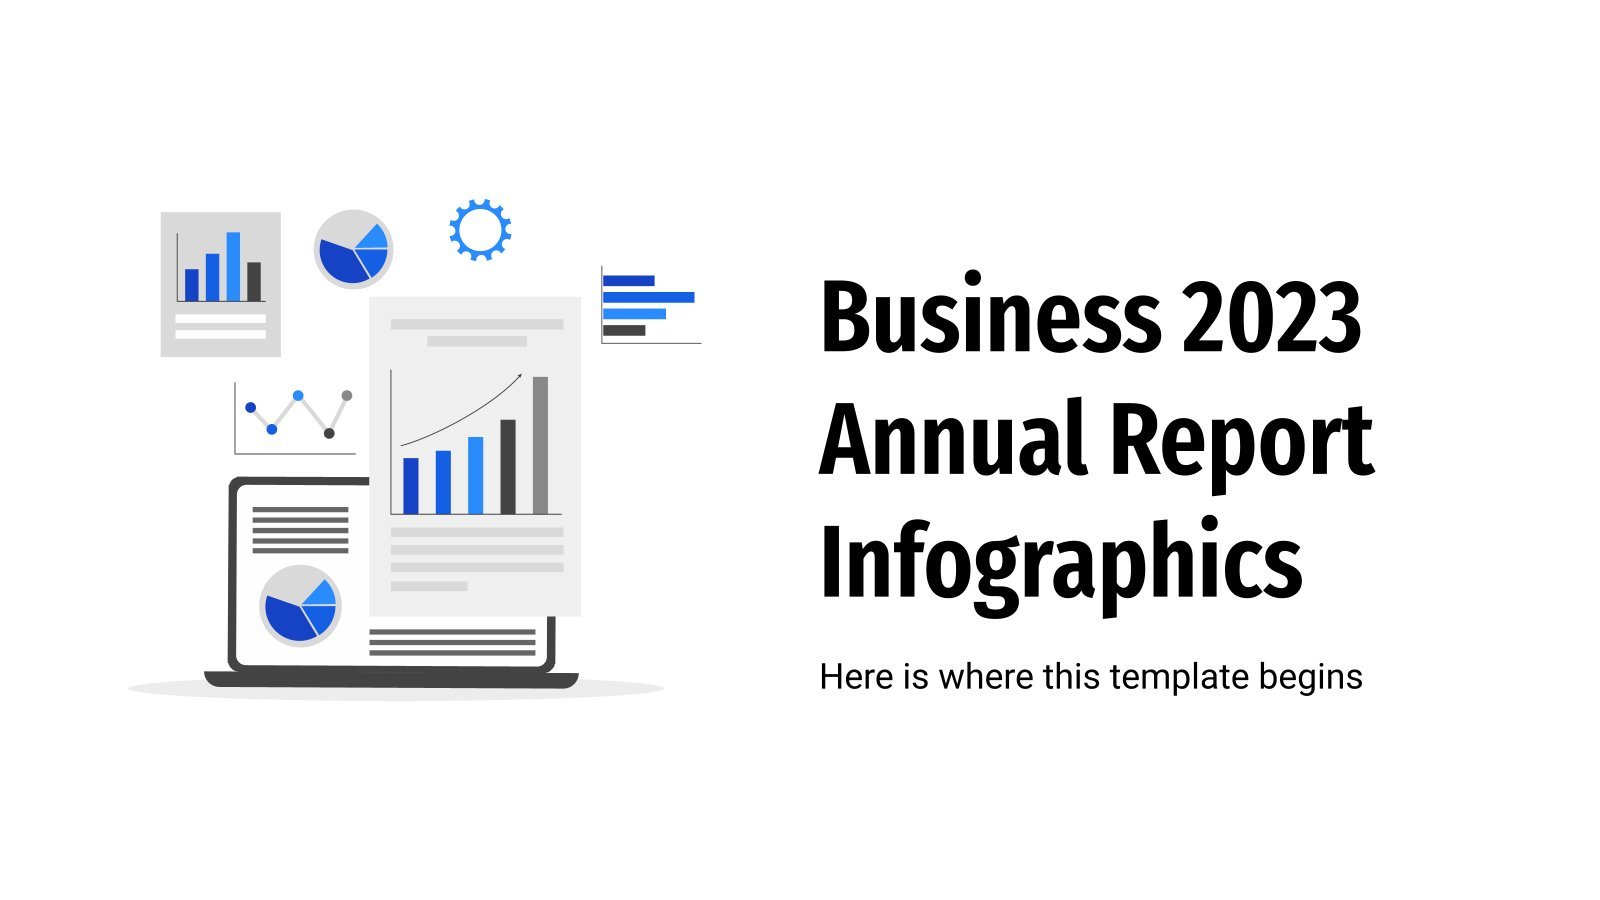
How did you company do during this year? Annalise your spendings, liabilities, earnings, profits, investments, etc. with this set of business infographics made for people who want to increase their productivity! They’re very easy to use and will help your company understand its achievements and its mistakes, to learn from...
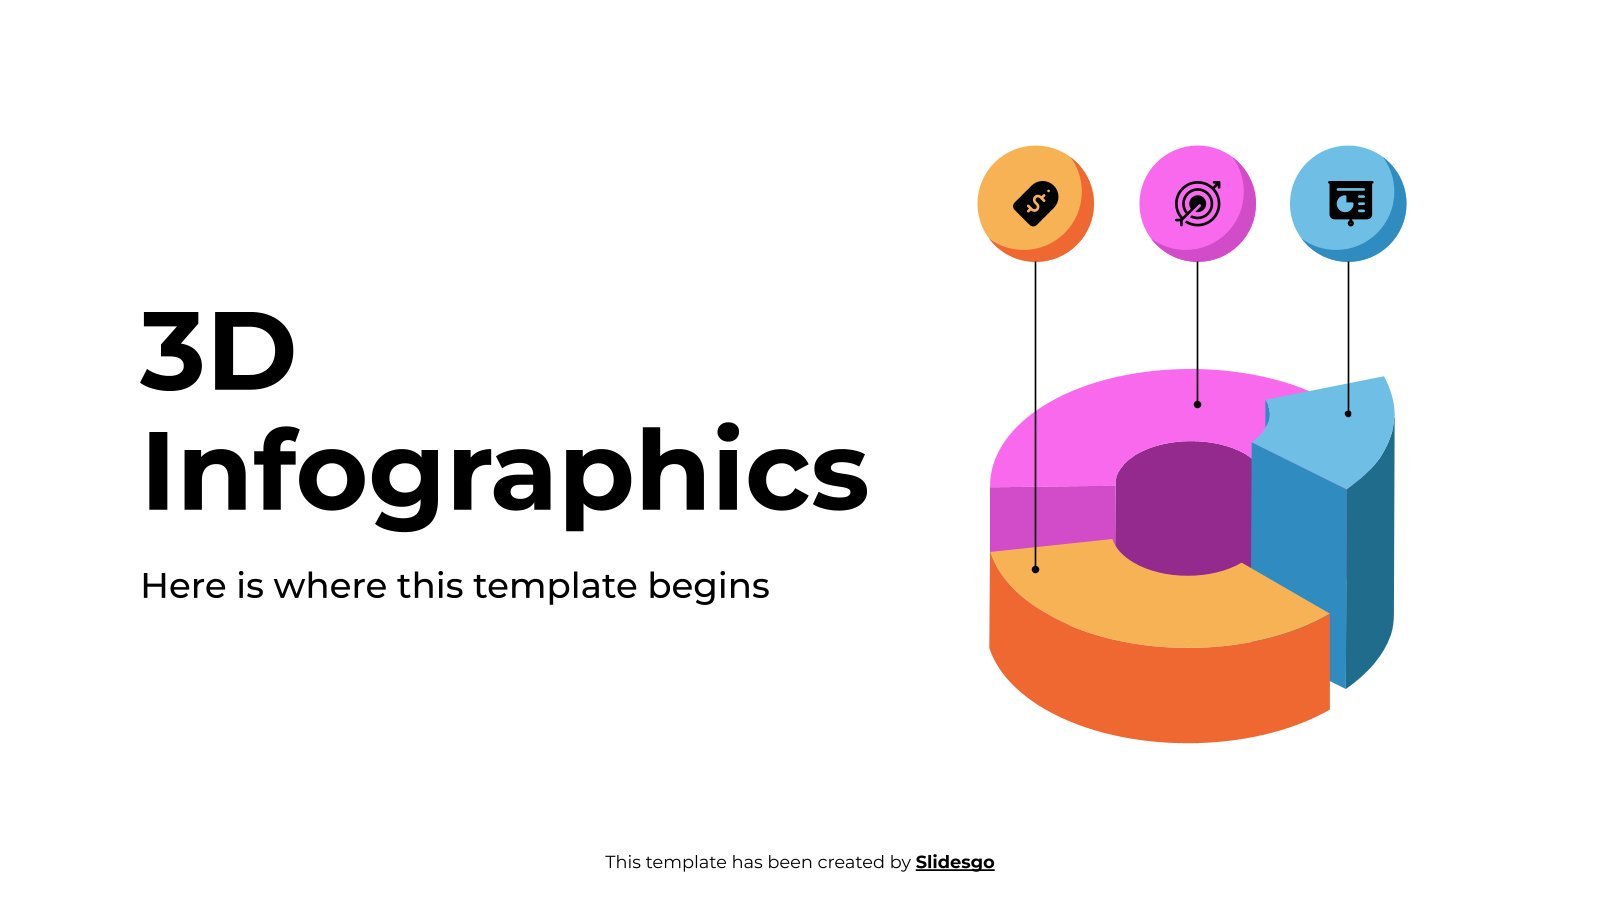
Download the "3D Infographics" template for PowerPoint or Google Slides and discover the power of infographics. An infographic resource gives you the ability to showcase your content in a more visual way, which will make it easier for your audience to understand your topic. Slidesgo infographics like this set here...
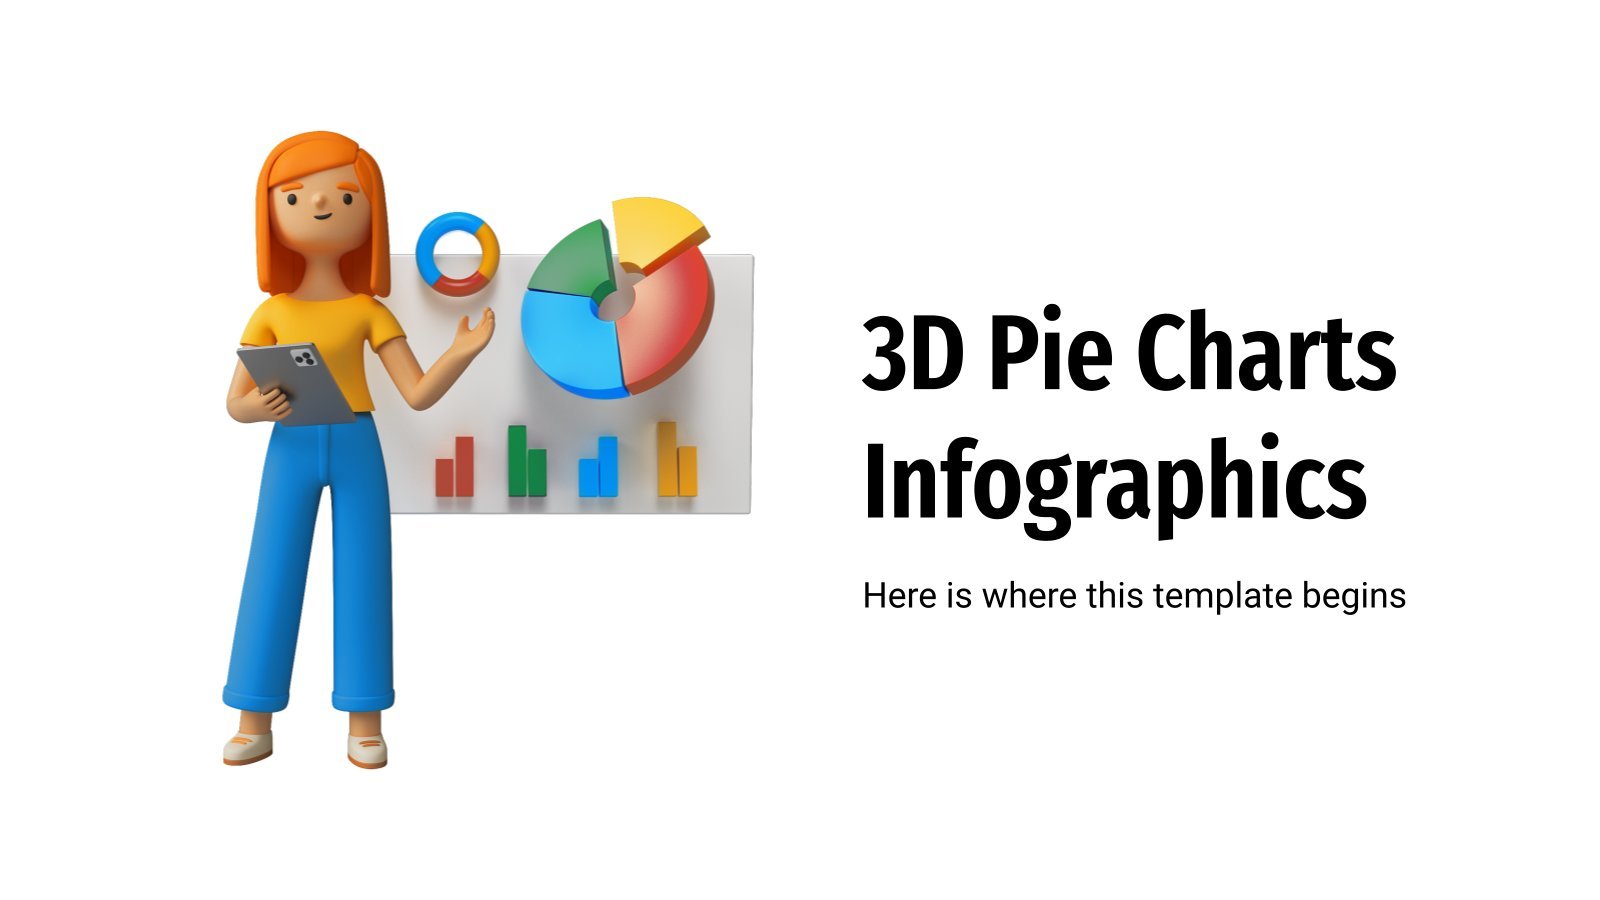
The popularity and clarity of pie charts make them the queen of all graphs! At a glance, you can see the percentage that corresponds to each slice, and if various colors are used too... the better! Slidesgo has this new template for you, which is a collection of around thirty...
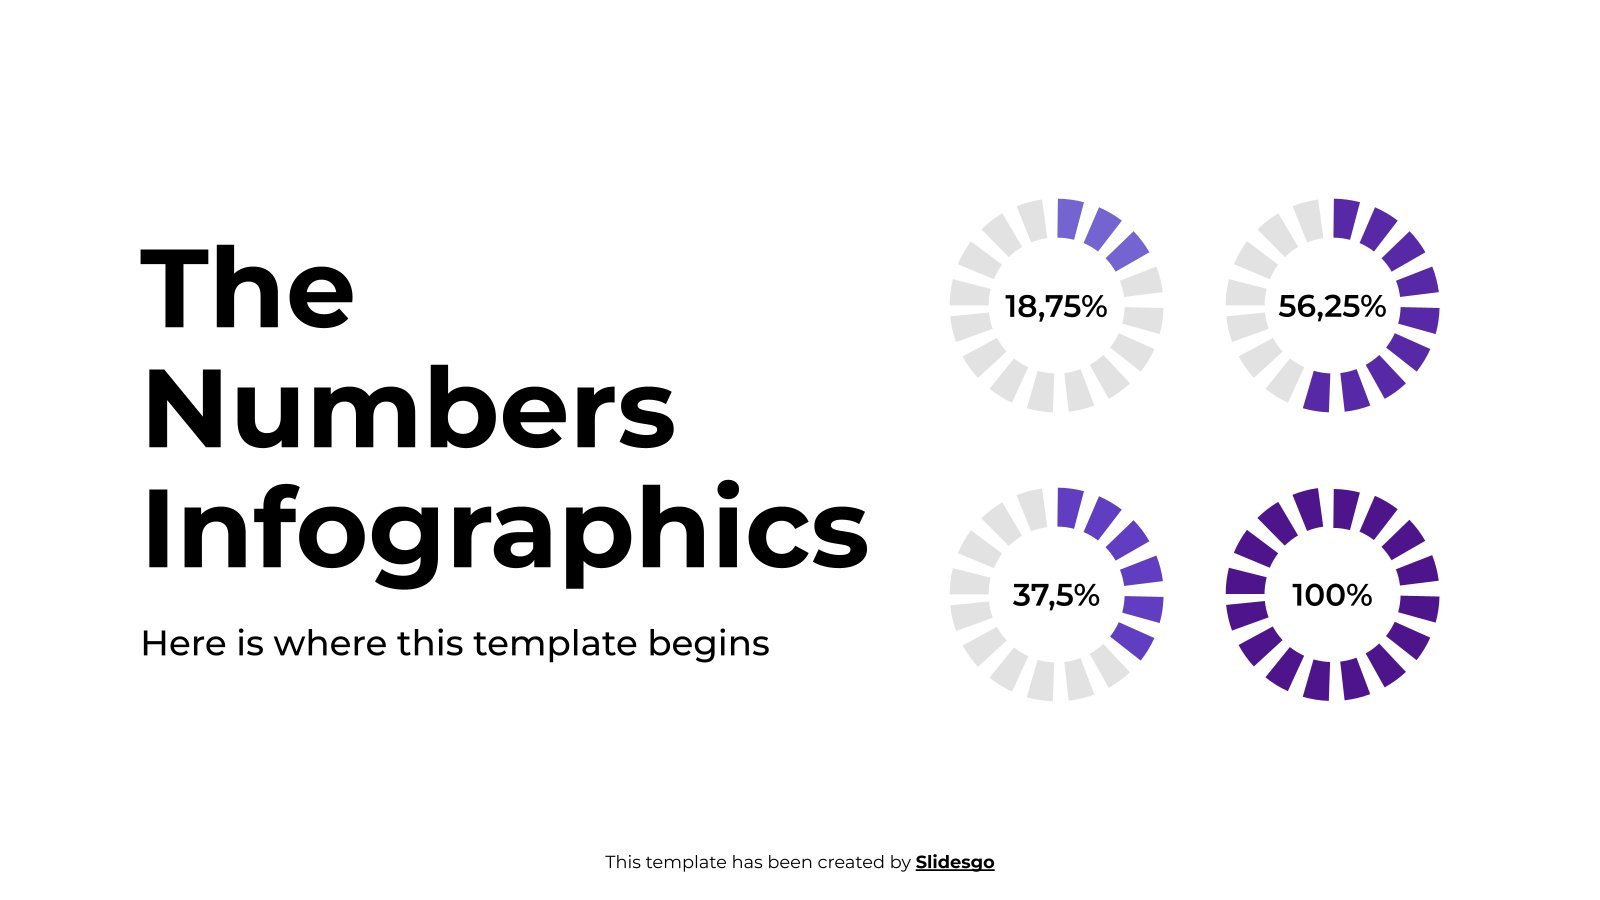
Download the "By The Numbers Infographics" template for PowerPoint or Google Slides and discover the power of infographics. An infographic resource gives you the ability to showcase your content in a more visual way, which will make it easier for your audience to understand your topic. Slidesgo infographics like this...

Download the Team Organization Charts Infographics template for PowerPoint or Google Slides to get the most out of infographics. Whether you want to organize your business budget in a table or schematically analyze your sales over the past year, this set of infographic resources will be of great help. Start...
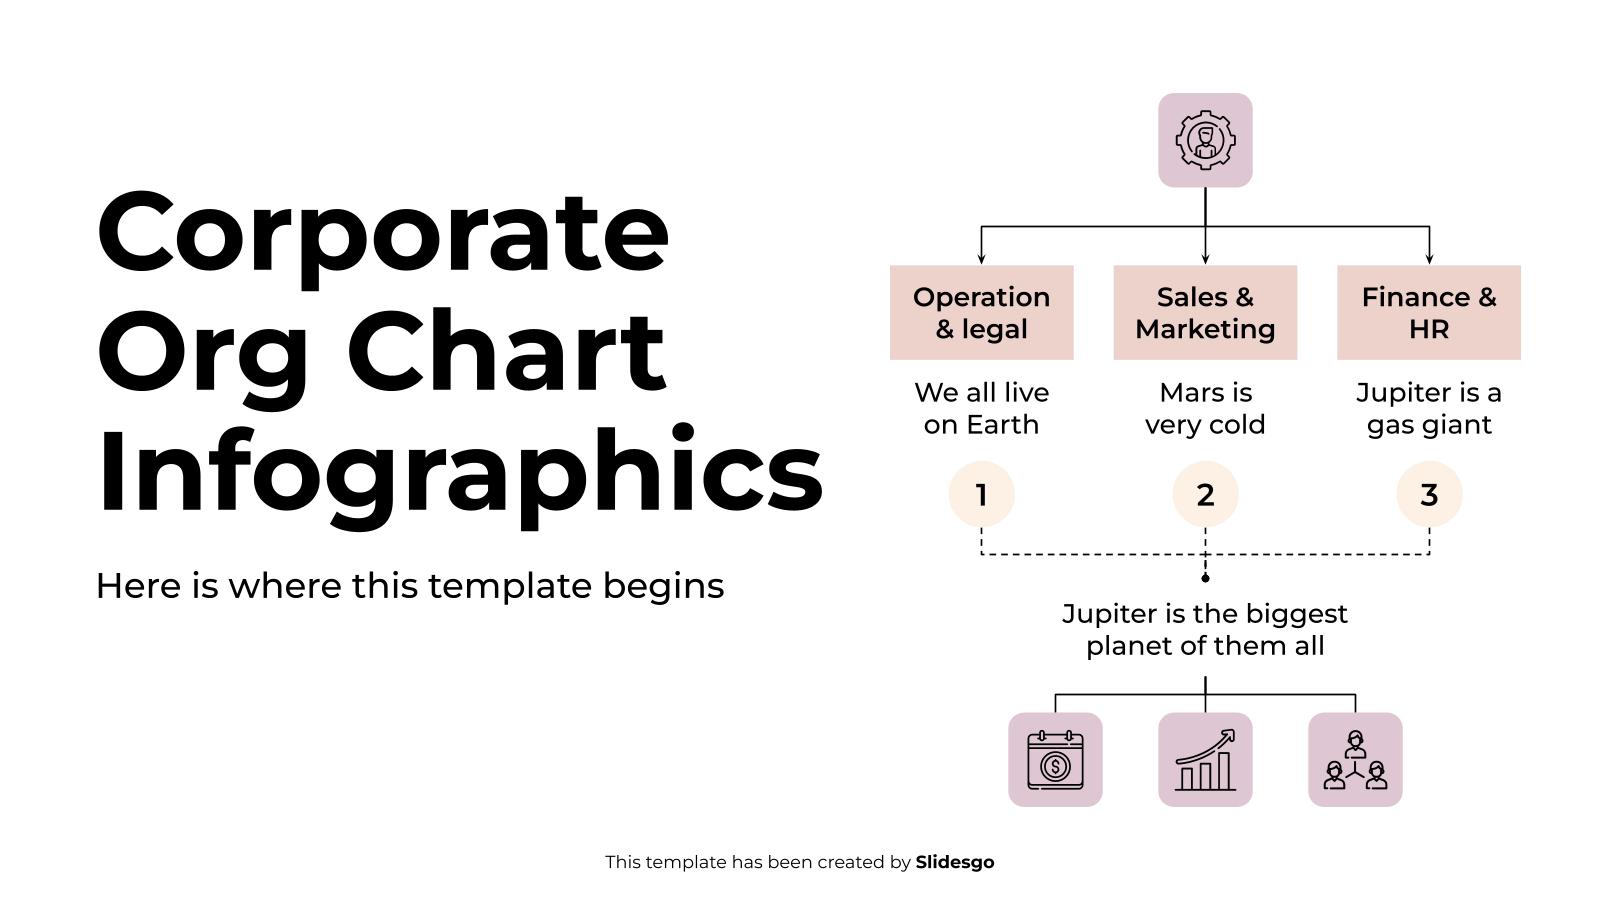
Download the Corporate Org Chart Infographics template for PowerPoint or Google Slides to get the most out of infographics. Whether you want to organize your business budget in a table or schematically analyze your sales over the past year, this set of infographic resources will be of great help. Start...

As a design agency, you already know about the importance of visual content! In Slidesgo we are aware of the power of visual information, that’s why we have published this set of infographics dedicated to the world of Design. In this set you will find 31 different infographics that will...
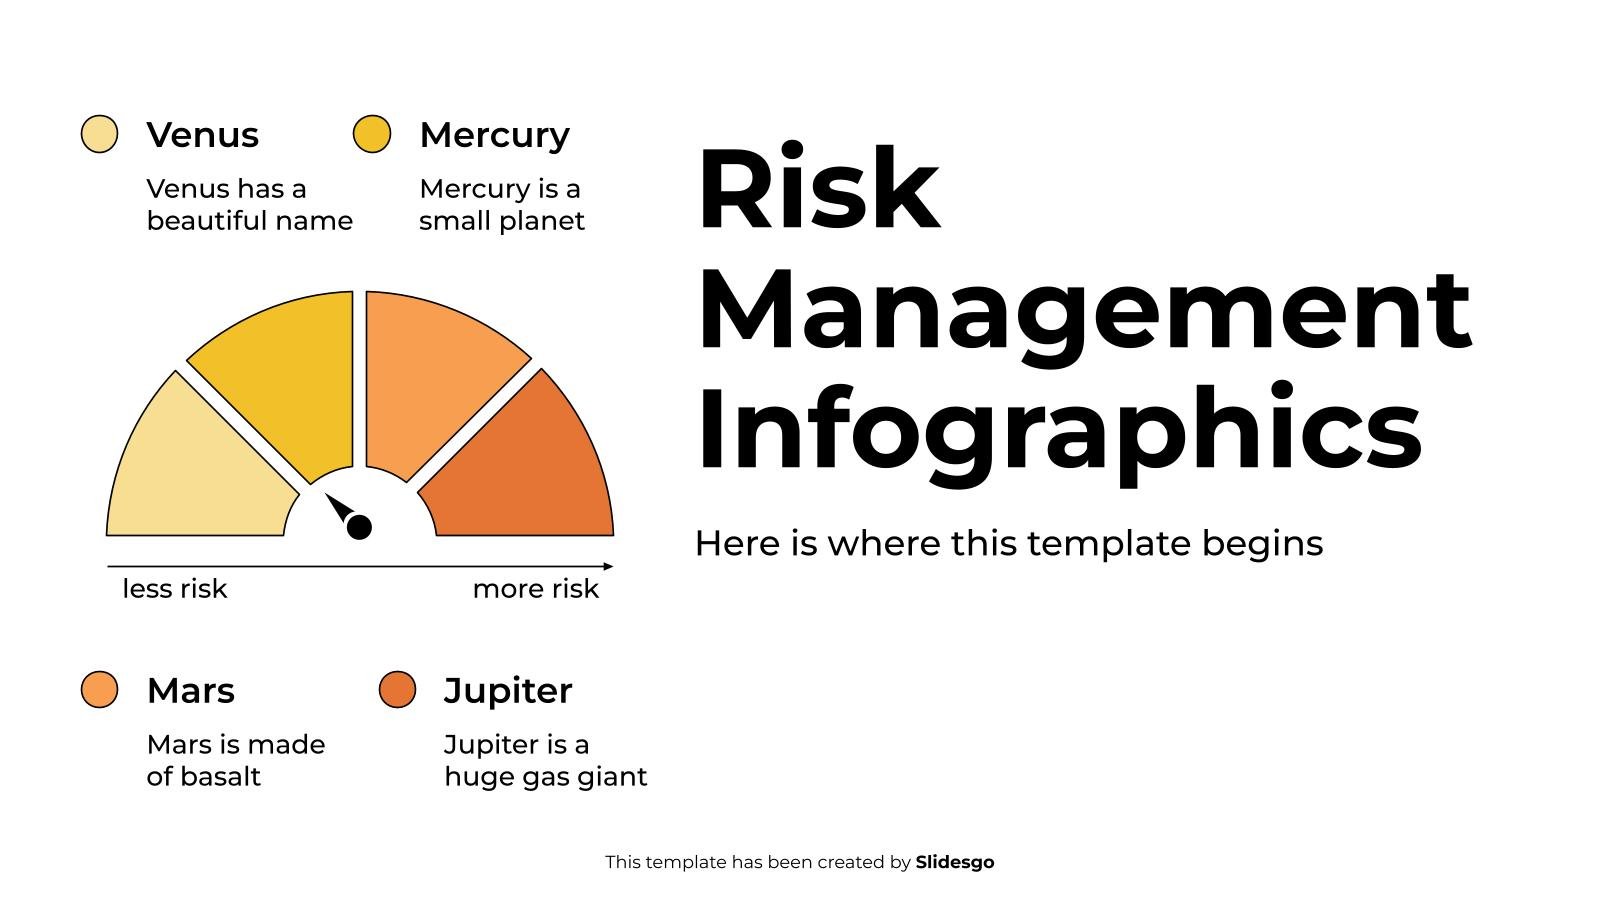
Download the Risk Management Infographics template for PowerPoint or Google Slides to get the most out of infographics. Whether you want to organize your business budget in a table or schematically analyze your sales over the past year, this set of infographic resources will be of great help. Start using...

Download the Business Diagram Infographics template for PowerPoint or Google Slides to get the most out of infographics. Whether you want to organize your business budget in a table or schematically analyze your sales over the past year, this set of infographic resources will be of great help. Start using...

Download the Monthly KPIs Overview Infographics template for PowerPoint or Google Slides to get the most out of infographics. Whether you want to organize your business budget in a table or schematically analyze your sales over the past year, this set of infographic resources will be of great help. Start...
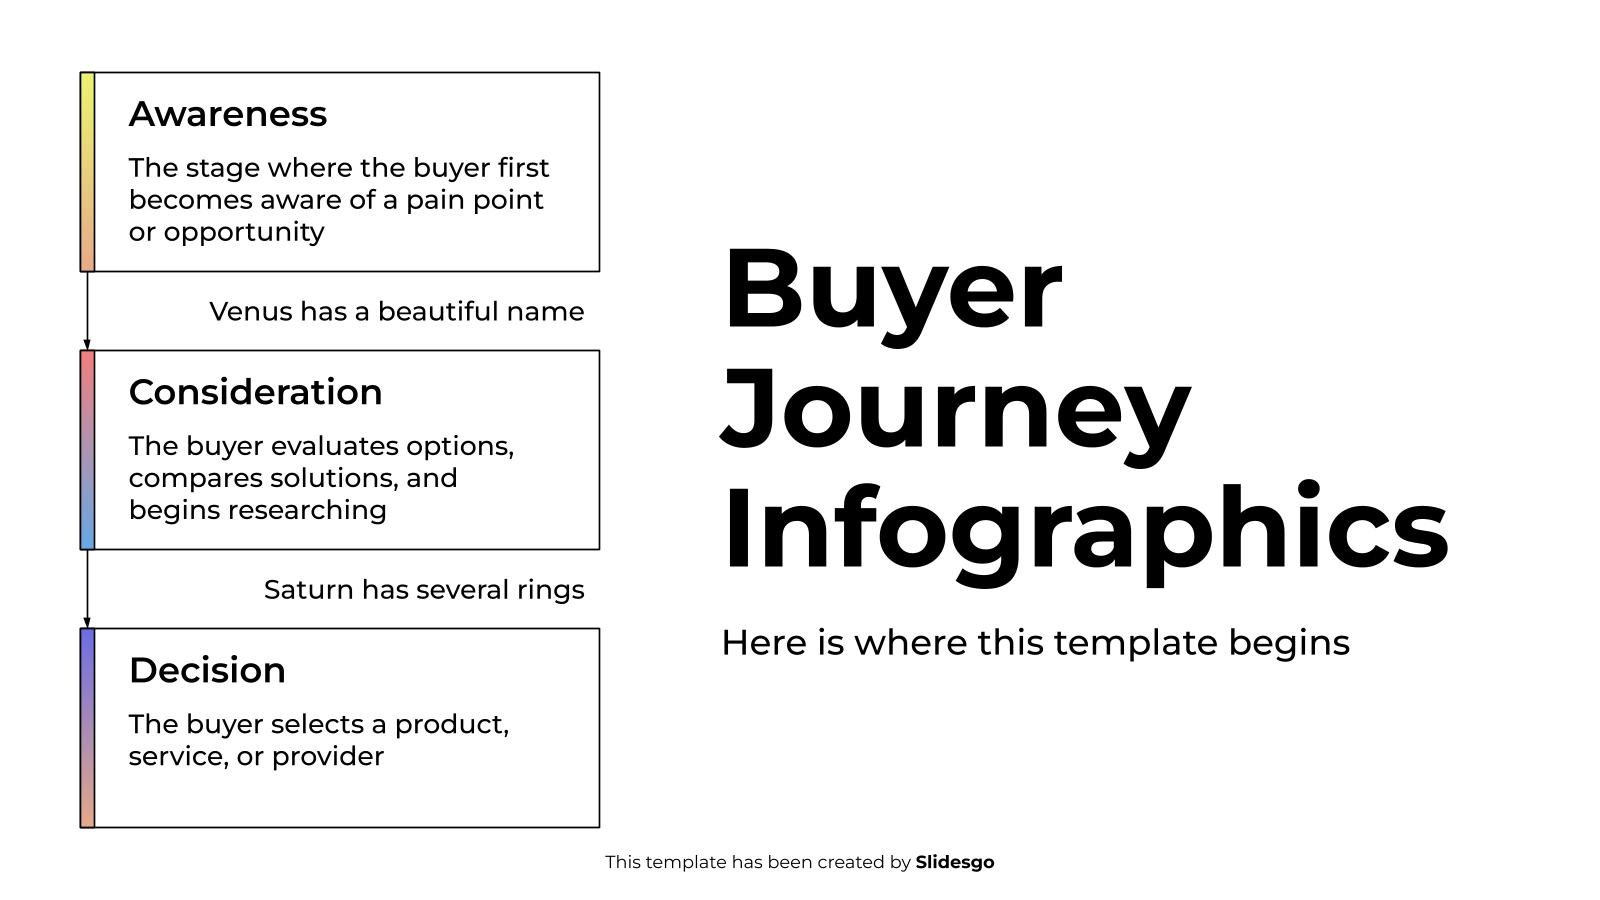
Download the Buyer Journey Infographics template for PowerPoint or Google Slides to get the most out of infographics. Whether you want to organize your business budget in a table or schematically analyze your sales over the past year, this set of infographic resources will be of great help. Start using...
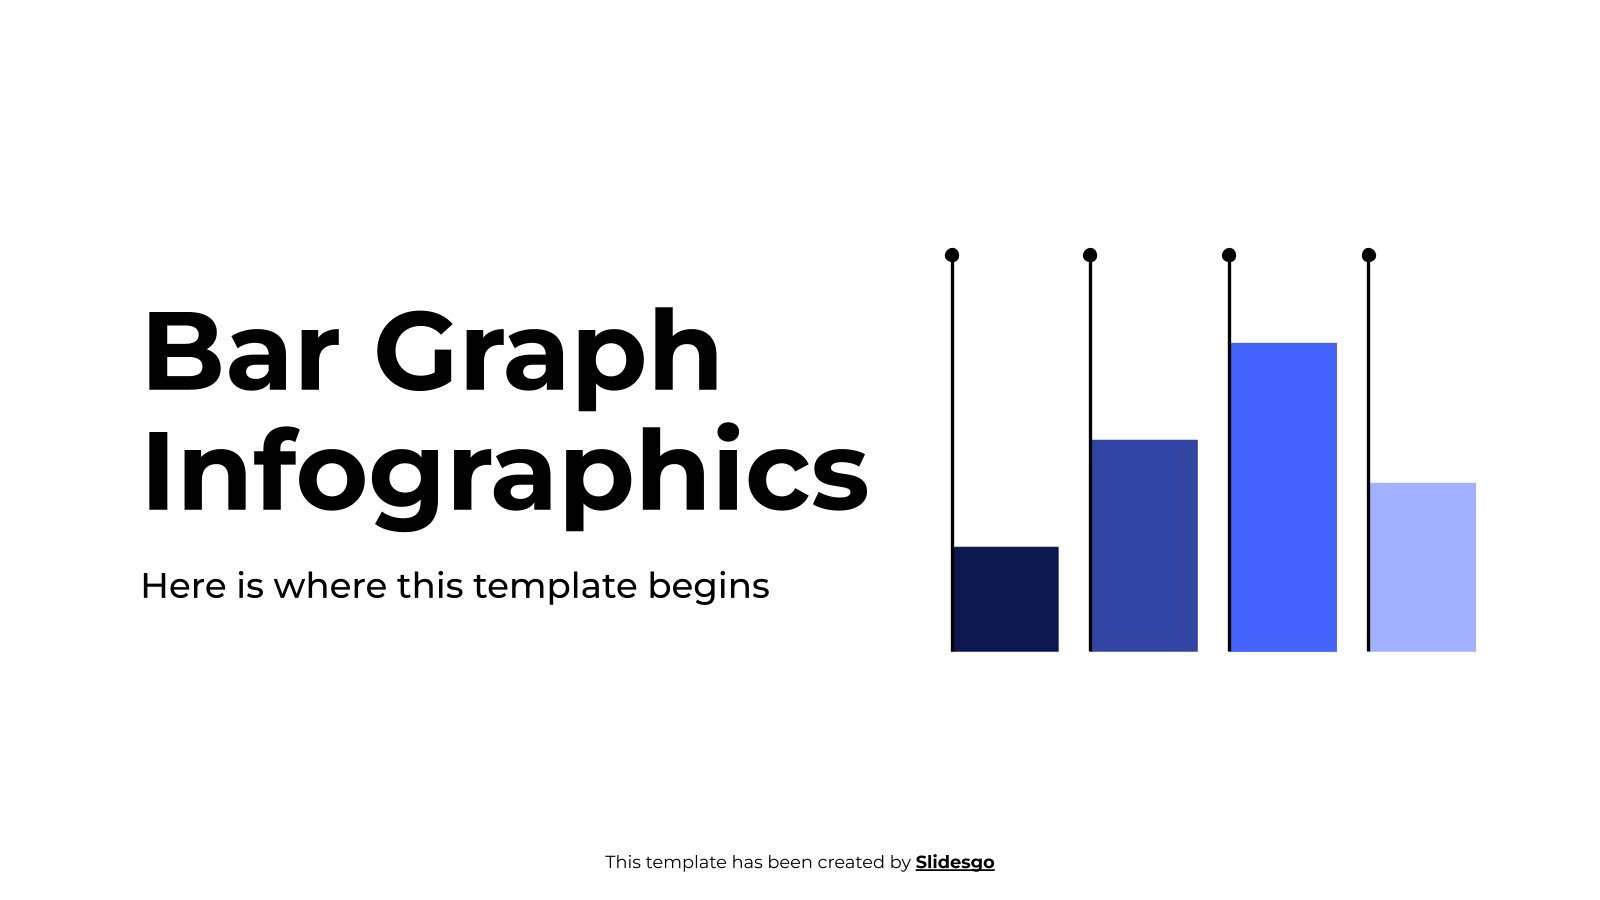
Download the "Bar Graph Infographics" template for PowerPoint or Google Slides and discover the power of infographics. An infographic resource gives you the ability to showcase your content in a more visual way, which will make it easier for your audience to understand your topic. Slidesgo infographics like this set...
Download the Chart Infographics template for PowerPoint or Google Slides to get the most out of infographics. Whether you want to organize your business budget in a table or schematically analyze your sales over the past year, this set of infographic resources will be of great help. Start using infographics...

What has 2021 left us? Did the economy go up or did it worsen? Did global warming affect temperatures in your country? These infographics are absolutely multi-purpose, as their variety is suitable for a lot of different topics. Are you looking for circular graphs? Or timelines? Maybe a map of...