


Like
Share


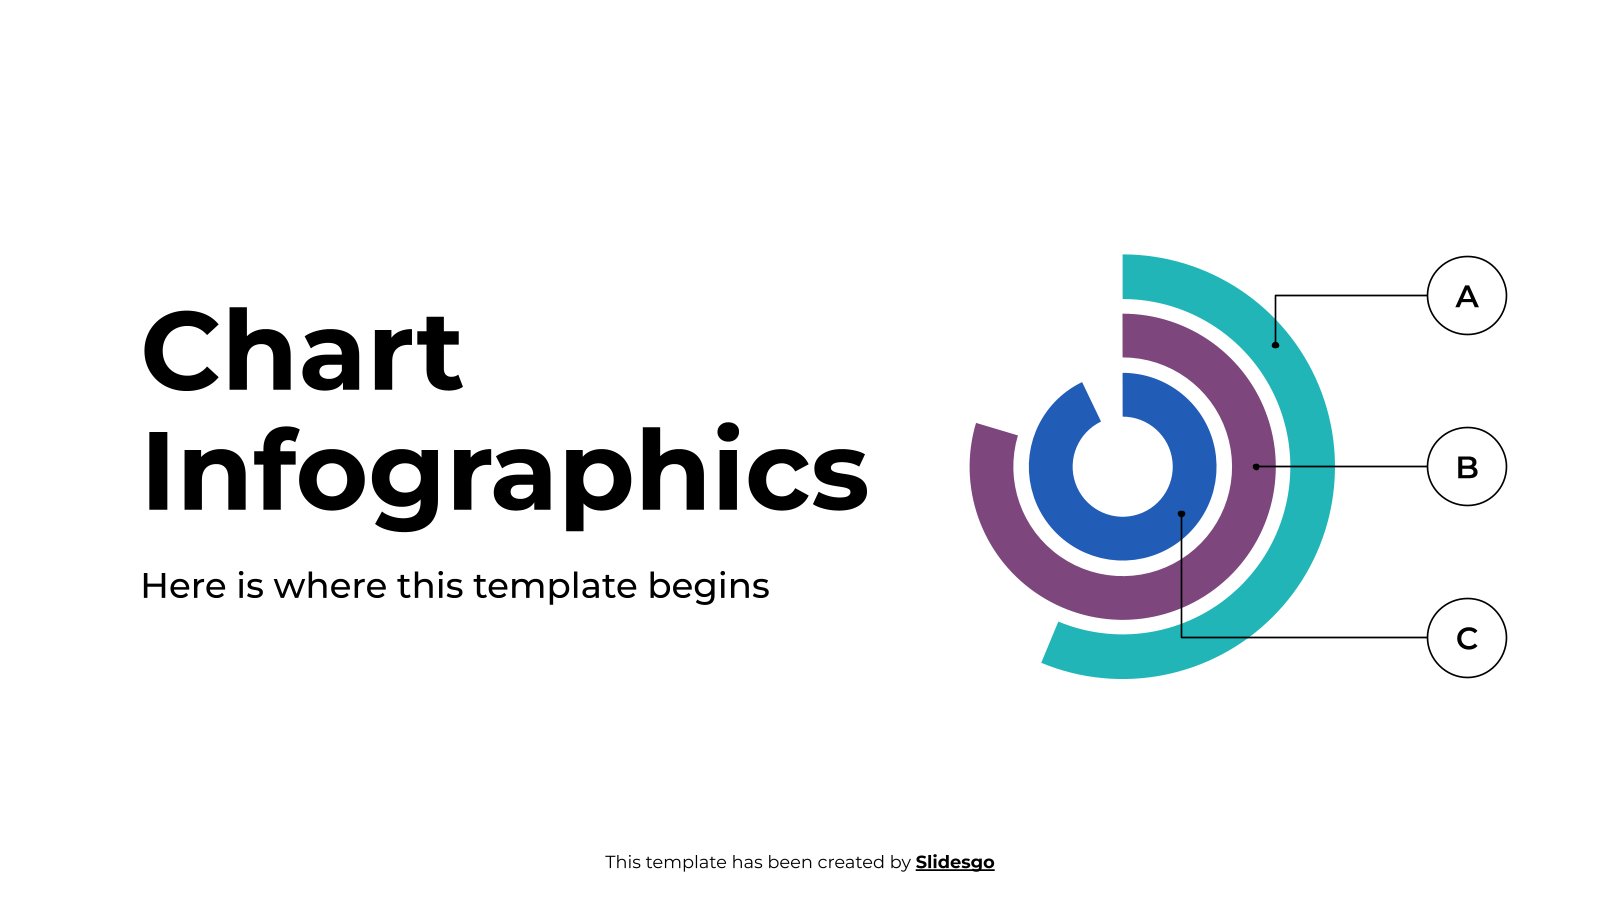
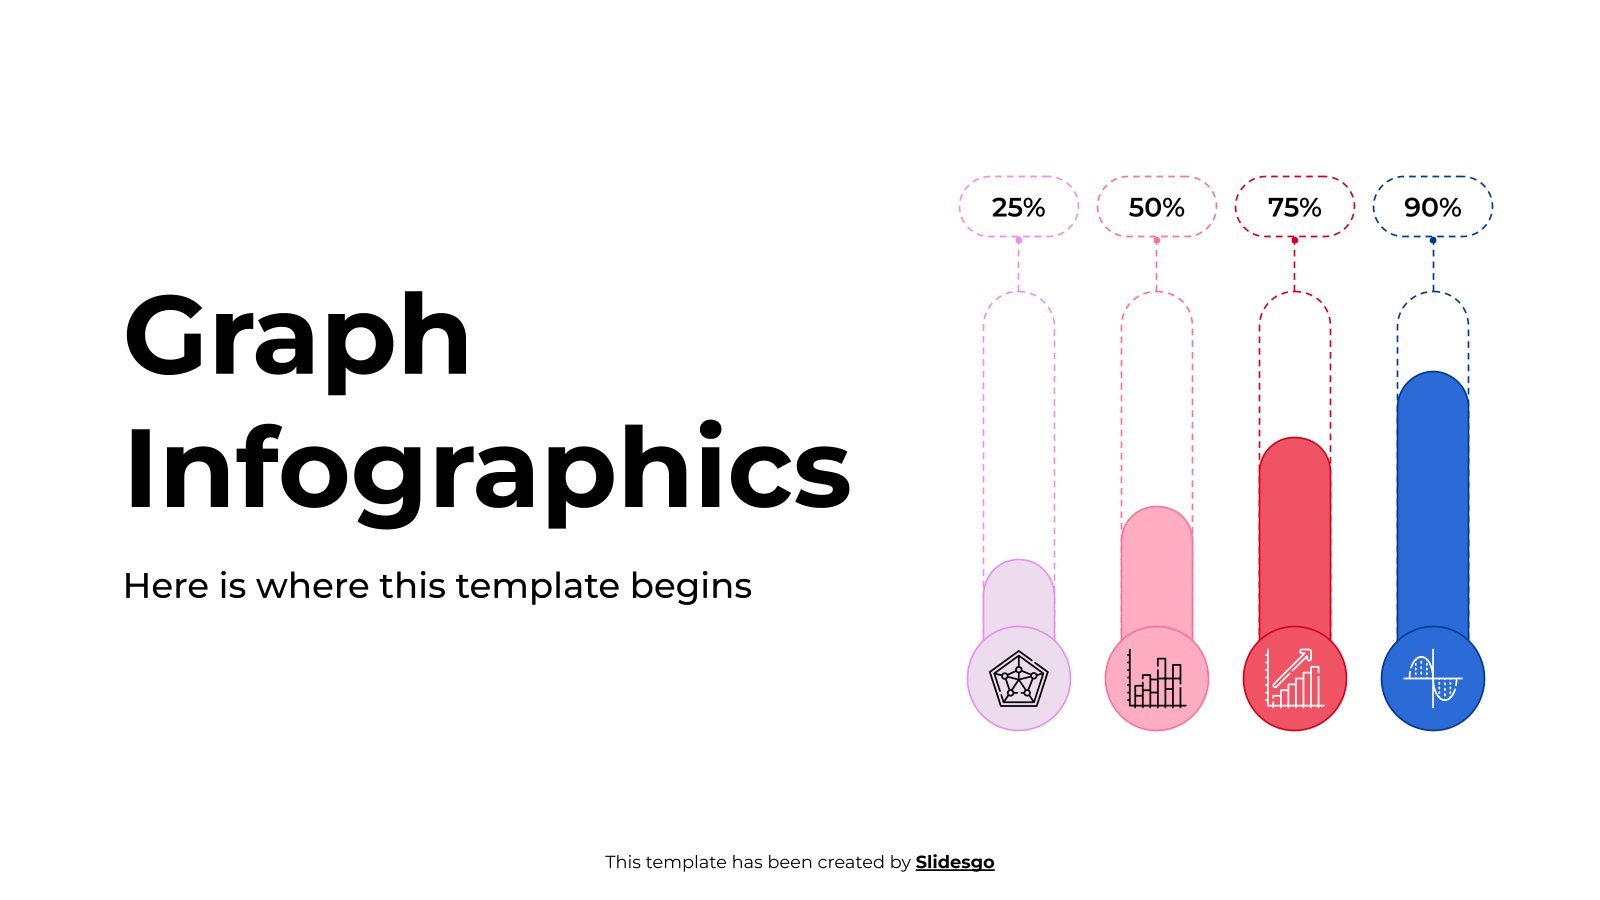
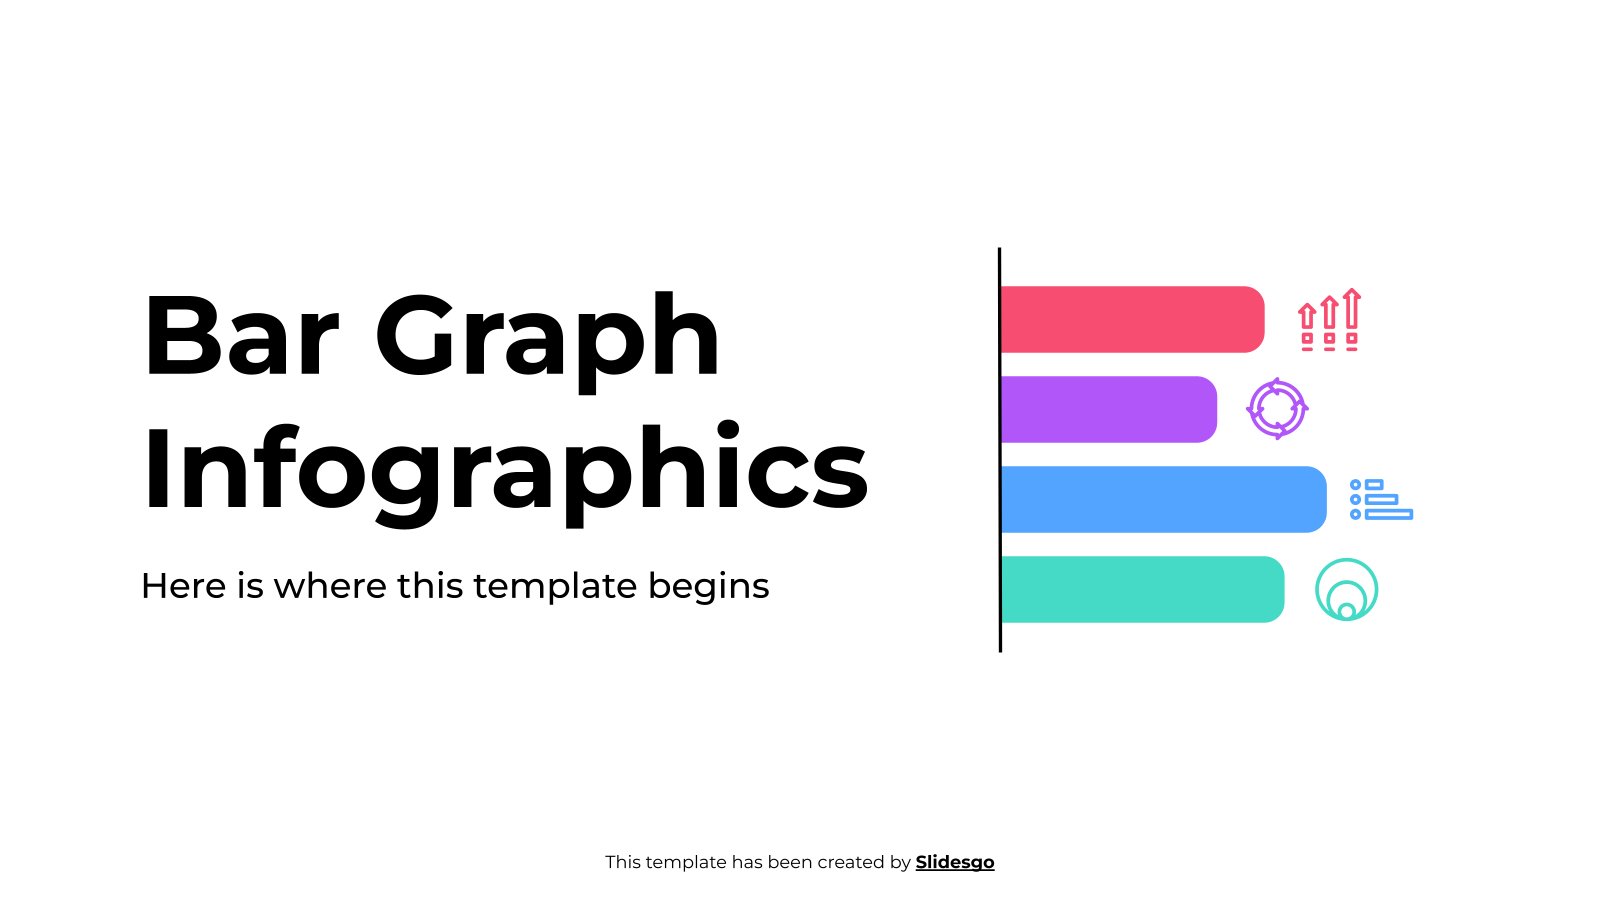
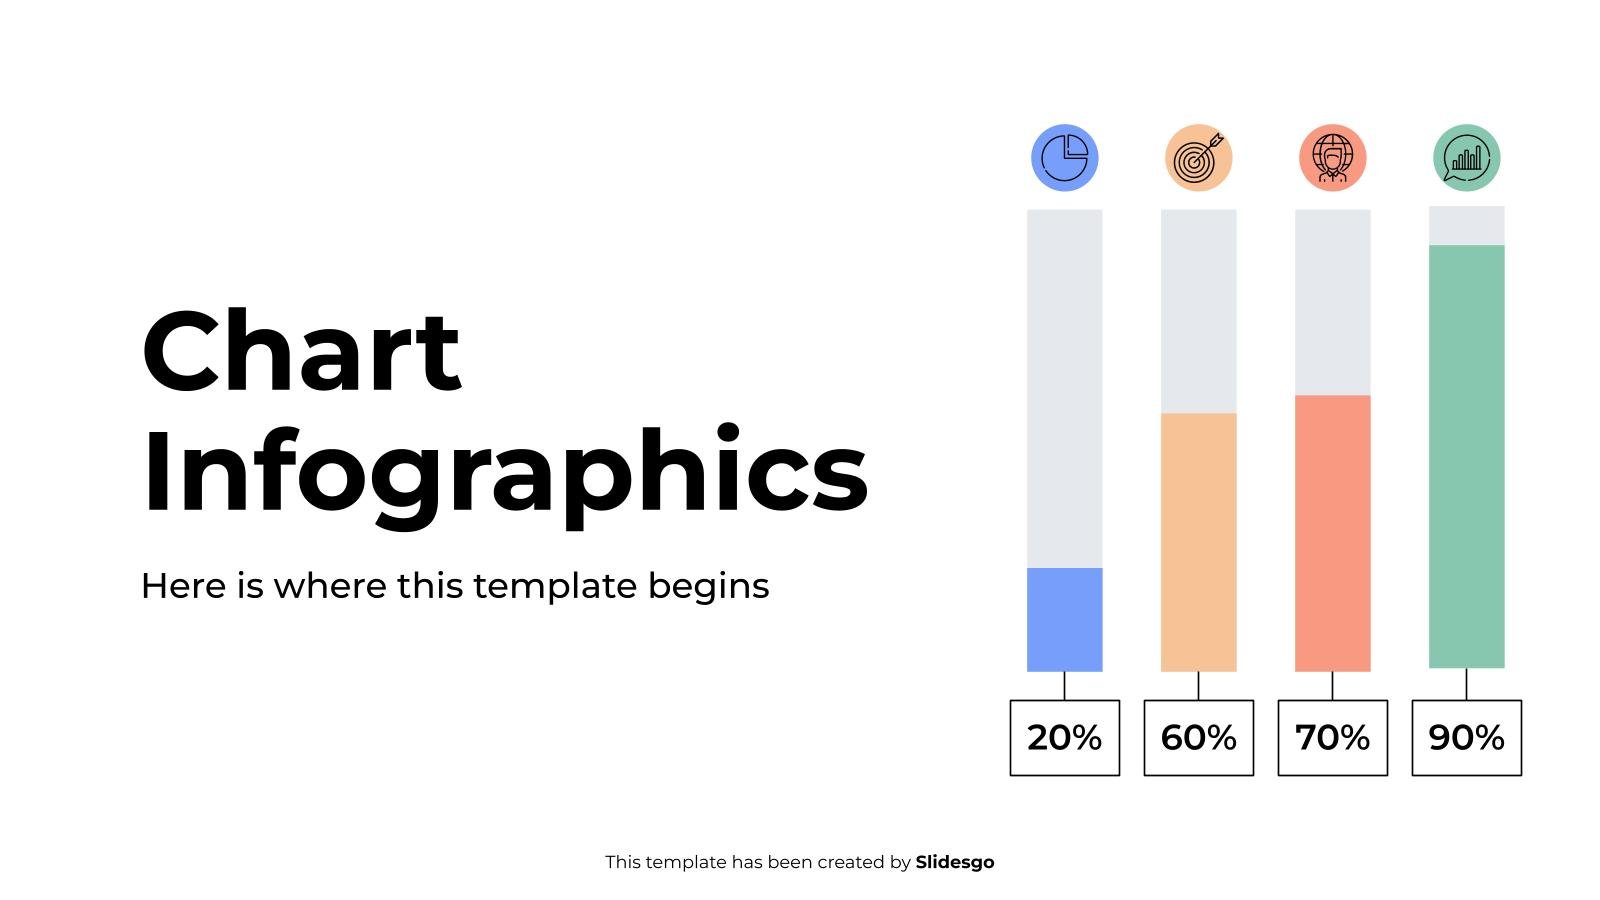
Waffle Chart Infographics
Free template
Everyone knows about pie charts, but have you ever heard of a little variant known as waffle chart? It uses little colored squares to show the area proportional to the percentage that is represented. Now it's your time to use them in your own presentations thanks to this template! Our designs go even beyond and some of them use icons or other shapes instead, just to give a little more customization to it. Don't hesitate to these!
Features of these infographics
- 100% editable and easy to modify
- 30 different infographics to boost your presentations
- Include icons and Flaticon’s extension for further customization
- Designed to be used in Google Slides, Canva, and Microsoft PowerPoint and Keynote
- 16:9 widescreen format suitable for all types of screens
- Include information about how to edit and customize your infographics
- Learn more in How to use this template?
Ads

Register for free and start downloading now
Register on our website to download 3 FREE templates every month, or GO Premium for unlimited downloads!
Related templates
/
Like
Download
/
Like
Download
/
Like
Download

/
Like
Download

/
Like
Download
/
Like
Download

/
Like
Download

/
Like
Download

/
Like
Download

/
Like
Download

/
Like
Download

/
Like
Download
/
Like
Download

/
Like
Download
/
Like
Download
Popular templates

/
Like
Download
Generate content with AI

/
Like
Download

/
Like
Download
Generate content with AI
/
Like
Download
Generate content with AI

/
Like
Download
Generate content with AI

/
Like
Download
Generate content with AI