


Like
Share


Data Charts
Free template
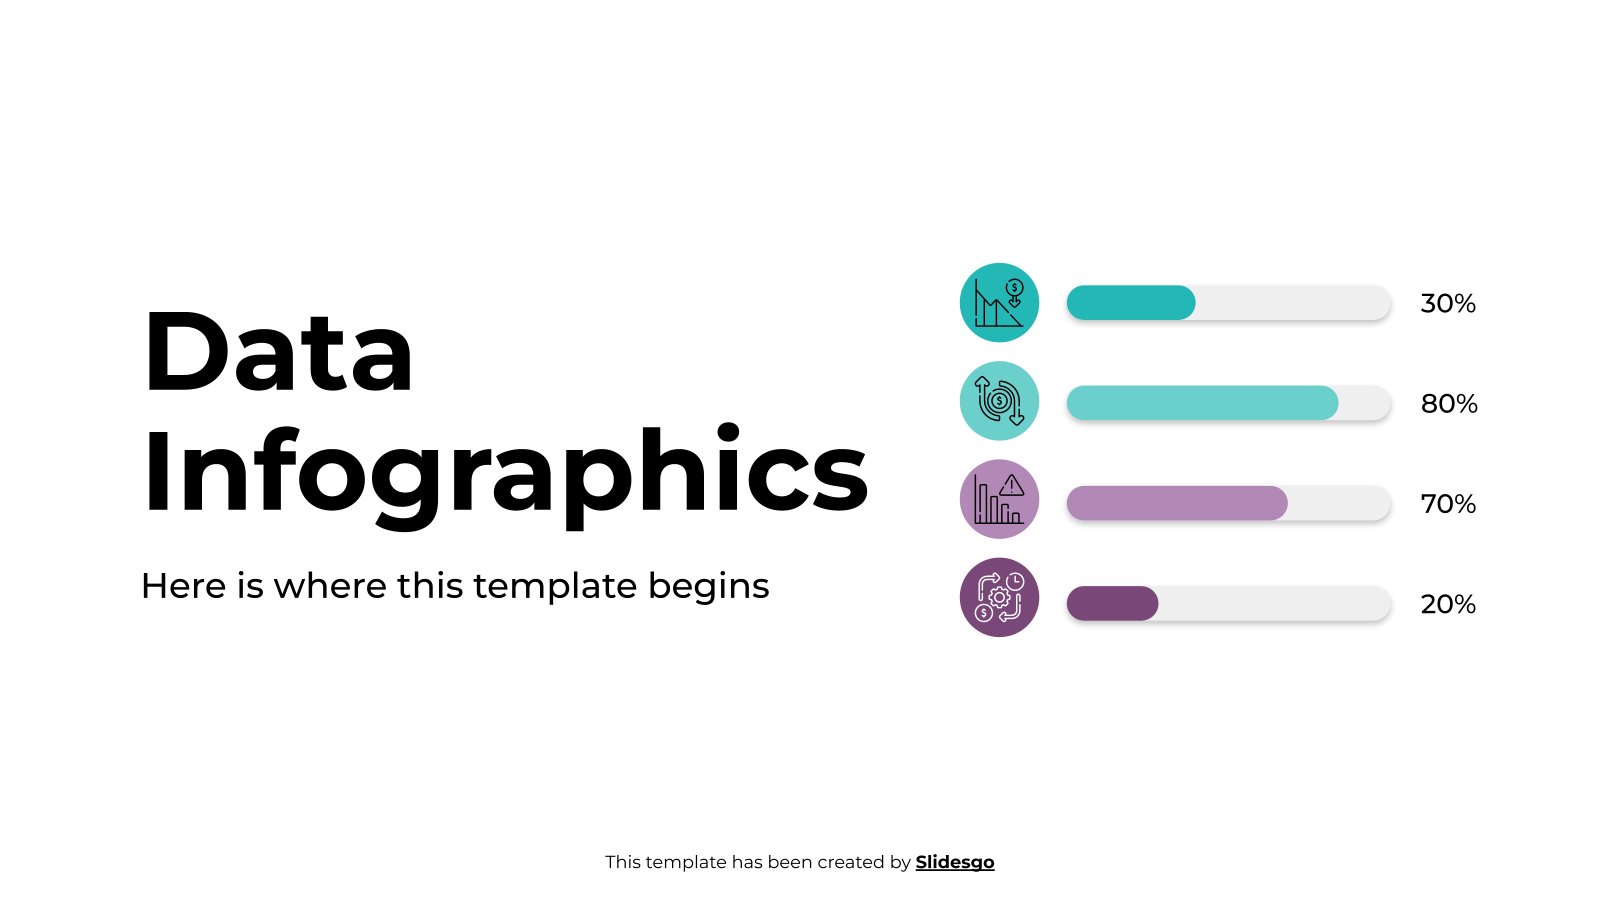
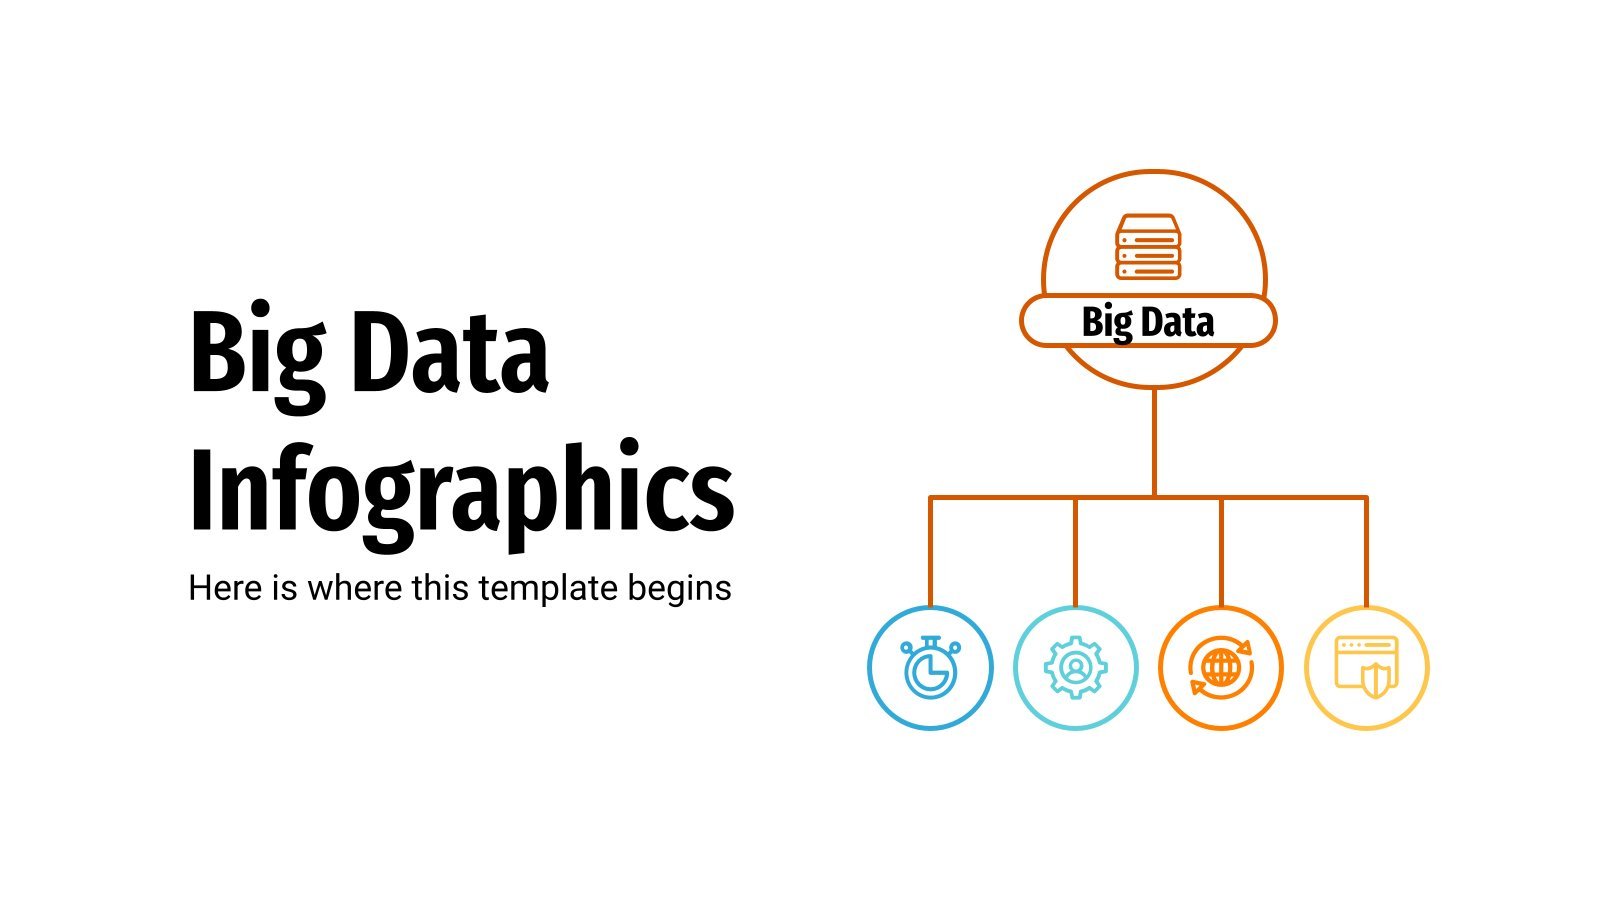
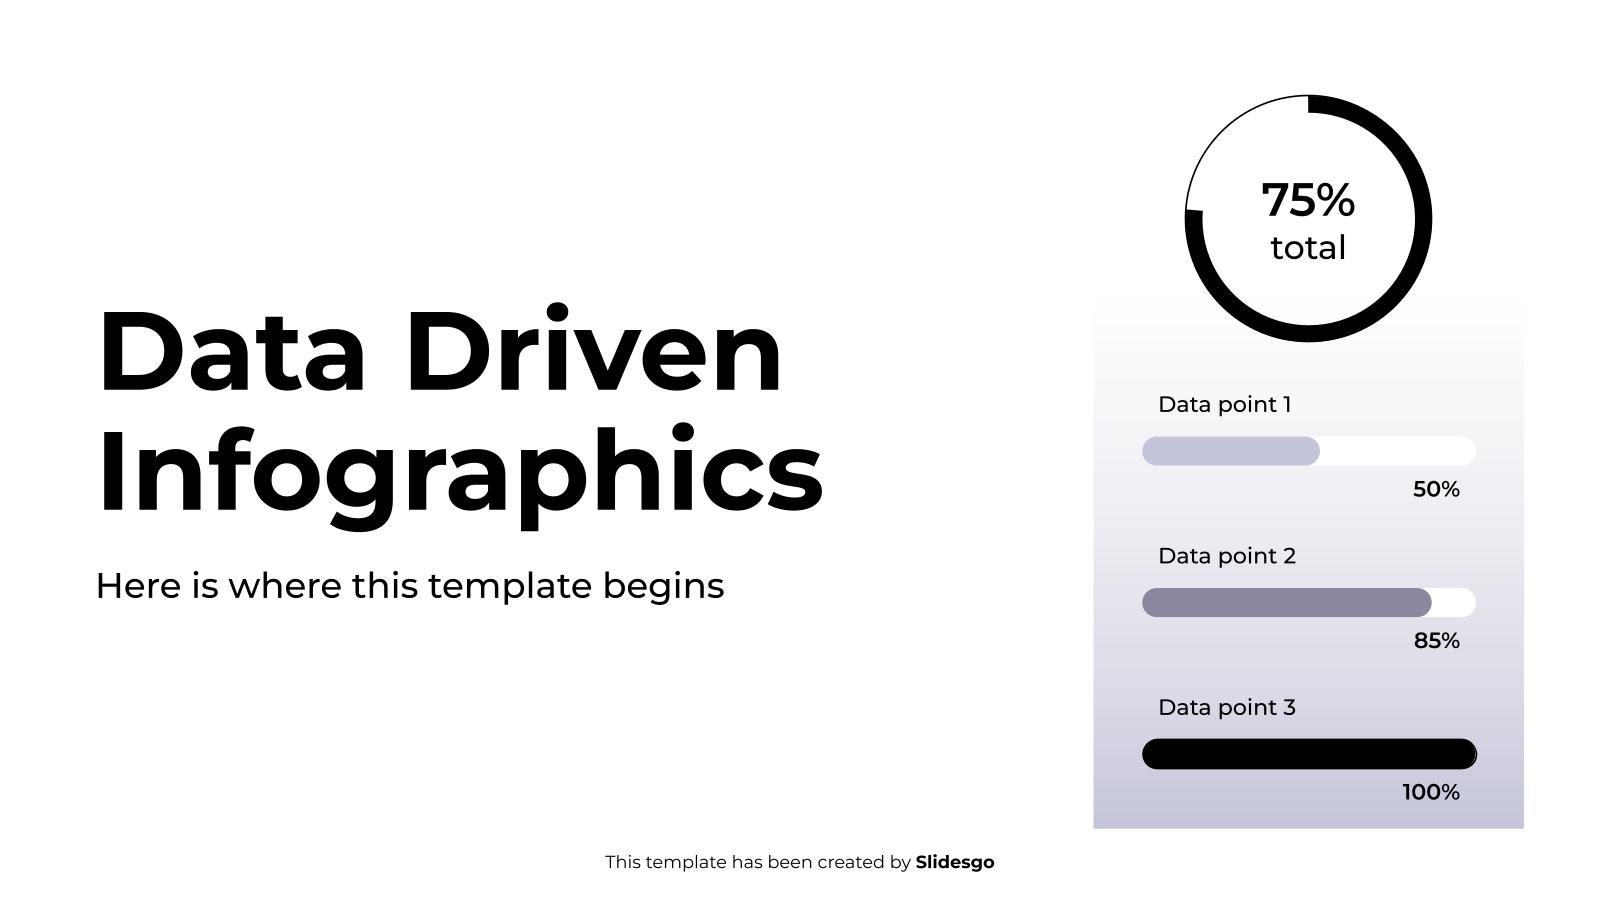
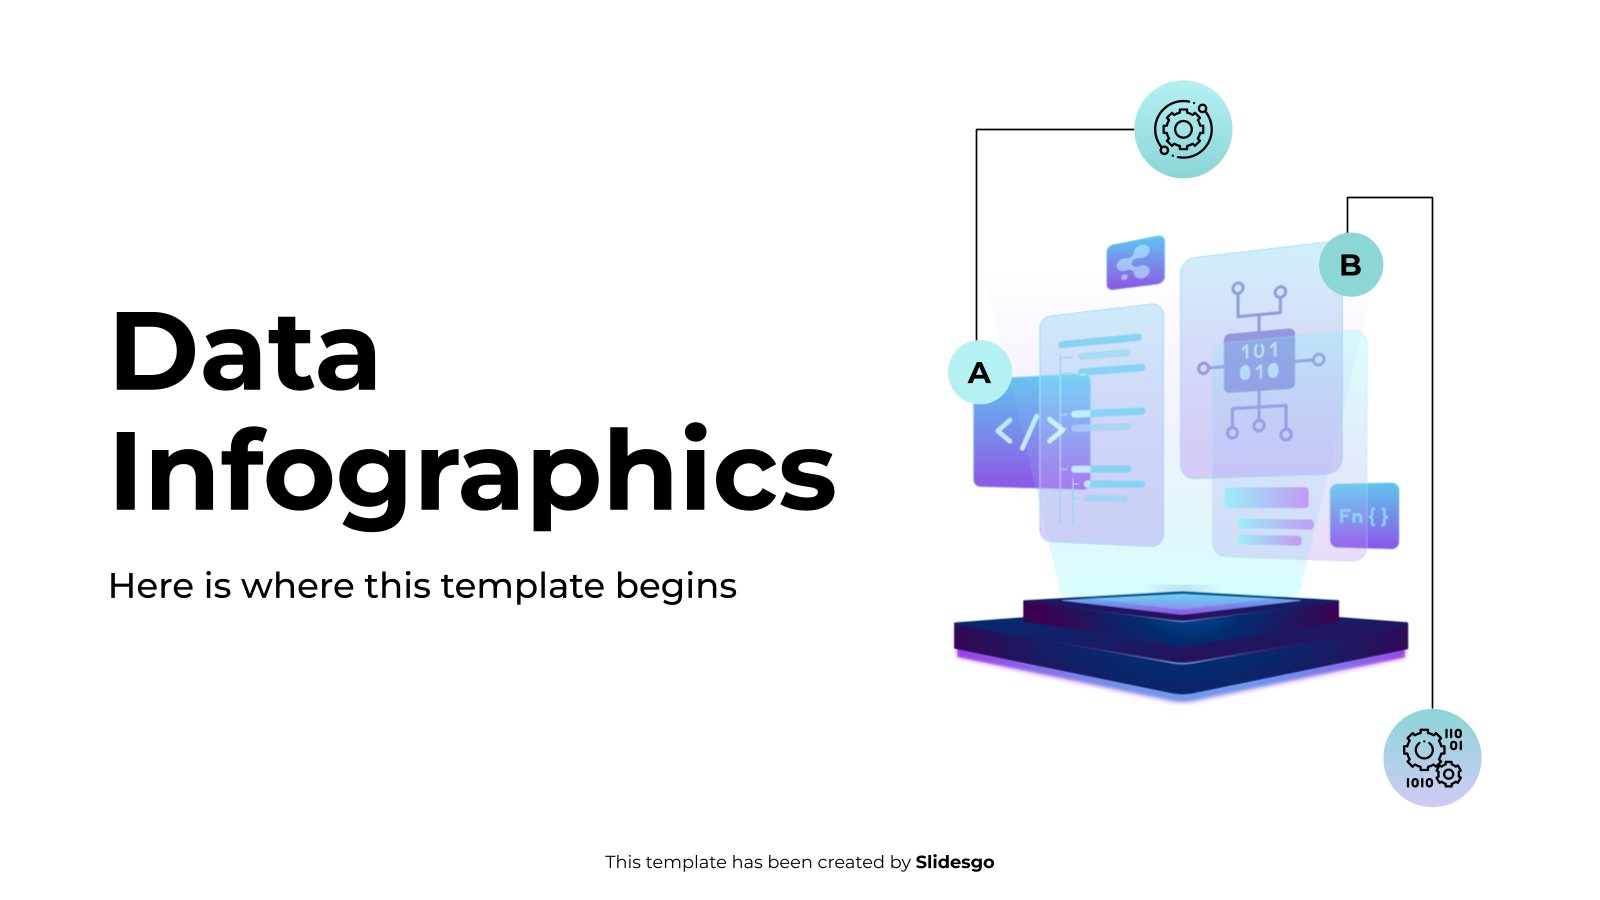
Do you need different sorts of charts to present your data? If you are a researcher, entrepreneur, marketeer, student, teacher or physician, these data infographics will help you a lot!
We have 30 different data diagrams for you. We have created a lot of different designs using different hues of blue: line, bars, pyramid or pie charts, together with different sorts of icons related to business, health or education, although you can edit and change them. No matter which type of chart you need, you’ll find the perfect one here.
Features of these infographics
- Different designs of multi-purpose data charts
- 100% editable and easy to modify
- 30 different infographics to boost your presentations
- Include icons and Flaticon’s extension for further customization
- Designed to be used in Google Slides, Canva, and Microsoft PowerPoint and Keynote
- 16:9 widescreen format suitable for all types of screens
- Include information about how to edit and customize your infographics
- Learn more in How to use this template?
Ads

Register for free and start downloading now
Register on our website to download 3 FREE templates every month, or GO Premium for unlimited downloads!
Related templates
/
Like
Download

/
Like
Download

/
Like
Download
/
Like
Download

/
Like
Download
/
Like
Download
/
Like
Download

/
Like
Download
/
Like
Download

/
Like
Download
/
Like
Download

/
Like
Download

/
Like
Download
/
Like
Download
/
Like
Download
Popular templates

/
Like
Download
Generate content with AI
/
Like
Download

/
Like
Download
Generate content with AI

/
Like
Download
Generate content with AI

/
Like
Download

/
Like
Download
Generate content with AI