


Like
Share


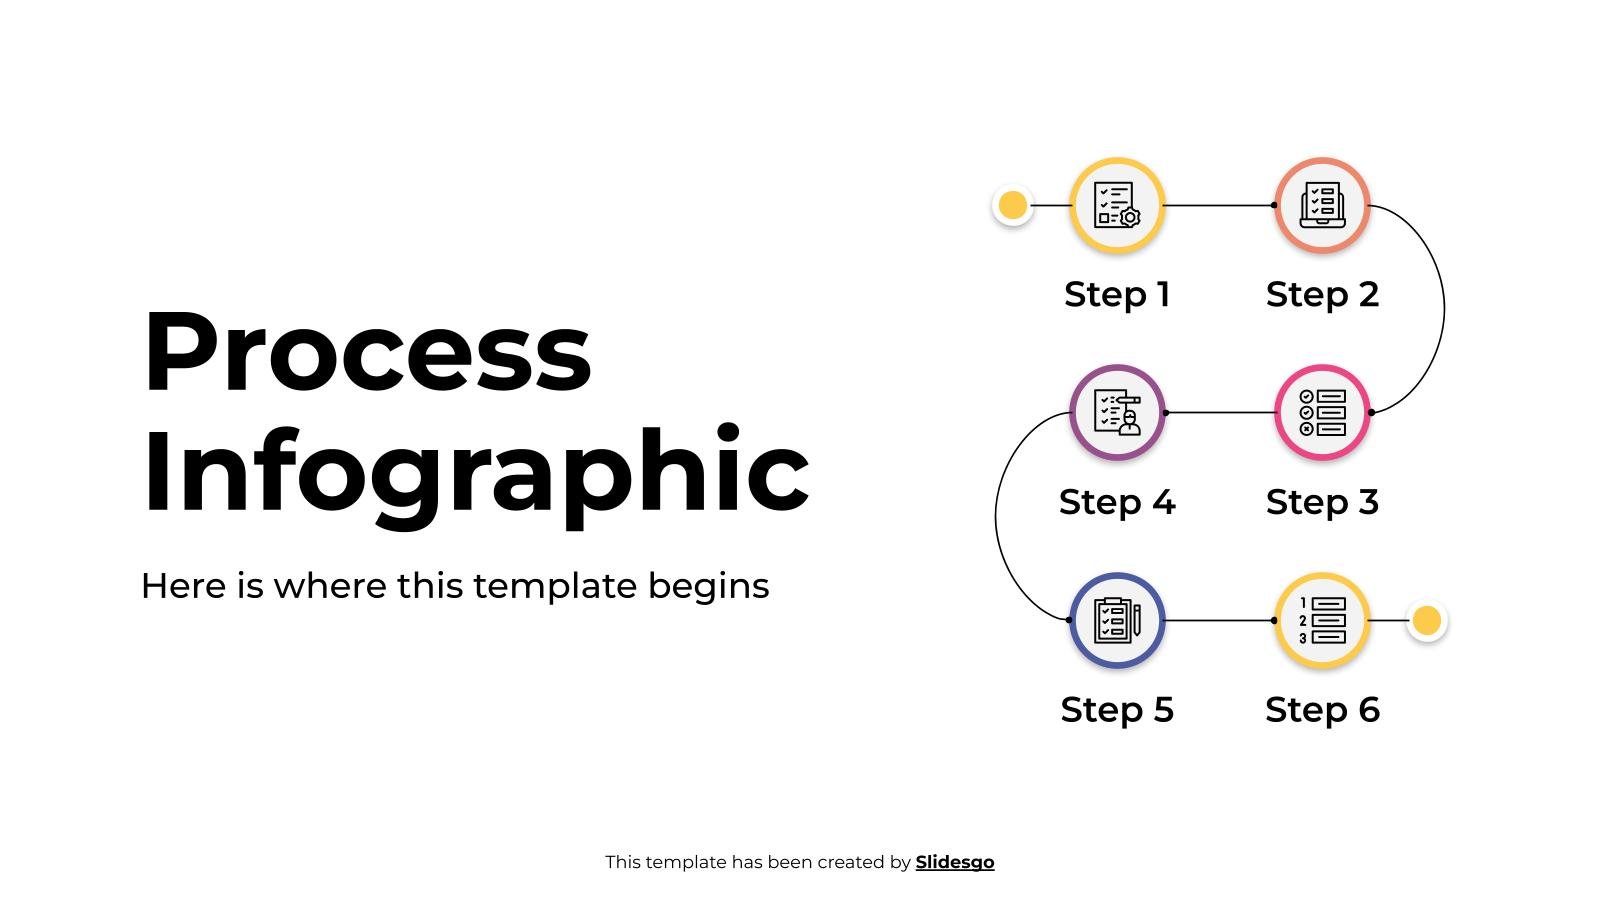
Bloom's Taxonomy Infographics
Free template
In education, most of the curricula developed for students take Bloom's taxonomy as a basis. This taxonomy classifies learning objectives according to complexity and divides them into three domains: cognitive, affective and psychomotor. The taxonomy has been revised since its inception, so how about you bring this concept up during a speech and use these infographics to illustrate this concept and explain what these levels of complexity are?
Features of these infographics
- 100% editable and easy to modify
- 31 different infographics to boost your presentations
- Include icons and Flaticon’s extension for further customization
- Designed to be used in Google Slides, Canva, and Microsoft PowerPoint and Keynote
- 16:9 widescreen format suitable for all types of screens
- Include information about how to edit and customize your infographics
- Learn more in How to use this template?
Ads

Register for free and start downloading now
Register on our website to download 3 FREE templates every month, or GO Premium for unlimited downloads!
Related templates
/
Like
Download
/
Like
Download

/
Like
Download

/
Like
Download
/
Like
Download
/
Like
Download

/
Like
Download
/
Like
Download
/
Like
Download

/
Like
Download

/
Like
Download

/
Like
Download

/
Like
Download

/
Like
Download

/
Like
Download
Popular templates
/
Like
Download
Generate content with AI

/
Like
Download
Generate content with AI
/
Like
Download
Generate content with AI

/
Like
Download
Generate content with AI
/
Like
Download

/
Like
Download