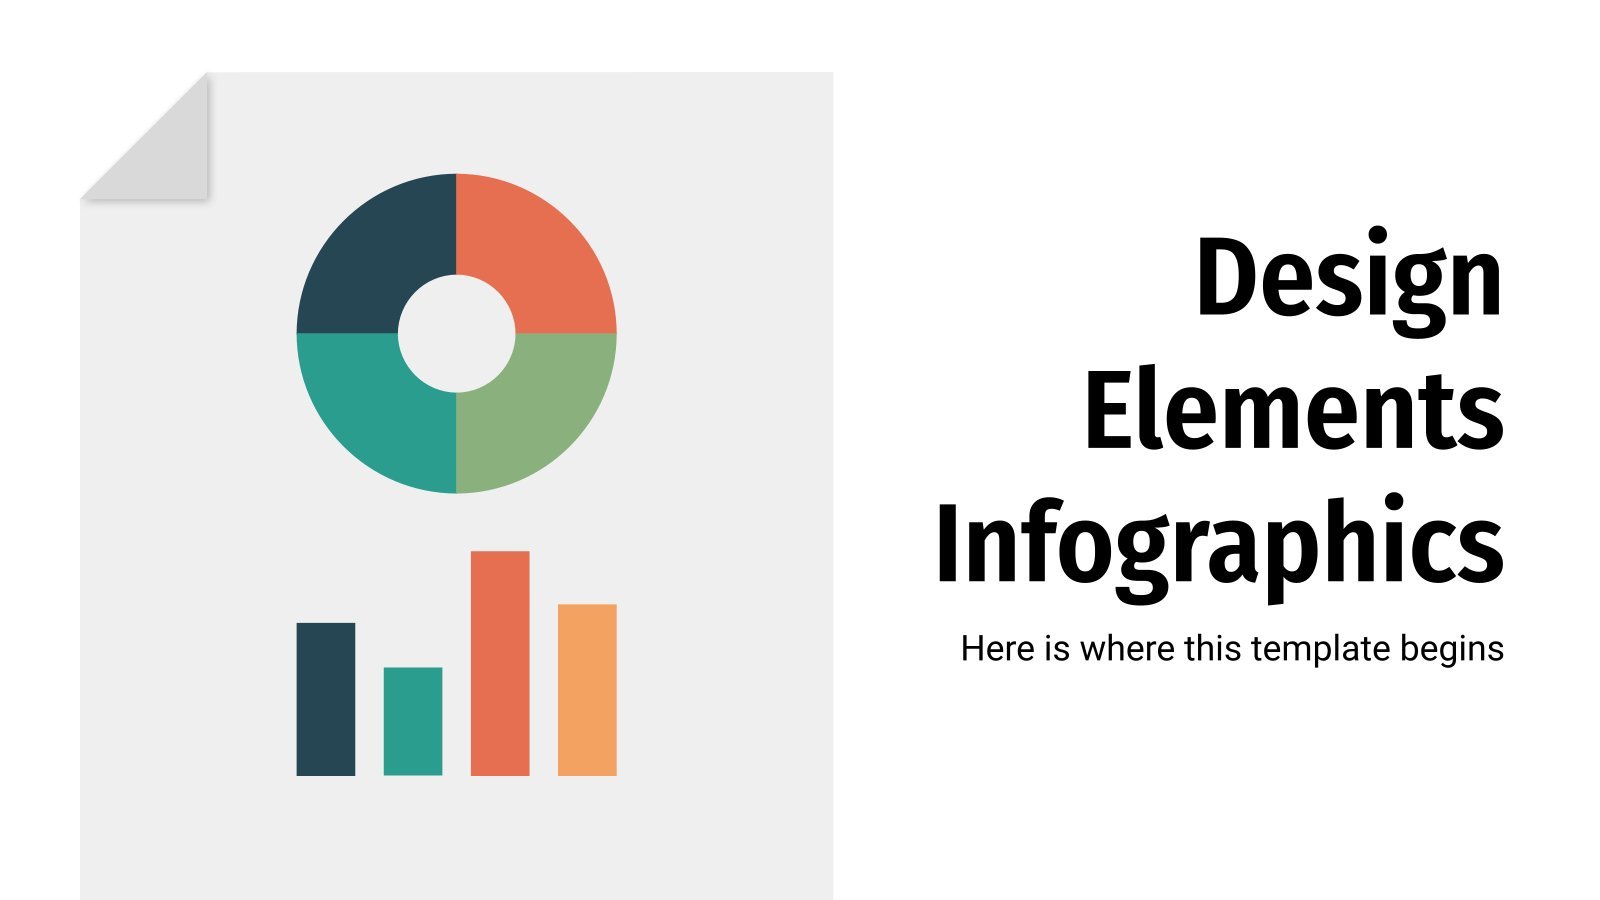
Flat Infographics Presentation templates
The flat graphic style is appealing, quite colorful and helps simplify your data in a visual manner. Adapt these infographics for your presentations and let the bright tones do the work!

It seems that you like this template!

Register for free and start downloading now
This new set of infographics is a jack of all trades. We have created different designs, not tied to a specific topic or purpose, which means they're suitable for the majority of the uses you might come up with. From timelines to graphs, from percentage bars to pie charts. Various...

The best way to order events is to use timelines. In this way, you can use in your presentations of any subject one of the 31 timelines that we propose in this template here. Start modifying these infographic resources and make your presentations a total success.

If you use the infographics included this new template and edit them so that you later add them to your medical presentations, you can raise awareness about a disease and help people prevent it. We have created it using the flat style, which means the colors are solid. There are...

Download the Steps Infographics template for PowerPoint or Google Slides to get the most out of infographics. Whether you want to organize your business budget in a table or schematically analyze your sales over the past year, this set of infographic resources will be of great help. Start using infographics...

Spreadsheets are part of everyday business, what if you could give them a twist and make them more visually appealing? With this infographic template you will easily capture the attention of your boss, colleagues and clients. They are made in blue, which conveys serenity, and have different structures so you...

Download the Roadblock Slideshow Infographics template for PowerPoint or Google Slides to get the most out of infographics. Whether you want to organize your business budget in a table or schematically analyze your sales over the past year, this set of infographic resources will be of great help. Start using...

We can’t wait to see your reaction when you open these infographics! We’re sure between you and Slidesgo there’s a lot of chemistry, specially when we offer you so many editable resources with amazing designs. Take a look at these resources for chemists and make speaking about replacement, decomposition or...
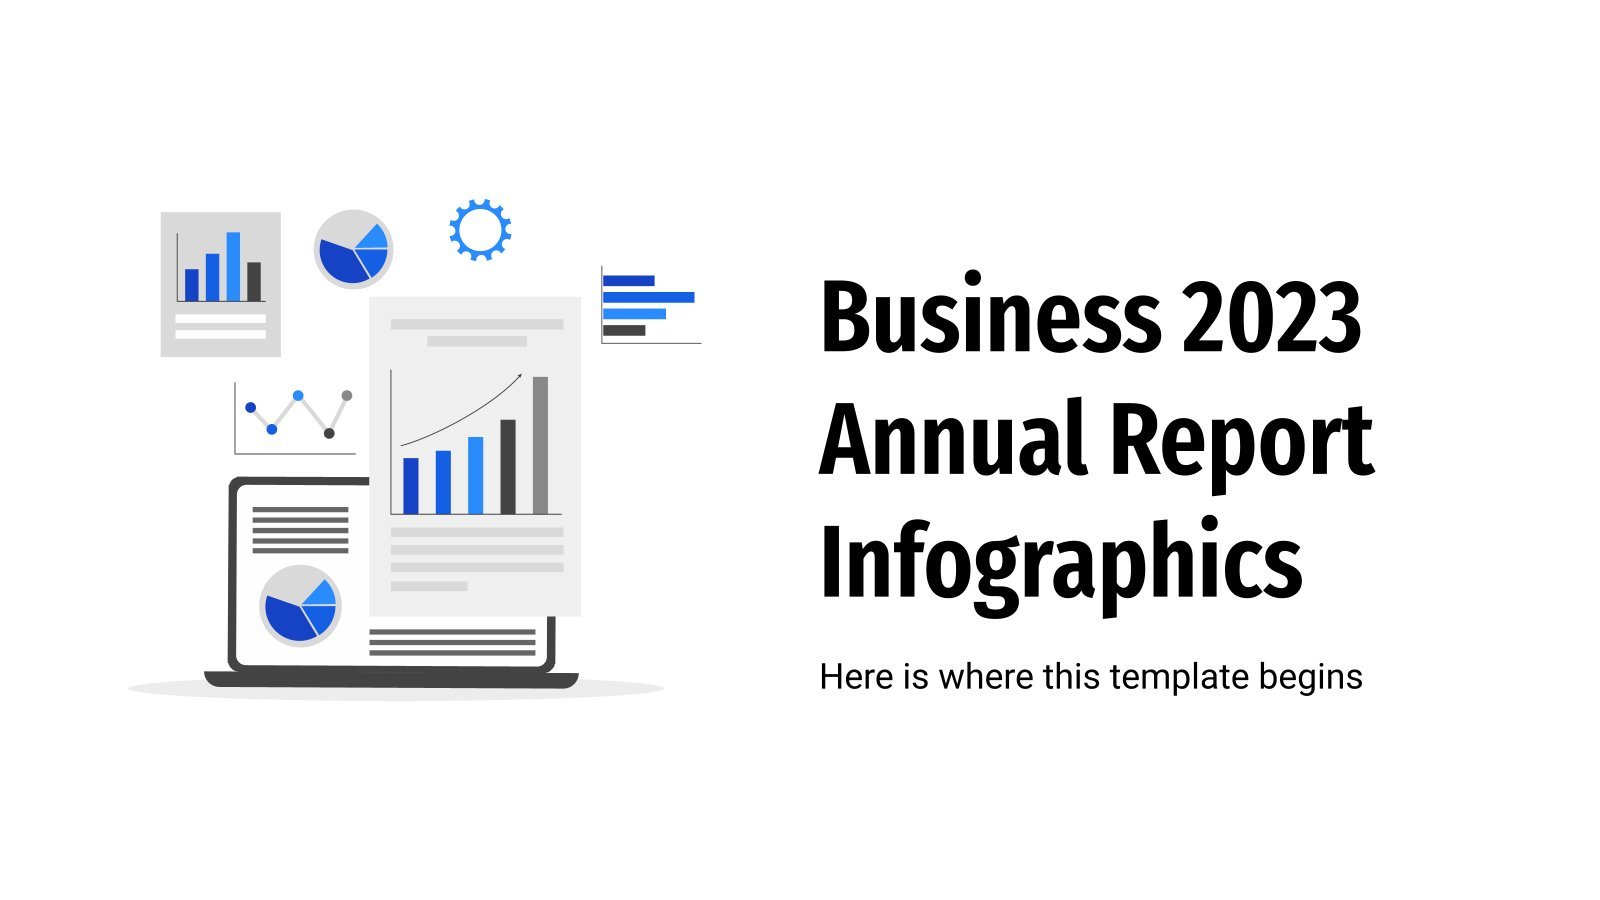
How did you company do during this year? Annalise your spendings, liabilities, earnings, profits, investments, etc. with this set of business infographics made for people who want to increase their productivity! They’re very easy to use and will help your company understand its achievements and its mistakes, to learn from...

Download the Stock Market Infographics template for PowerPoint or Google Slides to get the most out of infographics. Whether you want to organize your business budget in a table or schematically analyze your sales over the past year, this set of infographic resources will be of great help. Start using...
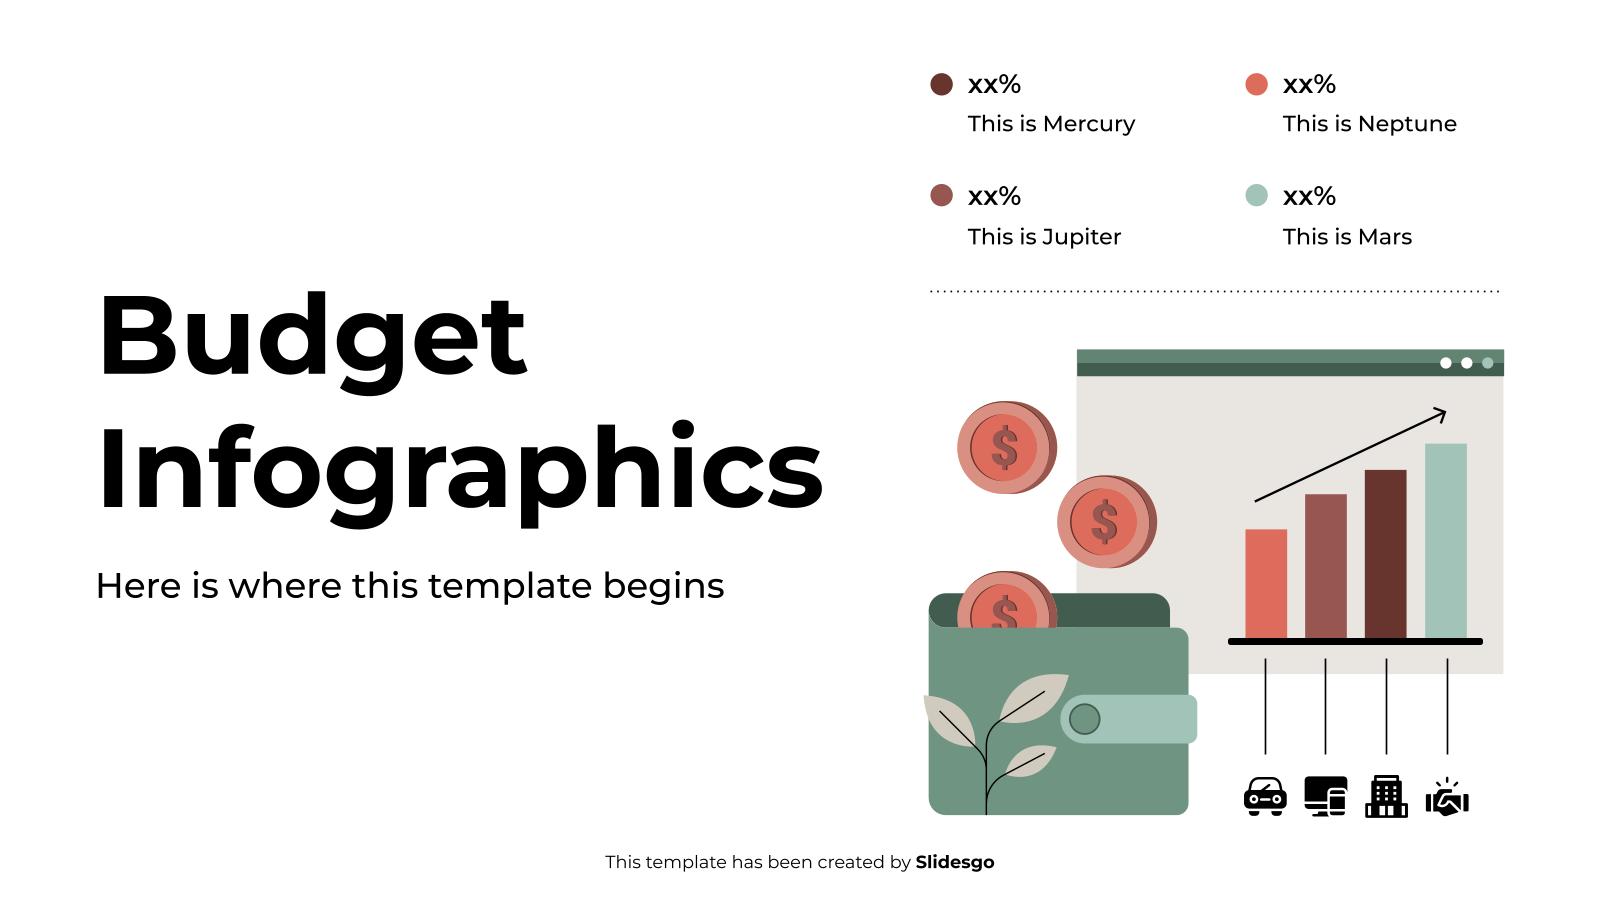
Download the Budget Infographics template for PowerPoint or Google Slides to get the most out of infographics. Whether you want to organize your business budget in a table or schematically analyze your sales over the past year, this set of infographic resources will be of great help. Start using infographics...

Download the Puzzle Infographics template for PowerPoint or Google Slides to get the most out of infographics. Whether you want to organize your business budget in a table or schematically analyze your sales over the past year, this set of infographic resources will be of great help. Start using infographics...

Download the Circular Diagram Infographics template for PowerPoint or Google Slides to get the most out of infographics. Whether you want to organize your business budget in a table or schematically analyze your sales over the past year, this set of infographic resources will be of great help. Start using...

Download the "Creating Infographics" template for PowerPoint or Google Slides and discover the power of infographics. An infographic resource gives you the ability to showcase your content in a more visual way, which will make it easier for your audience to understand your topic. Slidesgo infographics like this set here...

As a project manager, there's much to consider prior to starting work on a new project: your team must understand what it is about, what reasons there are to undertake it, the stakeholders, the key goals, roles and responsibilities... This, in fact, is called "project charter" in business lingo, and...

Download the Business Diagram Infographics template for PowerPoint or Google Slides to get the most out of infographics. Whether you want to organize your business budget in a table or schematically analyze your sales over the past year, this set of infographic resources will be of great help. Start using...
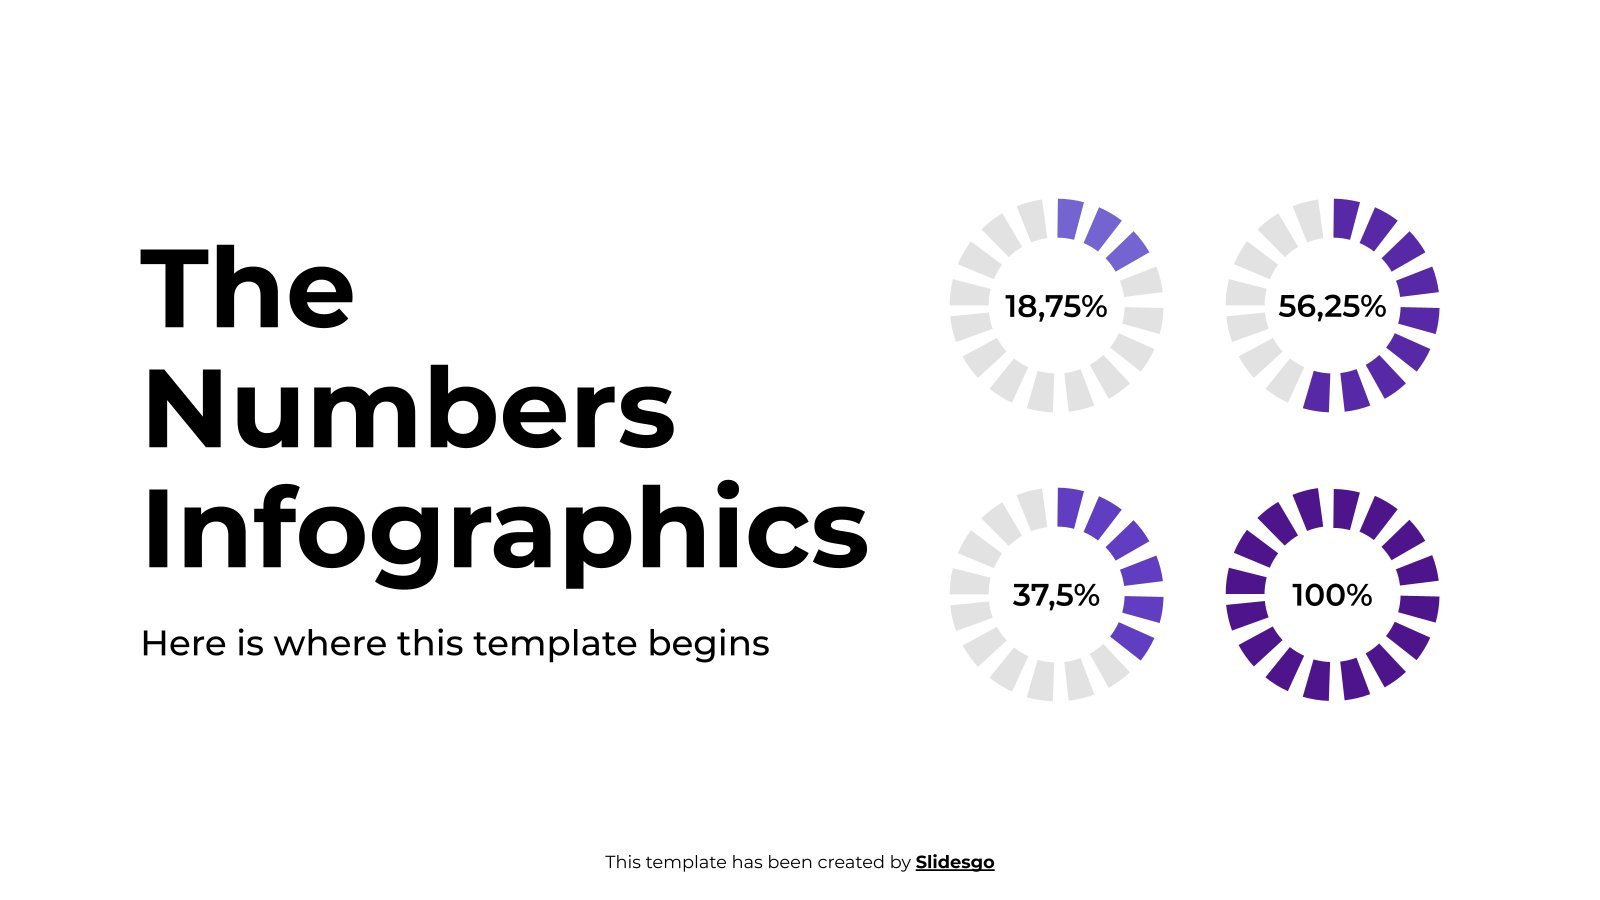
Download the "By The Numbers Infographics" template for PowerPoint or Google Slides and discover the power of infographics. An infographic resource gives you the ability to showcase your content in a more visual way, which will make it easier for your audience to understand your topic. Slidesgo infographics like this...
Download the "Education Infographics" template for PowerPoint or Google Slides and discover this set of editable infographics for education presentations. These resources, from graphs to tables, can be combined with other presentations or used independently. The most important thing is what you will achieve: transmit information in an orderly and...

Download the Risk Management Infographics template for PowerPoint or Google Slides to get the most out of infographics. Whether you want to organize your business budget in a table or schematically analyze your sales over the past year, this set of infographic resources will be of great help. Start using...