Statistics Presentation templates
Everyone uses percentages to make their statements sound more credible; 74% of the population knows that! These Google Slides themes and PowerPoint templates will allow you to talk or teach about statistics, the branch of math that concerns data collection, interpretation and representation.


It seems that you like this template!

Register for free and start downloading now
Download the HS Electives: Sociology Subject for High School - 9th Grade: Concepts in Probability and Statistics Infographics template for PowerPoint or Google Slides and discover the power of infographics. An infographic resource gives you the ability to showcase your content in a more visual way, which will make it...


Download the "Data Infographics" template for PowerPoint or Google Slides and discover the power of infographics. An infographic resource gives you the ability to showcase your content in a more visual way, which will make it easier for your audience to understand your topic. Slidesgo infographics like this set here...

Go ahead and include some statistics and the results of a campaign or a sales program by customizing these clean-cut infographics. We’ve got timelines, processes, steps, Gantt diagrams, maps and tons of percentages. Even some of the designs simulate a 3D effect. Understanding numeric data couldn’t be easier than this!


Percentages, gauges, graphs... statistics! Numbers, when shown in a clear way, convey a lot at a glance. Our new set of infographics is completely editable and contains all of the aforementioned things, but in a doodle style! This means the different shapes appear as if they were drawn with a...


Download the Data Infographics template for PowerPoint or Google Slides to get the most out of infographics. Whether you want to organize your business budget in a table or schematically analyze your sales over the past year, this set of infographic resources will be of great help. Start using infographics...

Do you need different sorts of charts to present your data? If you are a researcher, entrepreneur, marketeer, student, teacher or physician, these data infographics will help you a lot!

Introducing the new set of bright purple infographics that's here to help you up your data analysis presentation game! These infographics offer a visually comprehensible way to package your analysis results that can be easily grasped by everyone in your audience. With fully editable extra resources, you can customize each...
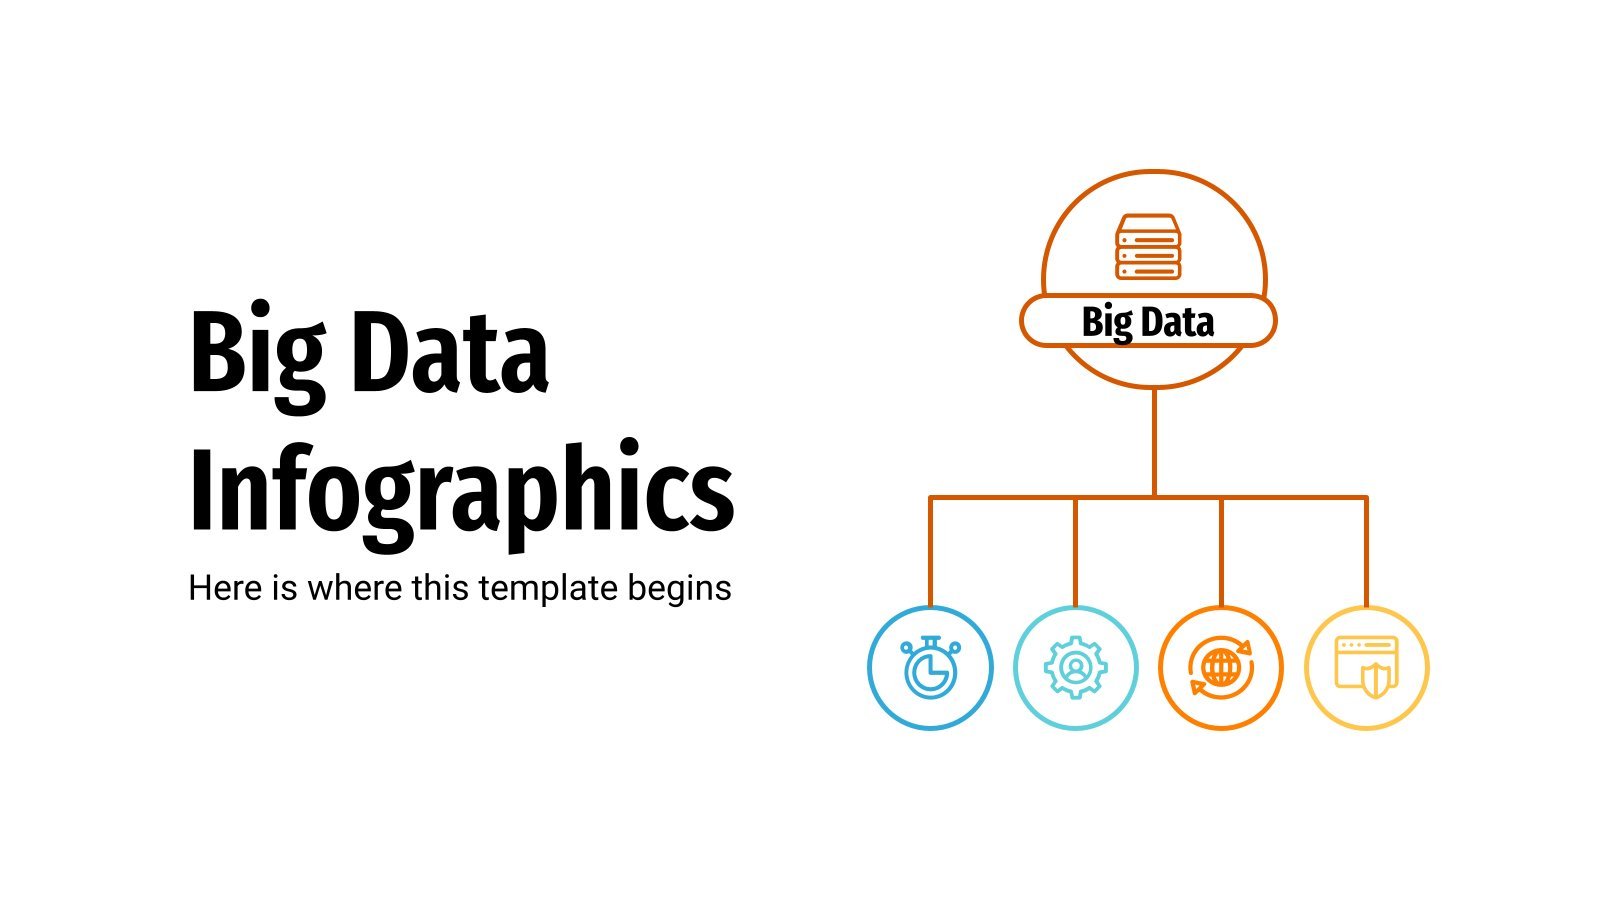

Explore and analyse large amounts of information thanks to these Big Data infographics. Create new commercial services, use them for marketing purposes or for research, no matter the topic. We have added charts, reports, gears, pie charts, text blocks, circle and cycle diagrams, pyramids and banners in different styles, such...

Looking back, we remember a template for marketing plans... Its design was organic and focused on wavy shapes. We also remember that, by default, it was white and orange. Yeah, we remember it perfectly, so that's why we've created this set of complementary infographics! Whenever you need to focus everyone's...


Make math lessons more engaging with this creative set of infographics! With infographics and visual resources to explain probability and statistics, your high school students will be hooked! They'll be able to better understand the subject matter with the help of diagrams, charts, and other editable graphics. Plus, the template...


Download the Dashboard Infographics template for PowerPoint or Google Slides and discover the power of infographics. An infographic resource gives you the ability to showcase your content in a more visual way, which will make it easier for your audience to understand your topic. Slidesgo infographics like this set here...


Demographic infographics are useful when you want to share the results of some analyses related to people: percentages related to the age, hobbies, location and the like of a group of people. Use them for business or marketing purposes! We have included maps, pie charts, bar graphs, diagrams of people...


A product, an idea, a project—everything has its pros and cons. Now you can convey this information as visually as possible with these infographics. Each slide has a different amount of elements to compare and a varied color palette to better differentiate them. Most of the designs are flat-styled, but...


Biodata is, to put it simply, information about life, work experience and education of a certain person. Do you think that this can be useful for recruiting processes or when choosing who to order a commission? These infographics are, firstly, totally customizable, and secondly, ideal for showing profiles with biodata....
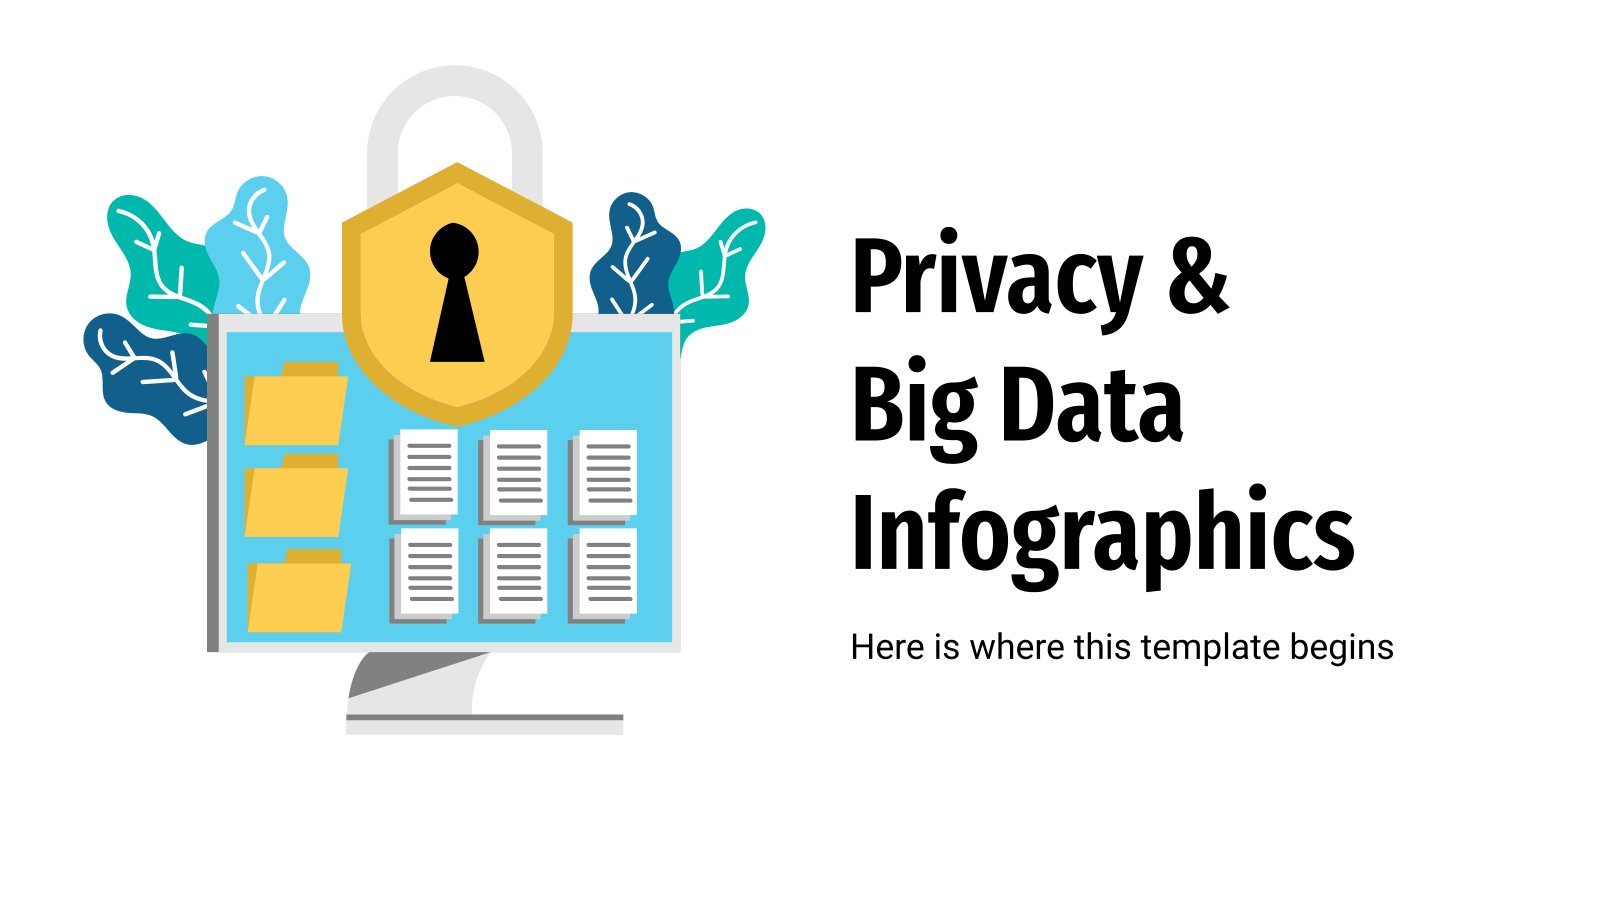

If you know what big data is you might want to also inform yourself about privacy. Some companies collect data from you and you don’t even realize it. Usually it’s just general content, and it’s only used to create trends and profiles that give you fitted advertising, but it’s always...


Download the Statistics Infographics template for PowerPoint or Google Slides to get the most out of infographics. Whether you want to organize your business budget in a table or schematically analyze your sales over the past year, this set of infographic resources will be of great help. Start using infographics...
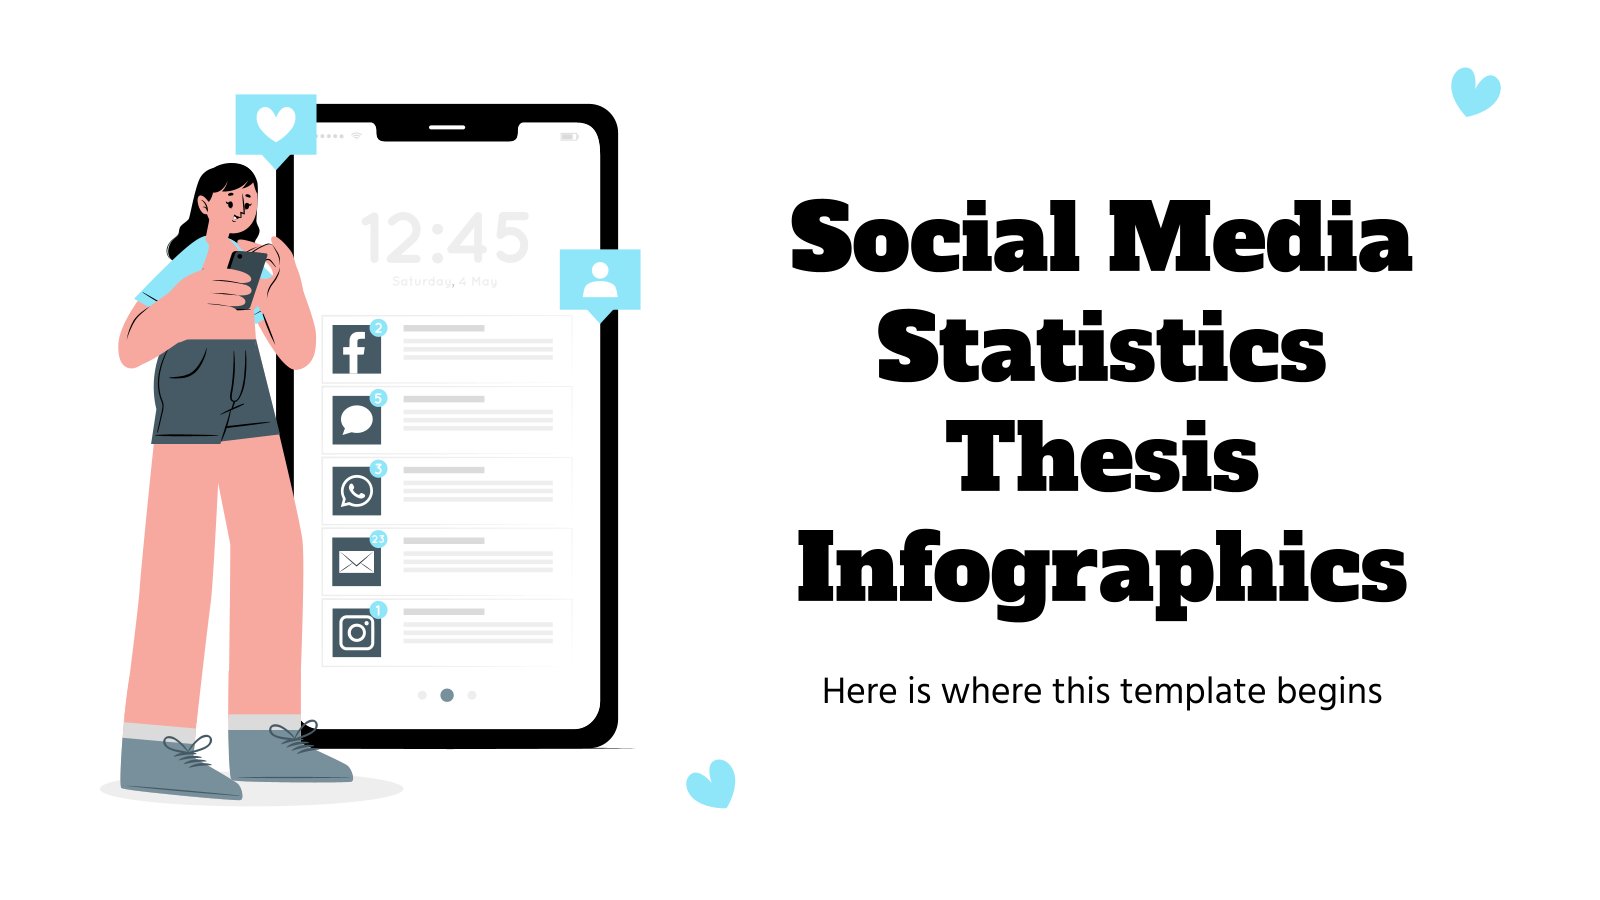

Download the "Social Media Statistics Thesis Infographics" template for PowerPoint or Google Slides and discover the power of infographics. An infographic resource gives you the ability to showcase your content in a more visual way, which will make it easier for your audience to understand your topic. Slidesgo infographics like...


Data privacy plays a key role in our everyday lives and security, it is what stops thieves from stealing our bank data online, our passwords and information, our pictures and music… now imagine this in a bigger scale: banks, companies, governments! They all need an extreme level of data privacy...