Search results for 3d chart
Here you have 90 templates based on your search of 3d chart. Enjoy them!


It seems that you like this template!

Register for free and start downloading now
Download the Dashboard Infographics template for PowerPoint or Google Slides and discover the power of infographics. An infographic resource gives you the ability to showcase your content in a more visual way, which will make it easier for your audience to understand your topic. Slidesgo infographics like this set here...


Download the Circular Infographics template for PowerPoint or Google Slides and discover the power of infographics. An infographic resource gives you the ability to showcase your content in a more visual way, which will make it easier for your audience to understand your topic. Slidesgo infographics like this set here...
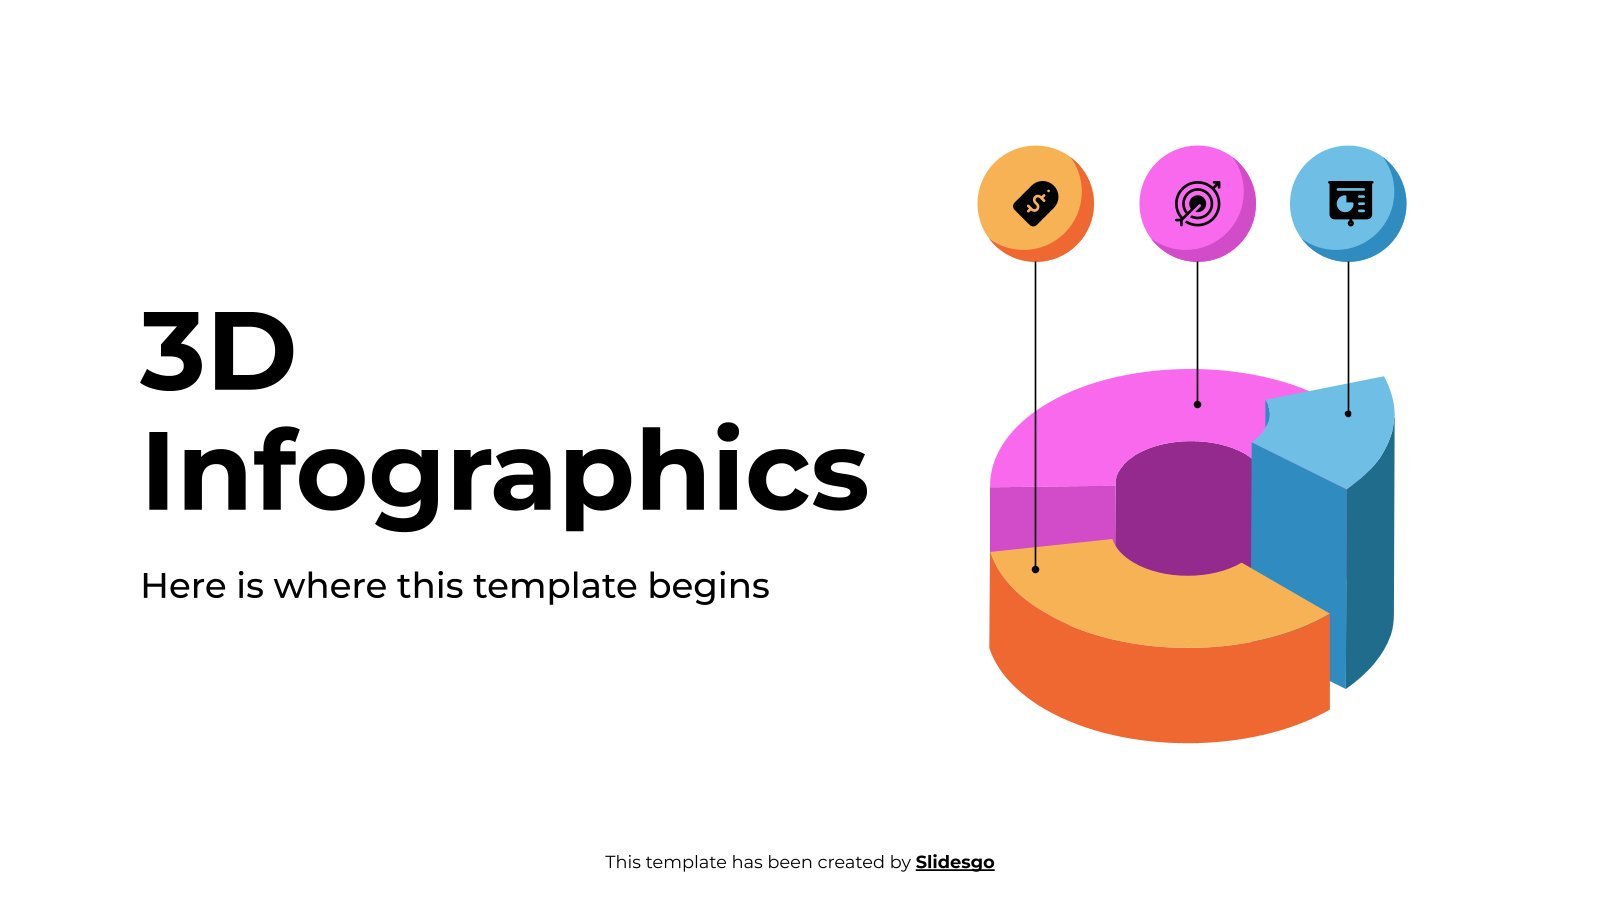

Download the "3D Infographics" template for PowerPoint or Google Slides and discover the power of infographics. An infographic resource gives you the ability to showcase your content in a more visual way, which will make it easier for your audience to understand your topic. Slidesgo infographics like this set here...
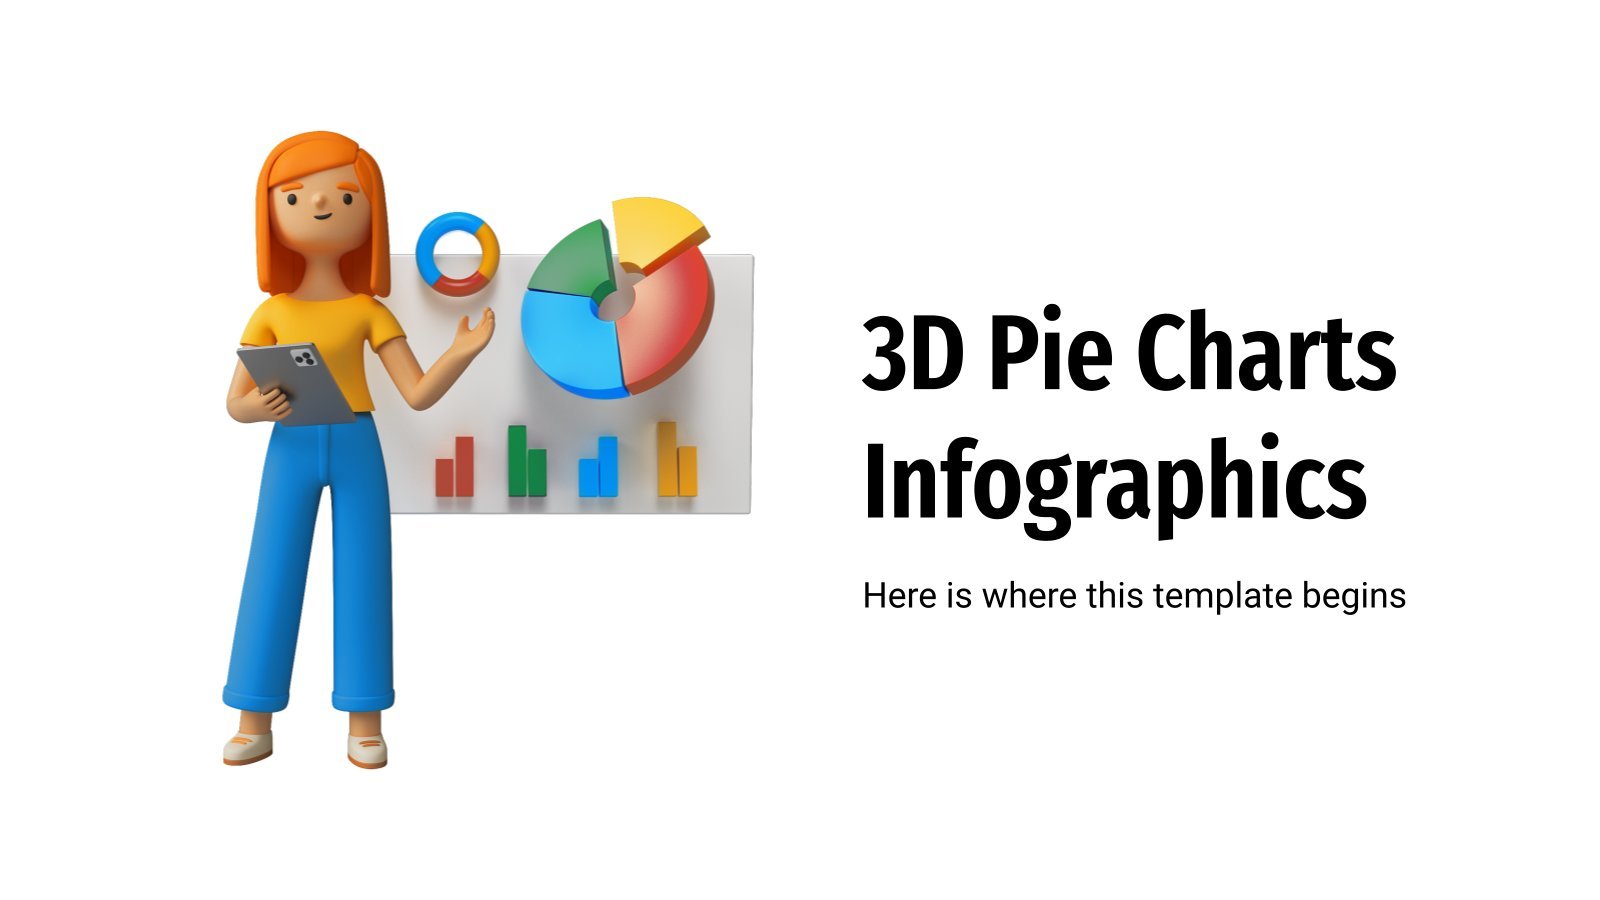

The popularity and clarity of pie charts make them the queen of all graphs! At a glance, you can see the percentage that corresponds to each slice, and if various colors are used too... the better! Slidesgo has this new template for you, which is a collection of around thirty...
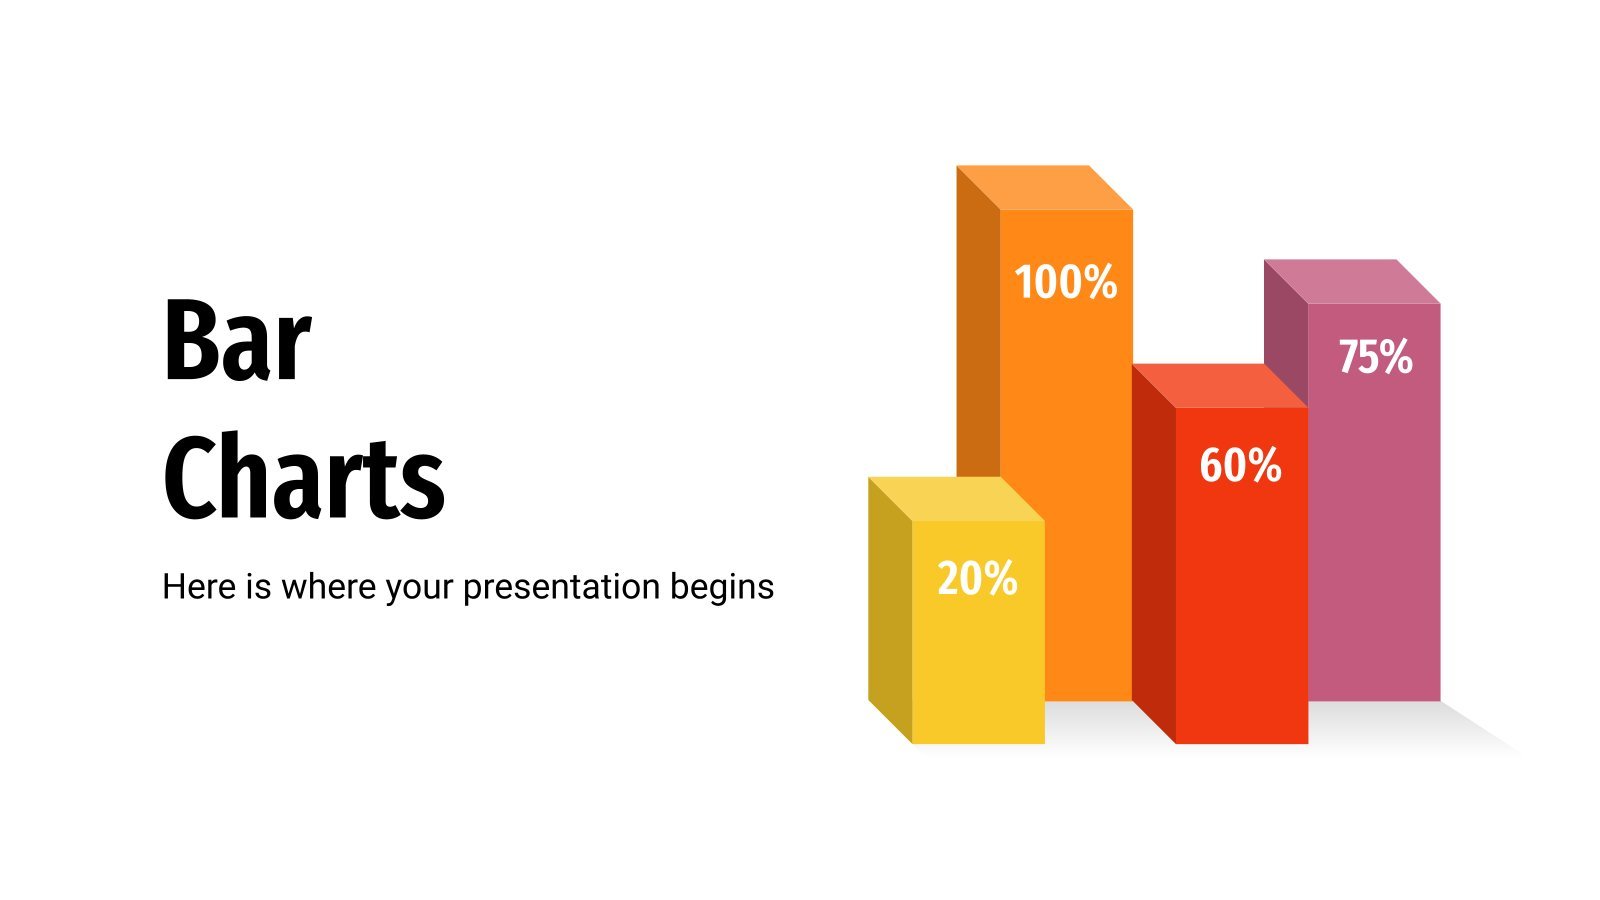

Bar charts are very adaptable. No matter what you want to represent: if you have some numbers, data and percentages, use these diagrams. We have designed many of them for you: simple bars, cylindrical, pyramidal, arrows… Choose one!
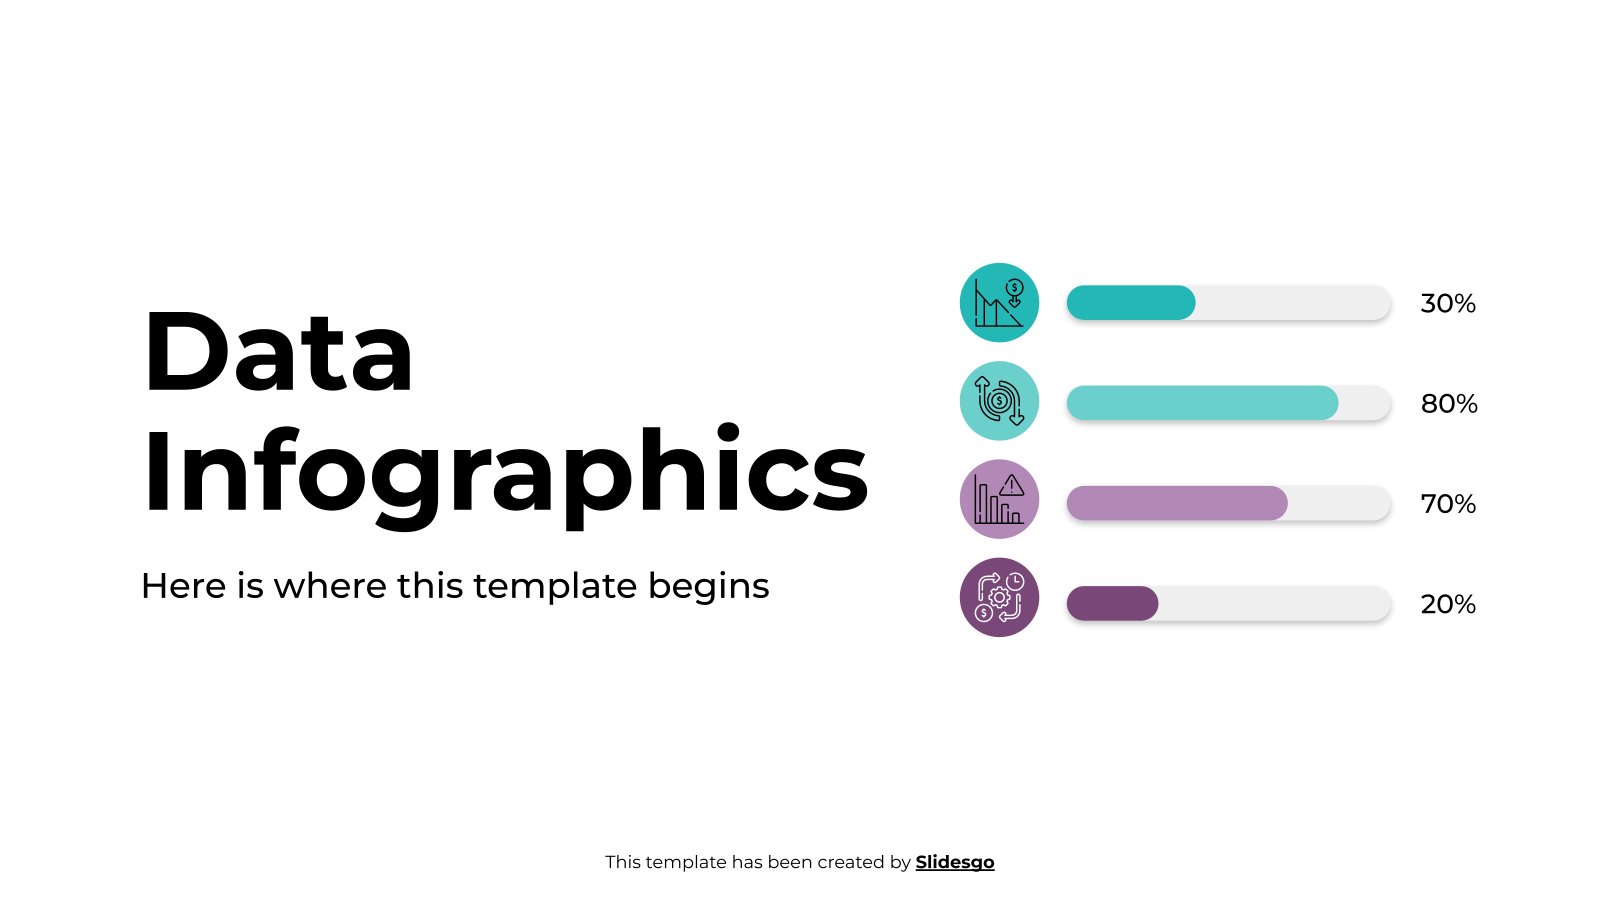

Download the Data Infographics template for PowerPoint or Google Slides to get the most out of infographics. Whether you want to organize your business budget in a table or schematically analyze your sales over the past year, this set of infographic resources will be of great help. Start using infographics...


Download the "Cool and Slick Infographics" template for PowerPoint or Google Slides and discover the power of infographics. An infographic resource gives you the ability to showcase your content in a more visual way, which will make it easier for your audience to understand your topic. Slidesgo infographics like this...
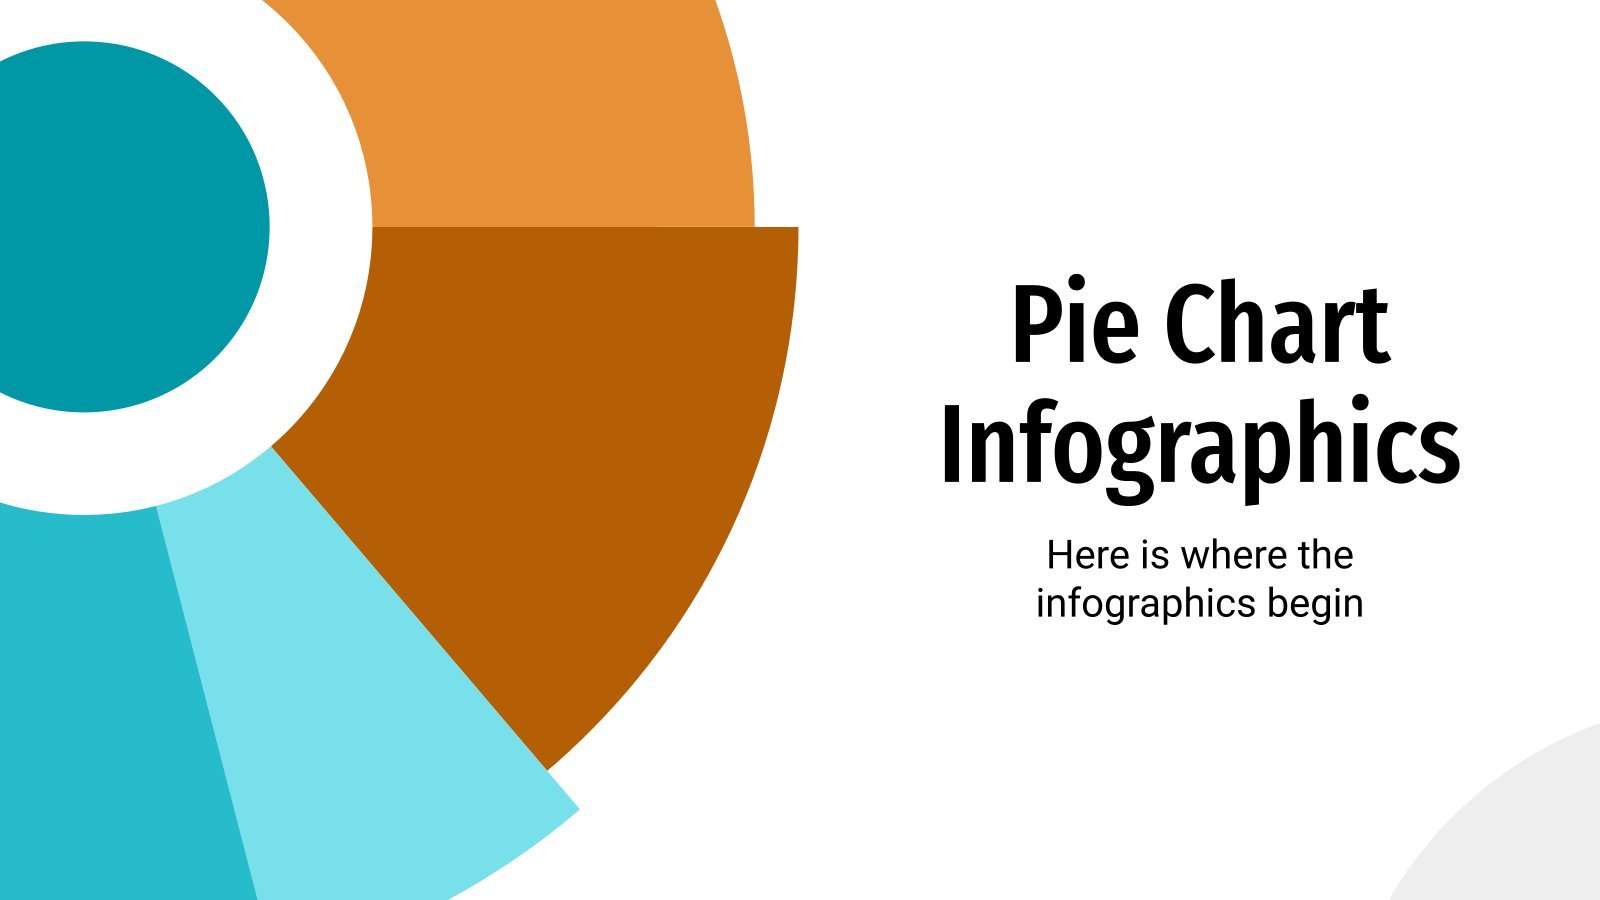

Pie charts are powerful visual tools, and you can use them to represent and compare percentages or proportions. They are useful when presenting data about your company, when describing your buyer persona, or even for medical or educational topics. They look like pies or even donuts, and each element represents...
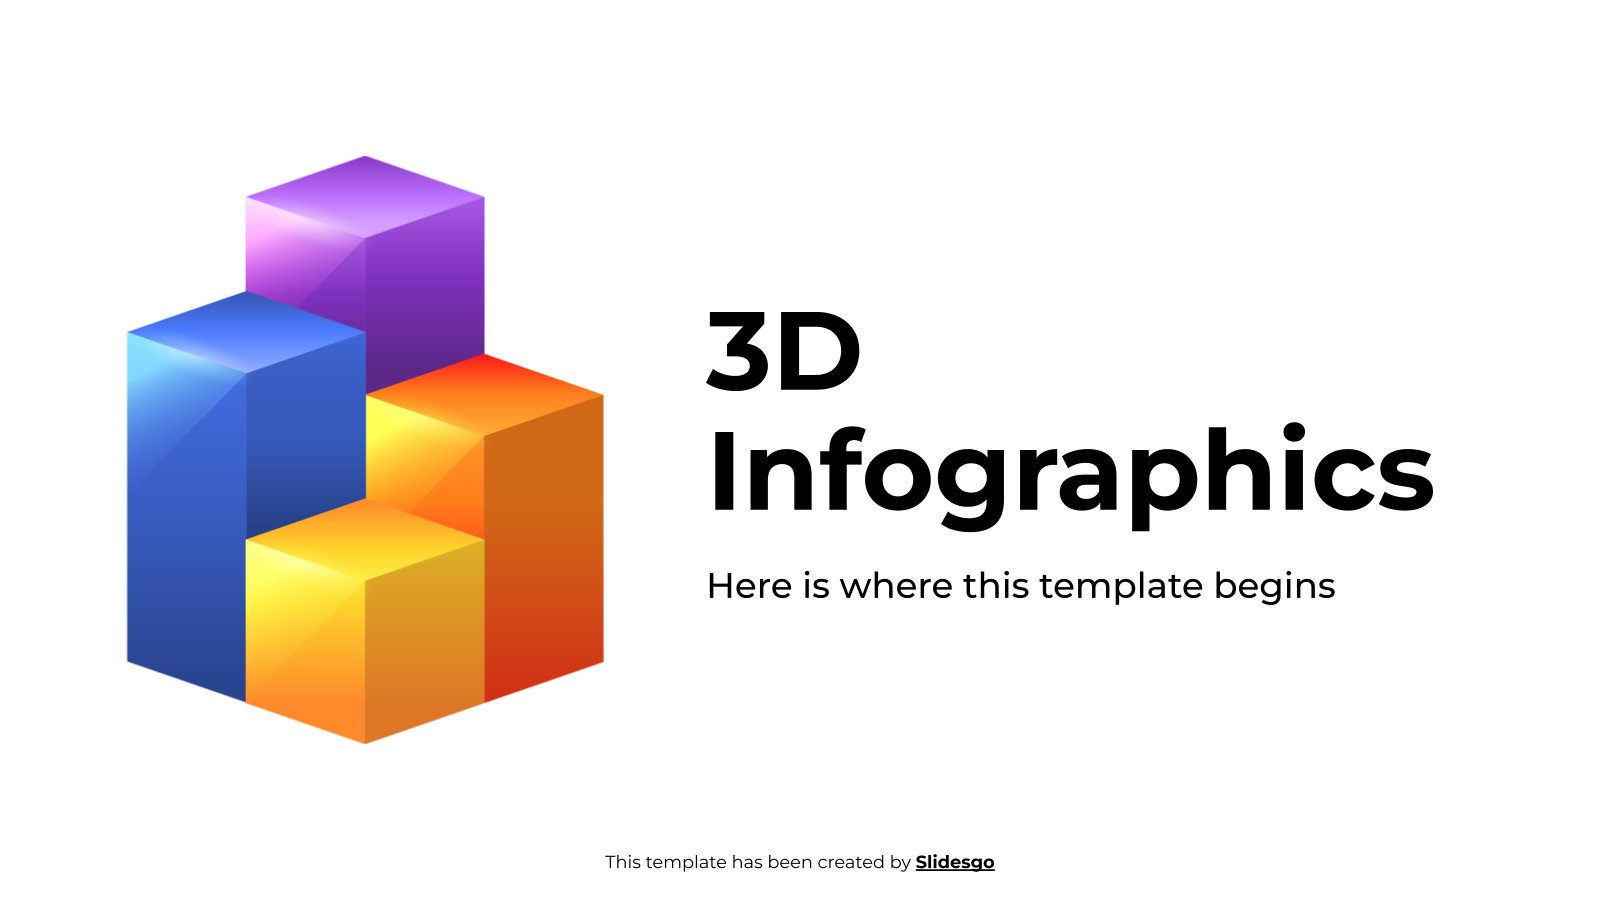

Download the "3D Infographics" template for PowerPoint or Google Slides and discover the power of infographics. An infographic resource gives you the ability to showcase your content in a more visual way, which will make it easier for your audience to understand your topic. Slidesgo infographics like this set here...
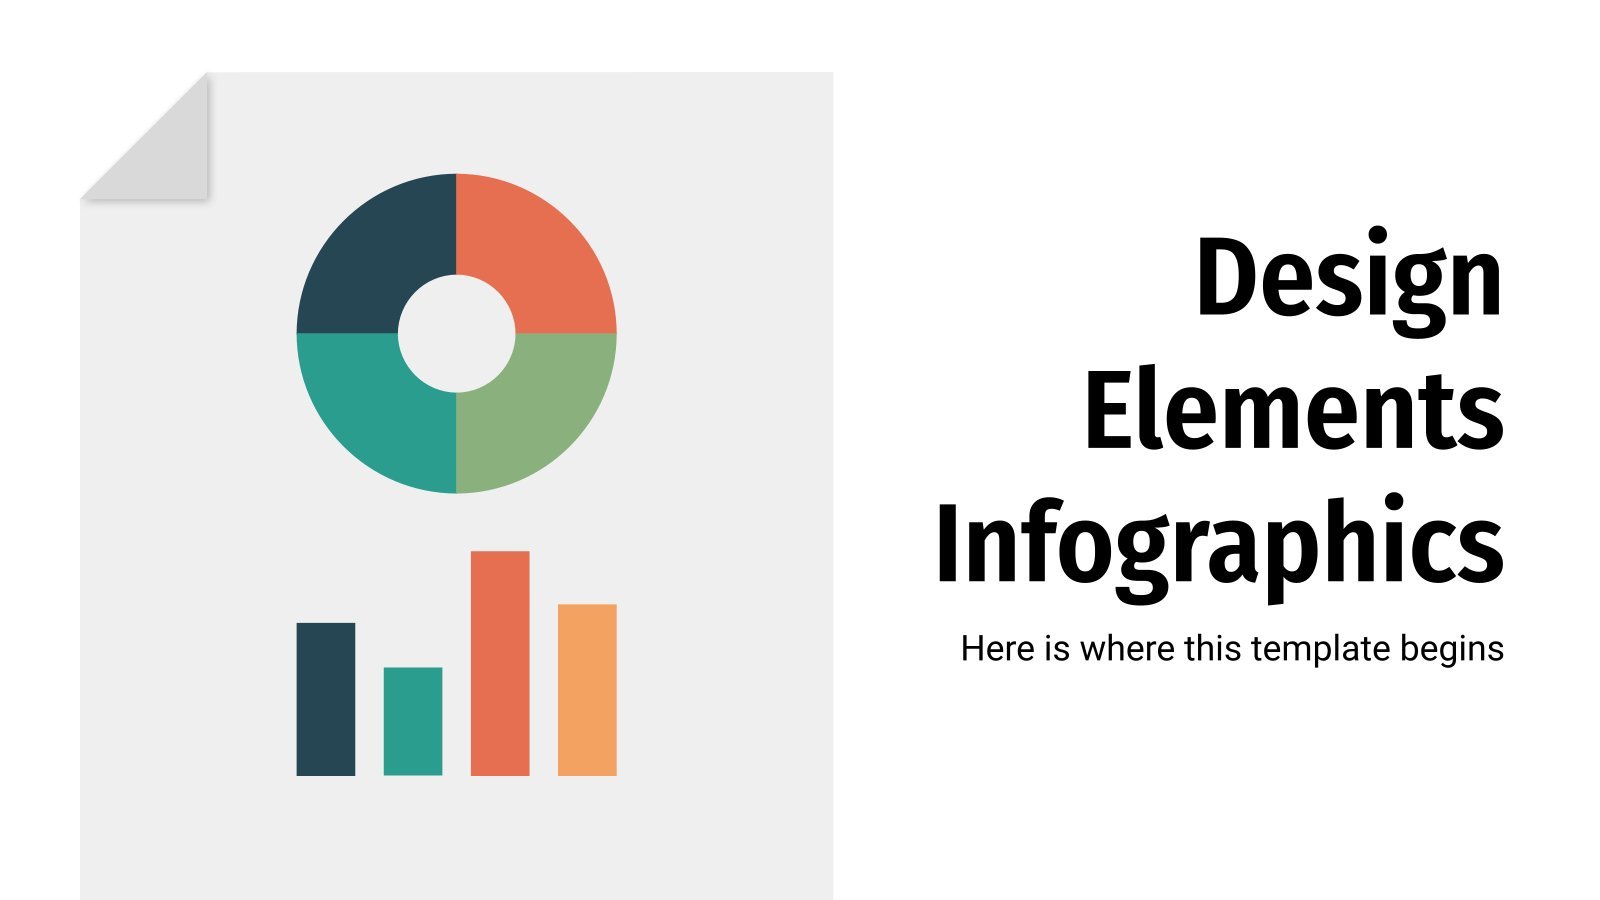

This new set of infographics is a jack of all trades. We have created different designs, not tied to a specific topic or purpose, which means they're suitable for the majority of the uses you might come up with. From timelines to graphs, from percentage bars to pie charts. Various...
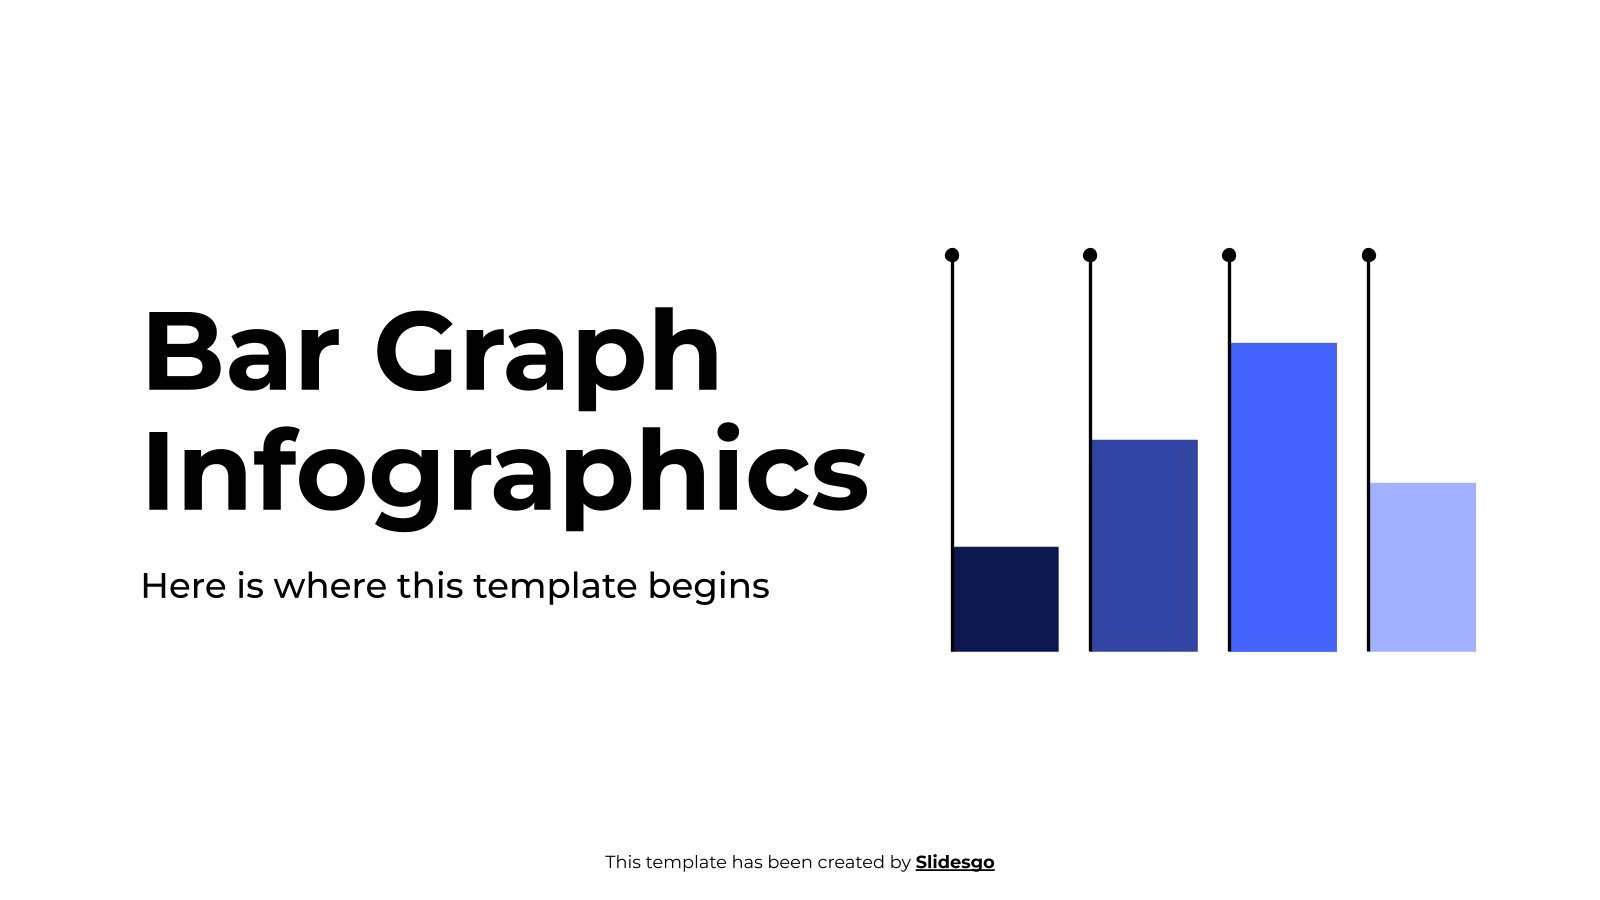

Download the "Bar Graph Infographics" template for PowerPoint or Google Slides and discover the power of infographics. An infographic resource gives you the ability to showcase your content in a more visual way, which will make it easier for your audience to understand your topic. Slidesgo infographics like this set...
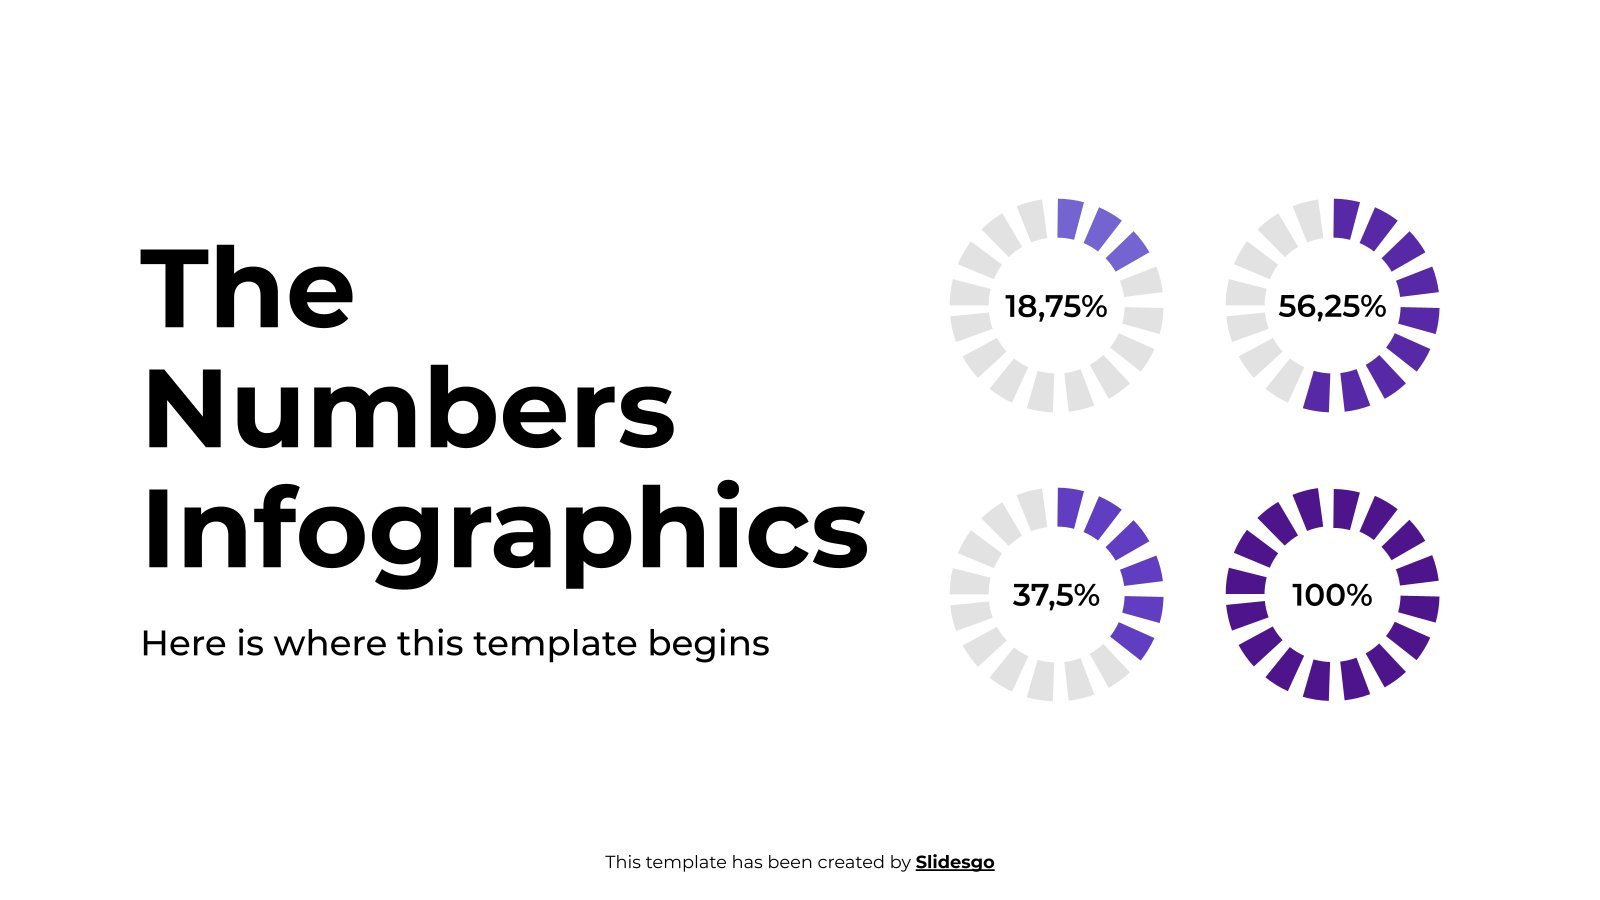

Download the "By The Numbers Infographics" template for PowerPoint or Google Slides and discover the power of infographics. An infographic resource gives you the ability to showcase your content in a more visual way, which will make it easier for your audience to understand your topic. Slidesgo infographics like this...


Spreadsheets are part of everyday business, what if you could give them a twist and make them more visually appealing? With this infographic template you will easily capture the attention of your boss, colleagues and clients. They are made in blue, which conveys serenity, and have different structures so you...


Download the Graph Infographics template for PowerPoint or Google Slides and discover the power of infographics. An infographic resource gives you the ability to showcase your content in a more visual way, which will make it easier for your audience to understand your topic. Slidesgo infographics like this set here...
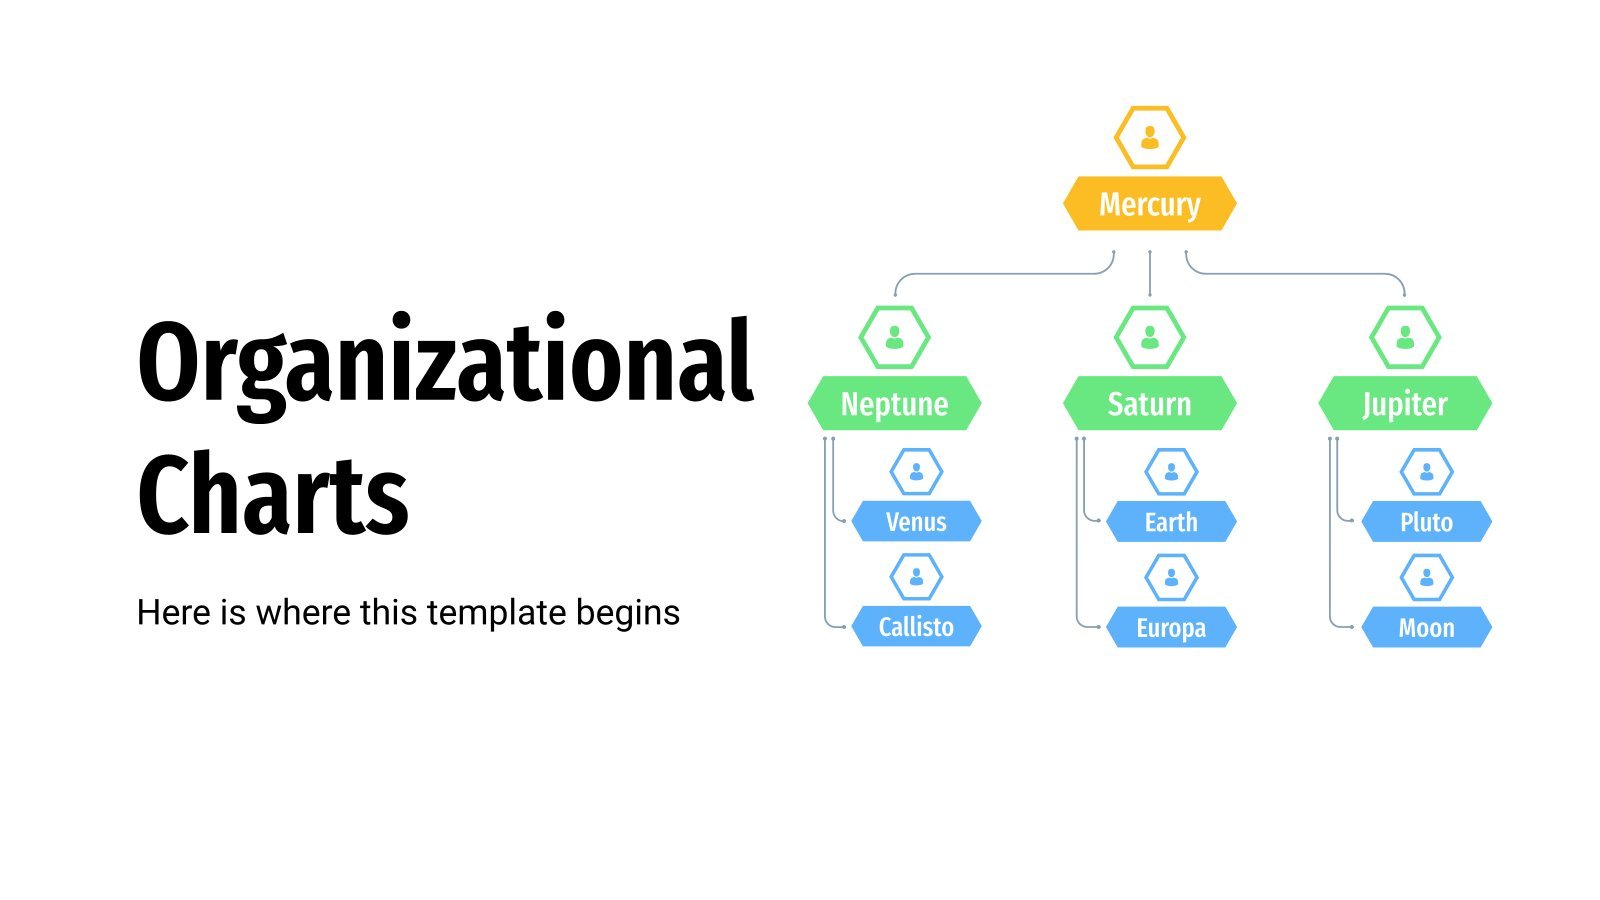

Organizational Charts, also known as organigrams or organograms, present the ranks and relationships within a company or its structure. They typically have three to four levels.


All these charts serve one purpose: help your audience visualize statistics about the population. Whether you've conducted a market research, or you want to show some opinion polls or voting intention, you'll be able to do so with our colorful designs. Choose your preferred style among flat, fill or linear,...
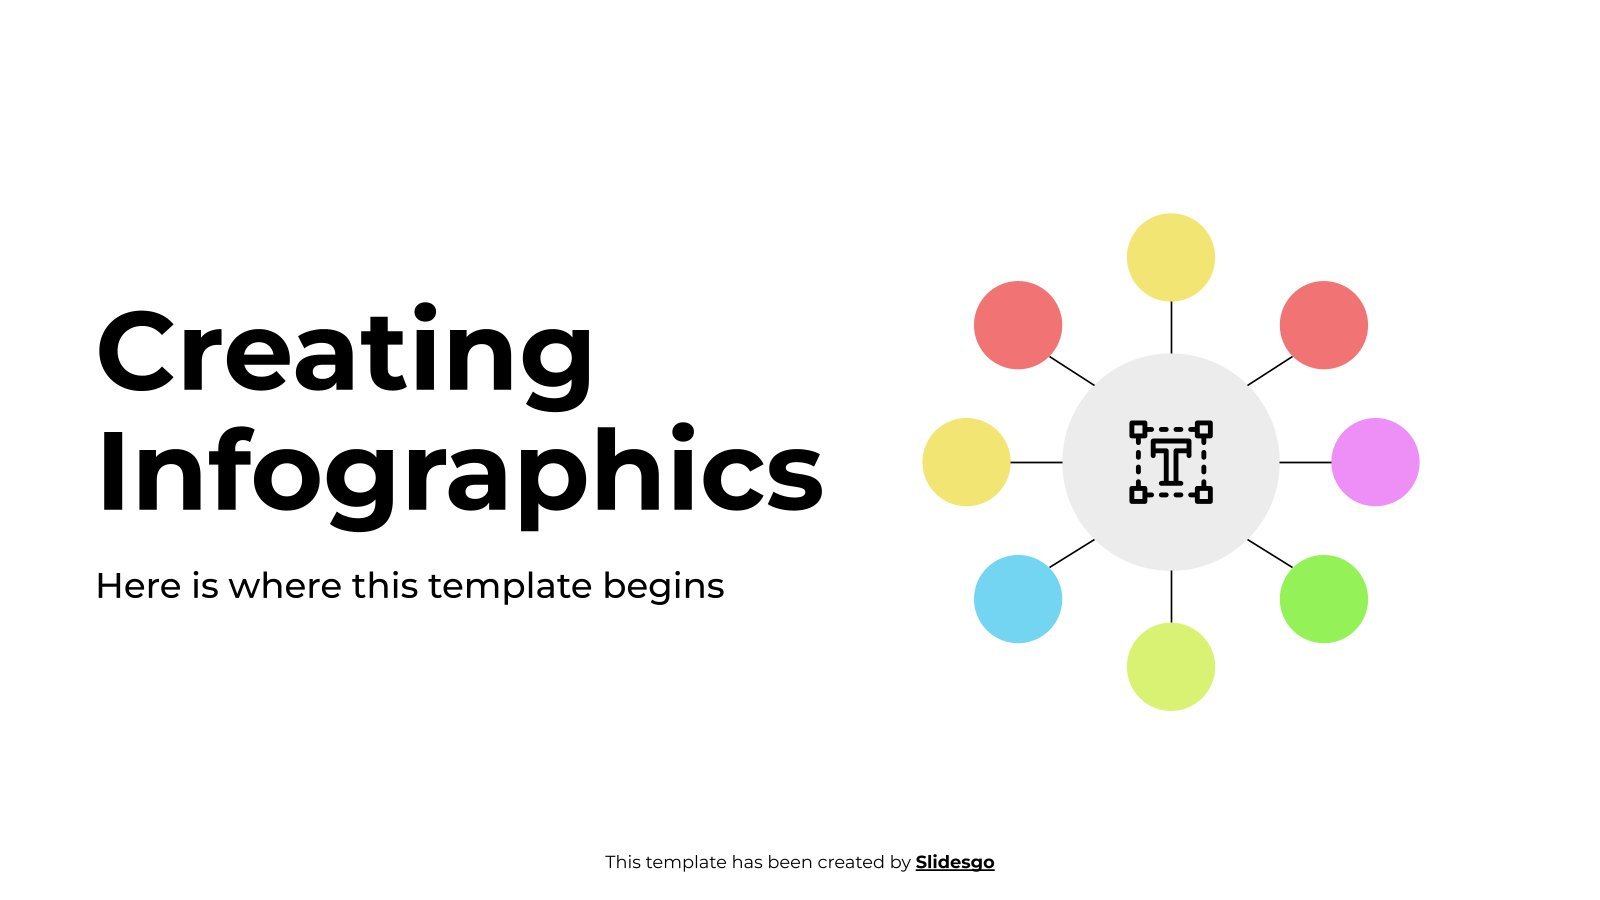

Download the "Creating Infographics" template for PowerPoint or Google Slides and discover the power of infographics. An infographic resource gives you the ability to showcase your content in a more visual way, which will make it easier for your audience to understand your topic. Slidesgo infographics like this set here...

Download the "name" template for PowerPoint or Google Slides to get the most out of infographics. Whether you want to organize your business budget in a table or schematically analyze your sales over the past year, this set of infographic resources will be of great help. Start using infographics now...