Process Infographics Presentation templates - Page 5
Is there a process whose steps you need to talk about in front of an audience? Add these infographics to your slides and let them be a visual support for your lecture.


It seems that you like this template!

Register for free and start downloading now
Download the Workflows Infographics template for PowerPoint or Google Slides and discover the power of infographics. An infographic resource gives you the ability to showcase your content in a more visual way, which will make it easier for your audience to understand your topic. Slidesgo infographics like this set here...

Download the Project Timeline Infographics template for PowerPoint or Google Slides to get the most out of infographics. Whether you want to organize your business budget in a table or schematically analyze your sales over the past year, this set of infographic resources will be of great help. Start using...
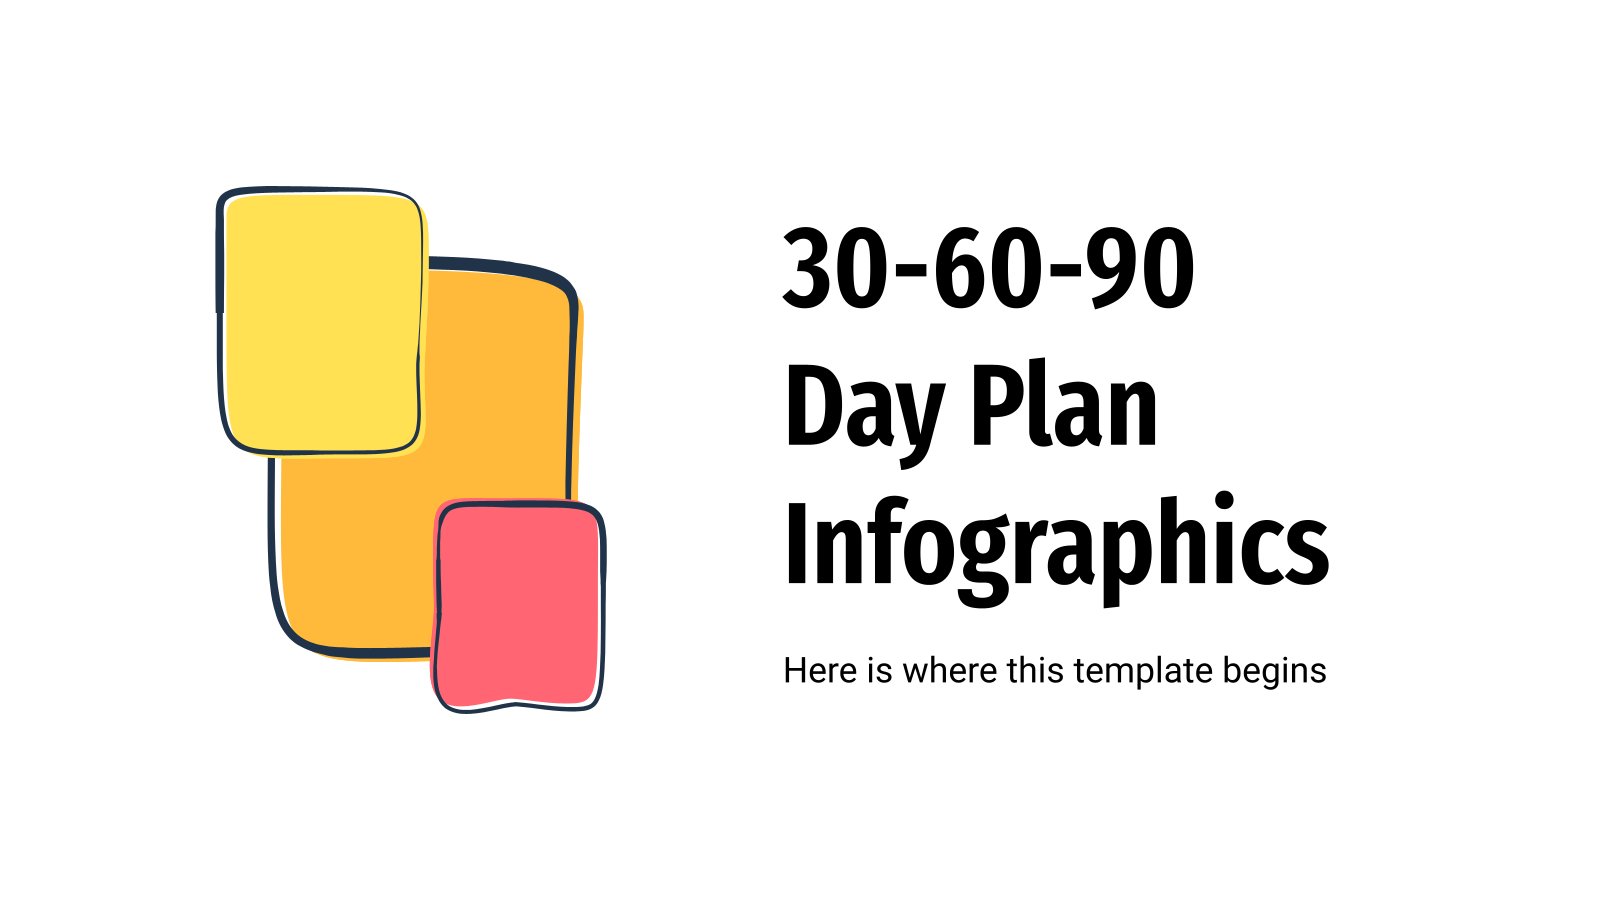
Are you looking for a way to represent a 30-, 60- or a 90-day process in a visual manner so it is understandable for your audience? We're bringing you some flat, semi-flat and doodle-like designs depicting different types of infographics. Arrows, tables and other extra resources are also provided for...

Sometimes, you feel the need of having a little bit of elegance when representing data visually. Or perhaps you just want to try something different. In any case, our set of infographics will be of help! They have been designed using ribbons as the main element, so you can use...

Download the Cycle Diagrams Infographics template for PowerPoint or Google Slides to get the most out of infographics. Whether you want to organize your business budget in a table or schematically analyze your sales over the past year, this set of infographic resources will be of great help. Start using...

These infographics will get your content moving! That’s right, they are all animated and will make you speak about different processes or timelines an easy task. Don’t hesitate to download them and edit them, time flies, and so do these creative designs full of color and creativity! In the template...

Download the "name" template for PowerPoint or Google Slides and discover the power of infographics. An infographic resource gives you the ability to showcase your content in a more visual way, which will make it easier for your audience to understand your topic. Slidesgo infographics like this set here are...

Download the Comparison Infographics template for PowerPoint or Google Slides to get the most out of infographics. Whether you want to organize your business budget in a table or schematically analyze your sales over the past year, this set of infographic resources will be of great help. Start using infographics...
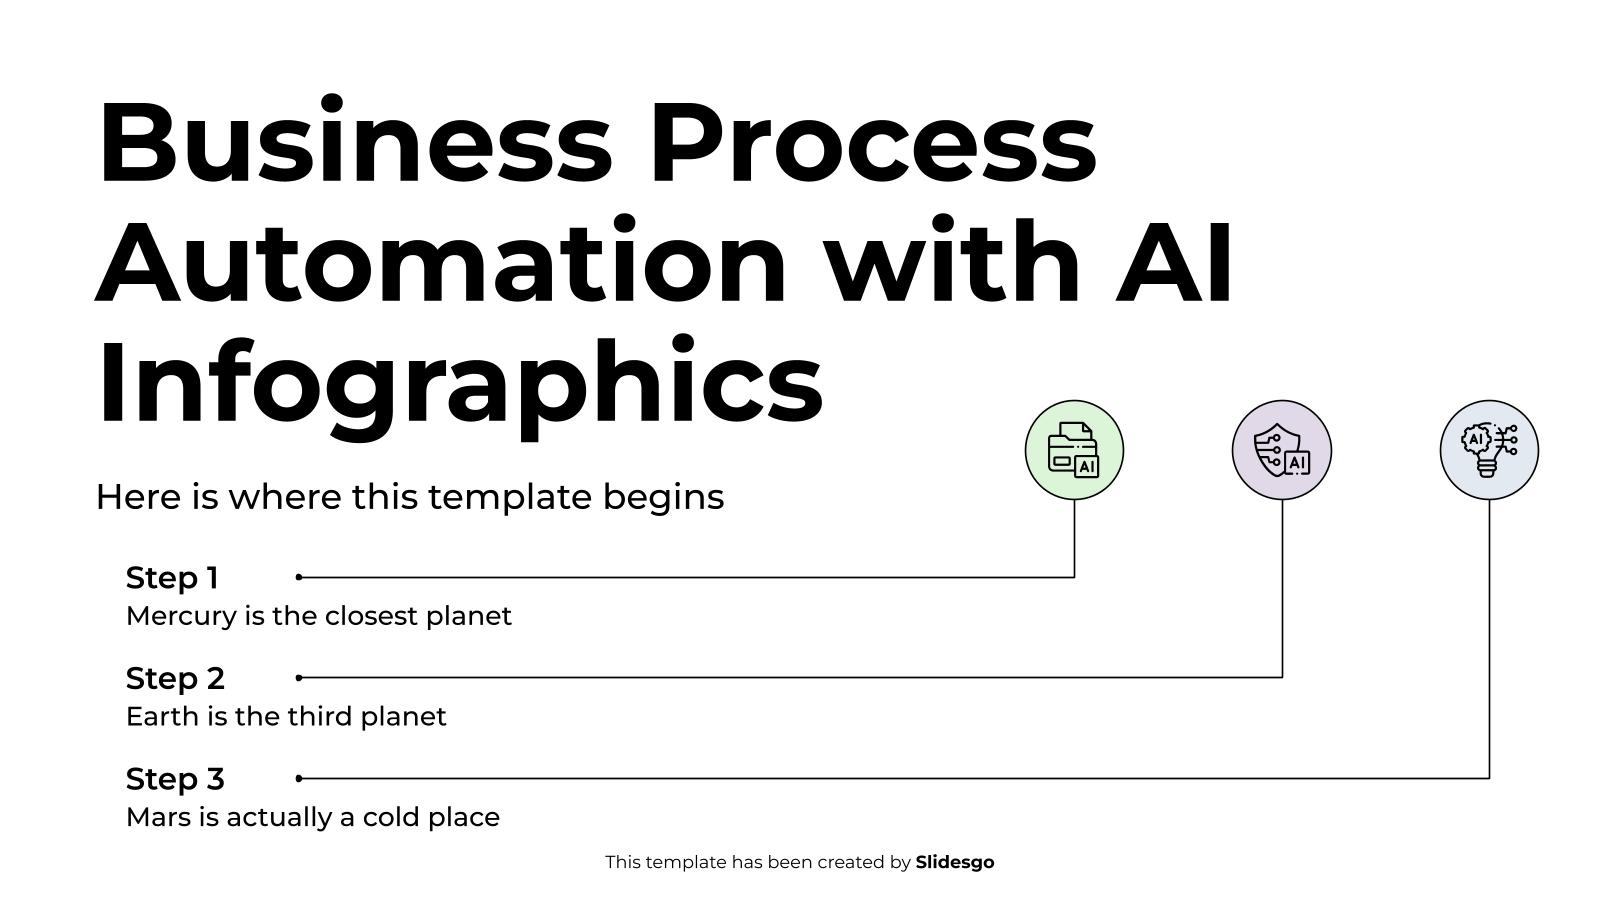
Download the Business Process Automation with AI Infographics template for PowerPoint or Google Slides to get the most out of infographics. Whether you want to organize your business budget in a table or schematically analyze your sales over the past year, this set of infographic resources will be of great...

If we can define a "sale" as the transaction in which a product is obtained in exchange of money, what would a "sales process" be? As obvious as it may seem, there's much more to it than meets the eye. Customize these editable infographics and add them to your slideshows...
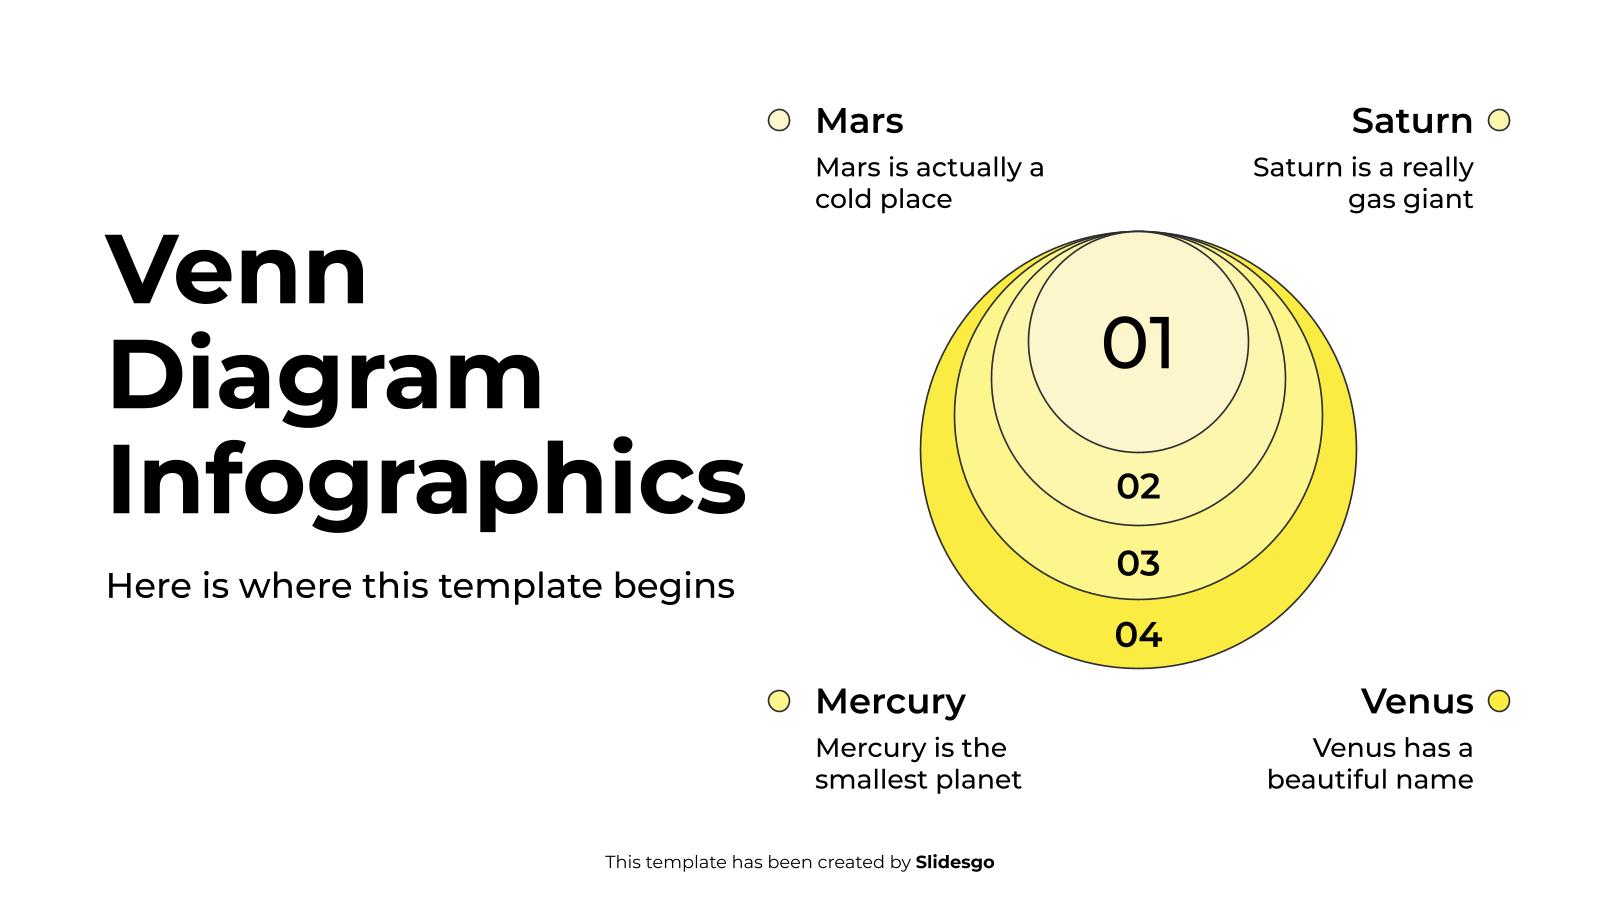
Download the Venn Diagram Infographics template for PowerPoint or Google Slides to get the most out of infographics. Whether you want to organize your business budget in a table or schematically analyze your sales over the past year, this set of infographic resources will be of great help. Start using...

Download the Strategic Roadmap Infographics template for PowerPoint or Google Slides to get the most out of infographics. Whether you want to organize your business budget in a table or schematically analyze your sales over the past year, this set of infographic resources will be of great help. Start using...

Download the "Agile Infographics" template for PowerPoint or Google Slides and discover the power of infographics. An infographic resource gives you the ability to showcase your content in a more visual way, which will make it easier for your audience to understand your topic. Slidesgo infographics like this set here...

Download the Decision Tree Infographics template for PowerPoint or Google Slides and discover this set of editable infographics for education presentations. These resources, from graphs to tables, can be combined with other presentations or used independently. The most important thing is what you will achieve: transmit information in an orderly...

To achieve something, you need to follow some steps. For example, to give a successful presentation, you need to do the following: firstly, go to the Slidesgo website; secondly, click on the template that catches your eye, which might as well be this one; thirdly, download the template to have...

Your future is in your hands, and you must deposit it in the ballot box! Speak about the importance of voting and what it means for democracies with these visual infographics about the voting process. You can use them to speak about the voting process, the counting process, televote… there’s...
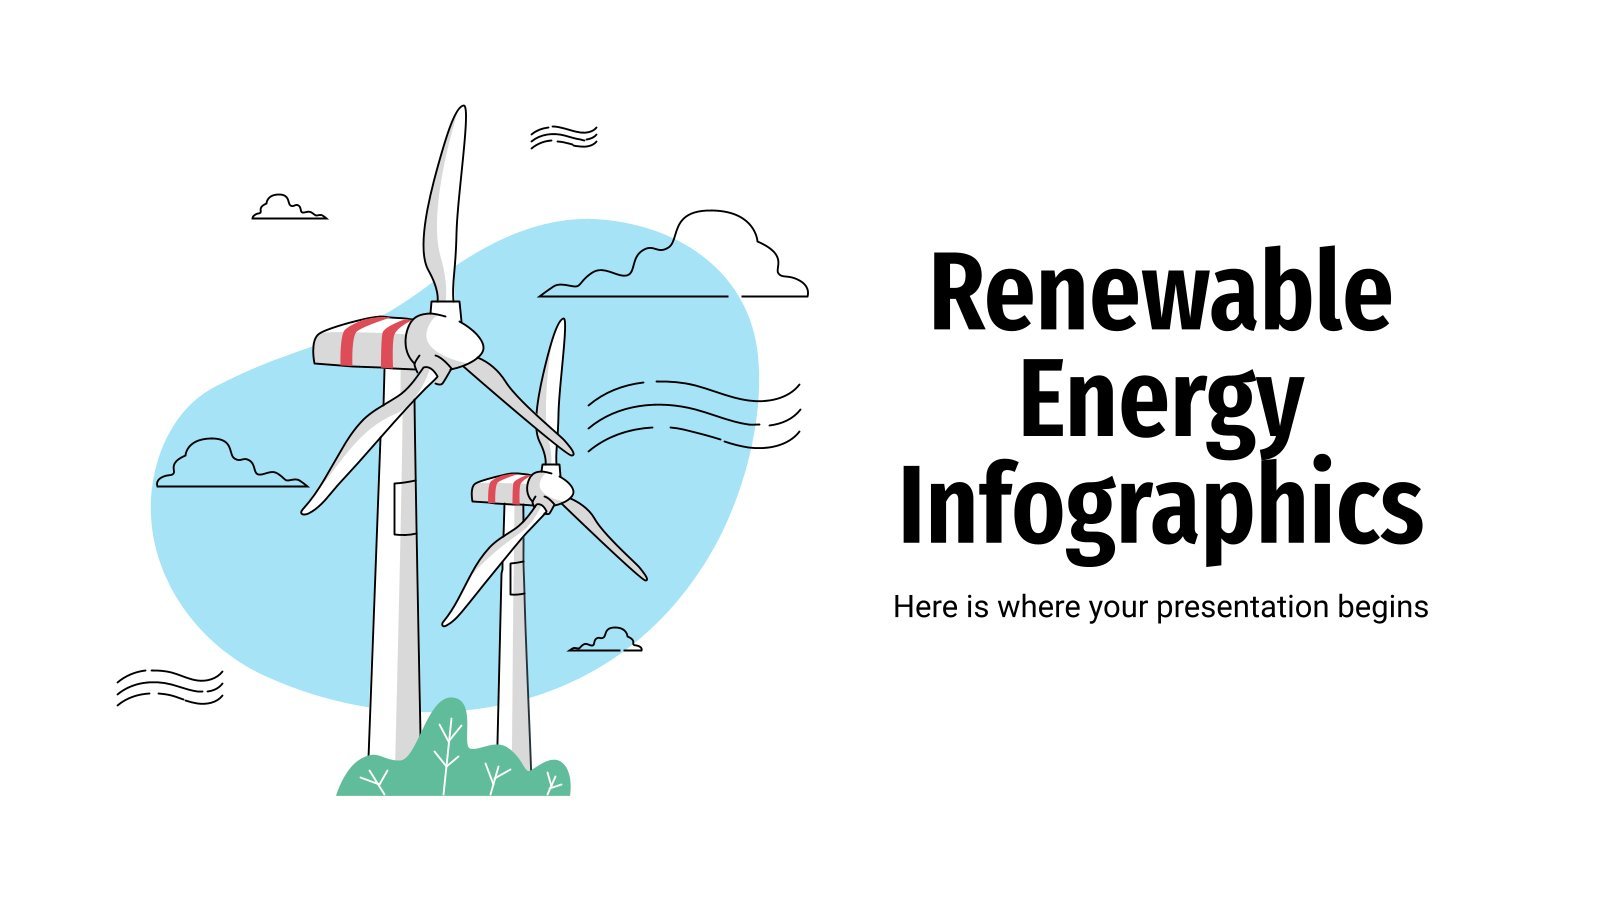
Renewable energies are the future. Clean energies with the potential to give us more than traditional sources of energy and without harming the planet. You may be preparing a presentation on this topic; do you need a set of infographics to express your data in a clear and original way?...

Download the "How To Make An Infographic" template for PowerPoint or Google Slides and discover the power of infographics. An infographic resource gives you the ability to showcase your content in a more visual way, which will make it easier for your audience to understand your topic. Slidesgo infographics like...