Process Infographics Presentation templates - Page 4
Is there a process whose steps you need to talk about in front of an audience? Add these infographics to your slides and let them be a visual support for your lecture.


It seems that you like this template!

Register for free and start downloading now
Download the Science Process Diagrams template for PowerPoint or Google Slides and discover this set of editable infographics for education presentations. These resources, from graphs to tables, can be combined with other presentations or used independently. The most important thing is what you will achieve: transmit information in an orderly...
Download the "Arrow Infographics" template for PowerPoint or Google Slides and discover the power of infographics. An infographic resource gives you the ability to showcase your content in a more visual way, which will make it easier for your audience to understand your topic. Slidesgo infographics like this set here...

This process is simple: first you discover this amazing template with infographics, then, you click on download. Do you know what happens next? Process maps are a great way of illustrating ideas that flow, changing options or different outcomes of a situation. With a set of infographics like this one,...

Download the Science Process Diagrams template for PowerPoint or Google Slides and discover this set of editable infographics for education presentations. These resources, from graphs to tables, can be combined with other presentations or used independently. The most important thing is what you will achieve: transmit information in an orderly...

Download the "How To Create An Infographic" template for PowerPoint or Google Slides and discover the power of infographics. An infographic resource gives you the ability to showcase your content in a more visual way, which will make it easier for your audience to understand your topic. Slidesgo infographics like...

Download the Project Schedule Infographics template for PowerPoint or Google Slides to get the most out of infographics. Whether you want to organize your business budget in a table or schematically analyze your sales over the past year, this set of infographic resources will be of great help. Start using...

Download the Process Infographics template for PowerPoint or Google Slides to get the most out of infographics. Whether you want to organize your business budget in a table or schematically analyze your sales over the past year, this set of infographic resources will be of great help. Start using infographics...
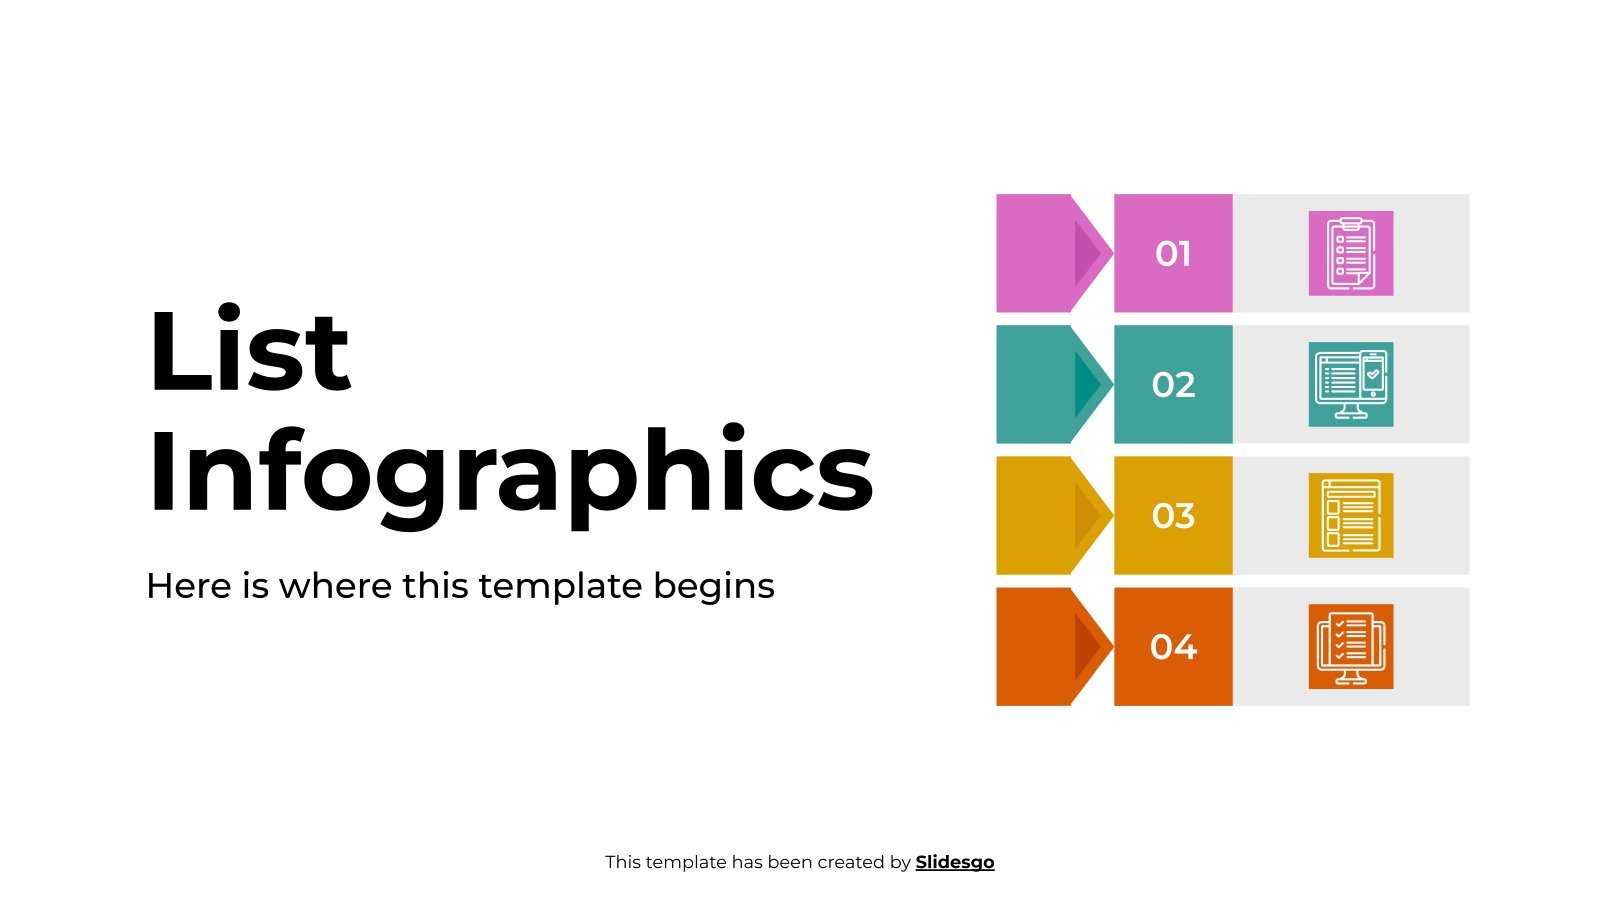
Download the "List Infographics" template for PowerPoint or Google Slides and discover the power of infographics. An infographic resource gives you the ability to showcase your content in a more visual way, which will make it easier for your audience to understand your topic. Slidesgo infographics like this set here...

Download the Business Diagram Infographics template for PowerPoint or Google Slides to get the most out of infographics. Whether you want to organize your business budget in a table or schematically analyze your sales over the past year, this set of infographic resources will be of great help. Start using...

Design thinking is a way of working that sharpens creativity to come up with new ideas to solve user problems. It is inspired by the working methodology of product designers and has five main categories: empathy generation, definition, ideation, prototyping and testing. In this template you will find different types...
Download the "Icons Infographics" template for PowerPoint or Google Slides and discover the power of infographics. An infographic resource gives you the ability to showcase your content in a more visual way, which will make it easier for your audience to understand your topic. Slidesgo infographics like this set here...

Download the Change Management Process Flow Diagrams for Business presentation for PowerPoint or Google Slides. The world of business encompasses a lot of things! From reports to customer profiles, from brainstorming sessions to sales—there's always something to do or something to analyze. This customizable design, available for Google Slides and...
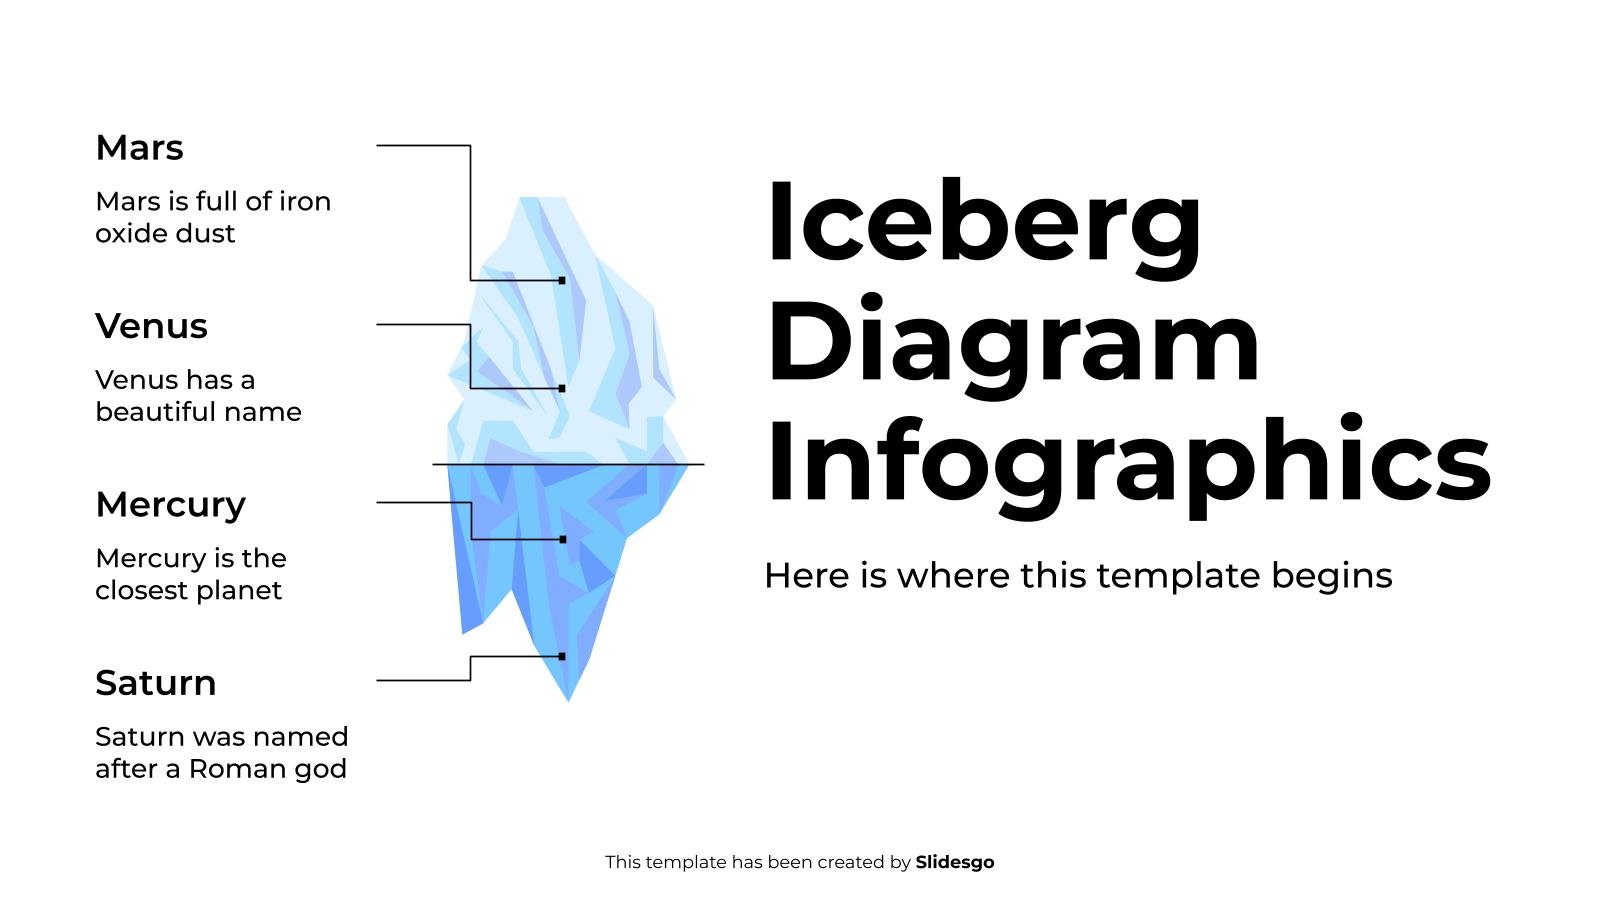
Download the Iceberg Diagram Infographics template for PowerPoint or Google Slides to get the most out of infographics. Whether you want to organize your business budget in a table or schematically analyze your sales over the past year, this set of infographic resources will be of great help. Start using...

Download the List Infographics template for PowerPoint or Google Slides to get the most out of infographics. Whether you want to organize your business budget in a table or schematically analyze your sales over the past year, this set of infographic resources will be of great help. Start using infographics...

This set of infographics can be reused as many times as you need! Here, you can find infographic resources to talk about the recycling process, which is very important to take care of the precious planet we have. In this way, you will find among the slides resources such as...

For a product to work 100%, you must understand 100% of the customer's needs. And not only their needs, but also their opinions, understanding who the customer is, identifying their motivations and doubts or looking for the “touchpoints” between the product and the customer. All this study and process is...

Download the Strategic Plan Roadmap Infographics template for PowerPoint or Google Slides to get the most out of infographics. Whether you want to organize your business budget in a table or schematically analyze your sales over the past year, this set of infographic resources will be of great help. Start...
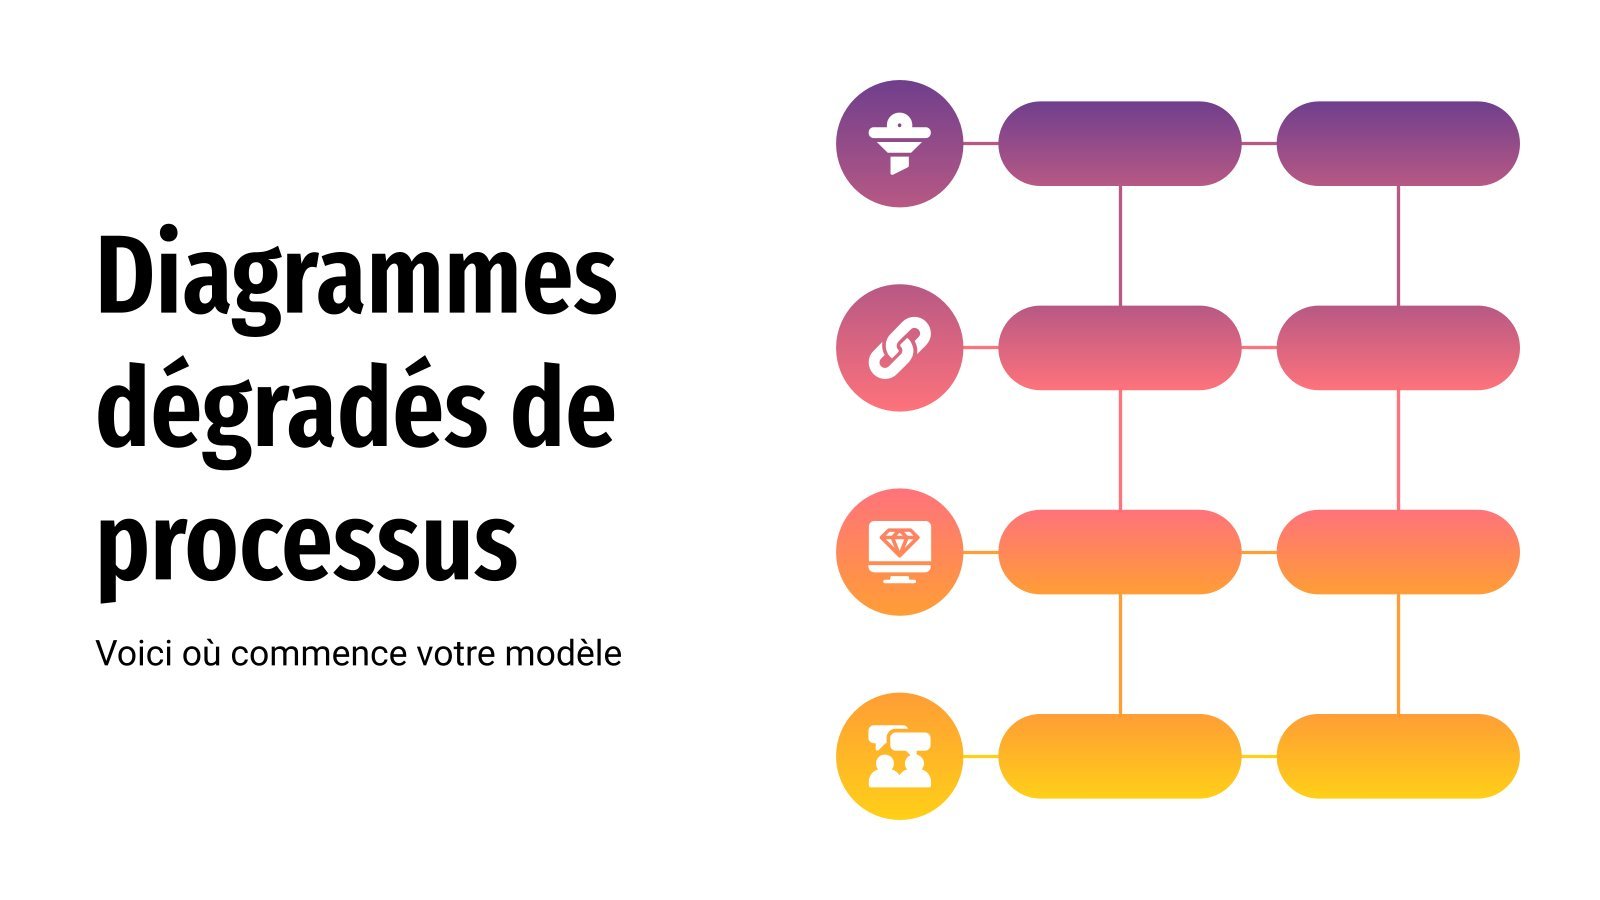
If you need to illustrate the process of a product, the workflows of a company or, in short, any process, we have designed some very special infographics. They are special because the infographic resources have color gradients, which will give an original touch to your content and, in addition, the...