Process Infographics Presentation templates - Page 3
Is there a process whose steps you need to talk about in front of an audience? Add these infographics to your slides and let them be a visual support for your lecture.


It seems that you like this template!

Register for free and start downloading now
Download the Process Infographics template for PowerPoint or Google Slides to get the most out of infographics. Whether you want to organize your business budget in a table or schematically analyze your sales over the past year, this set of infographic resources will be of great help. Start using infographics...

Spreadsheets are part of everyday business, what if you could give them a twist and make them more visually appealing? With this infographic template you will easily capture the attention of your boss, colleagues and clients. They are made in blue, which conveys serenity, and have different structures so you...
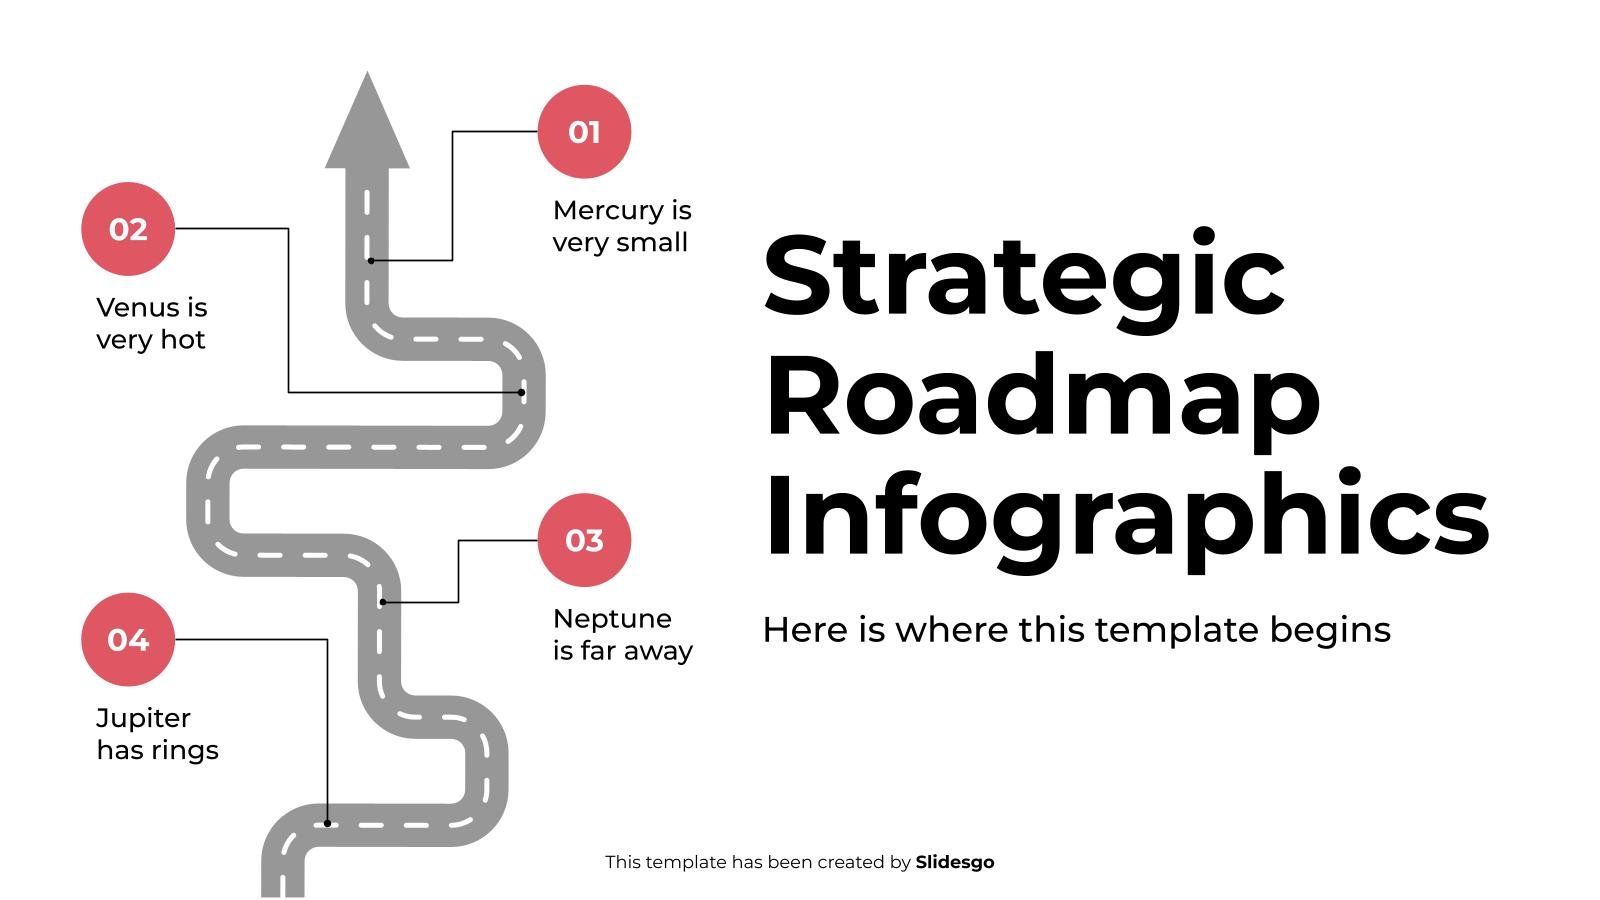
Download the Strategic Roadmap Infographics template for PowerPoint or Google Slides to get the most out of infographics. Whether you want to organize your business budget in a table or schematically analyze your sales over the past year, this set of infographic resources will be of great help. Start using...

Does your project require a series of steps or alternating phases? Explain just that with these infographics and guide your audience so that they understand the process and how the goal is reached. You'll find mostly timelines here, with varying numbers of elements, representing each of these phases. The palette...

Download the Change Management Process: Flow Diagrams for Business Infographics template for PowerPoint or Google Slides and discover the power of infographics. An infographic resource gives you the ability to showcase your content in a more visual way, which will make it easier for your audience to understand your topic....

What you'll find in this new template is a collection of infographics of the Six Sigma strategy, one of the best tools for process improvement. Our designs make use of gradients and come with five elements in order to represent the DMAIC methodology (Define, Measure, Analyze, Improve and Control). This...

Data migration is the process to transfer data from one system to another while changing the storage system where the data is located, or while making the necessary changes to the database or the application that manages it. It sounds like a complex process, but we are sure that your...
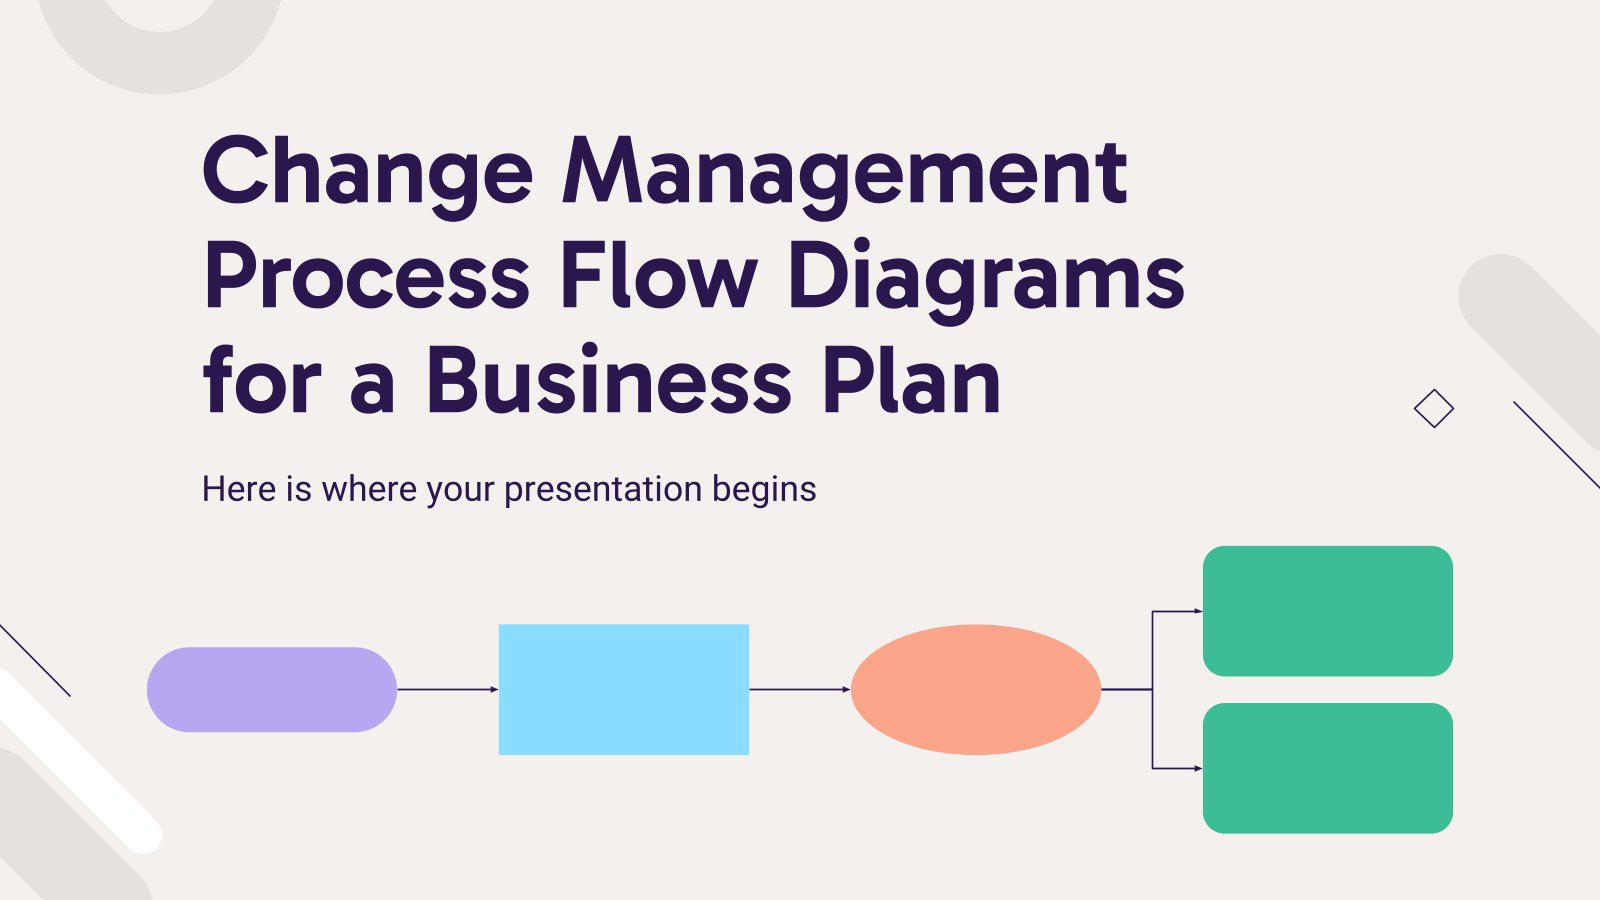
Download the Change Management Process Flow Diagrams for a Business Plan presentation for PowerPoint or Google Slides. Conveying your business plan accurately and effectively is the cornerstone of any successful venture. This template allows you to pinpoint essential elements of your operation while your audience will appreciate the clear and...
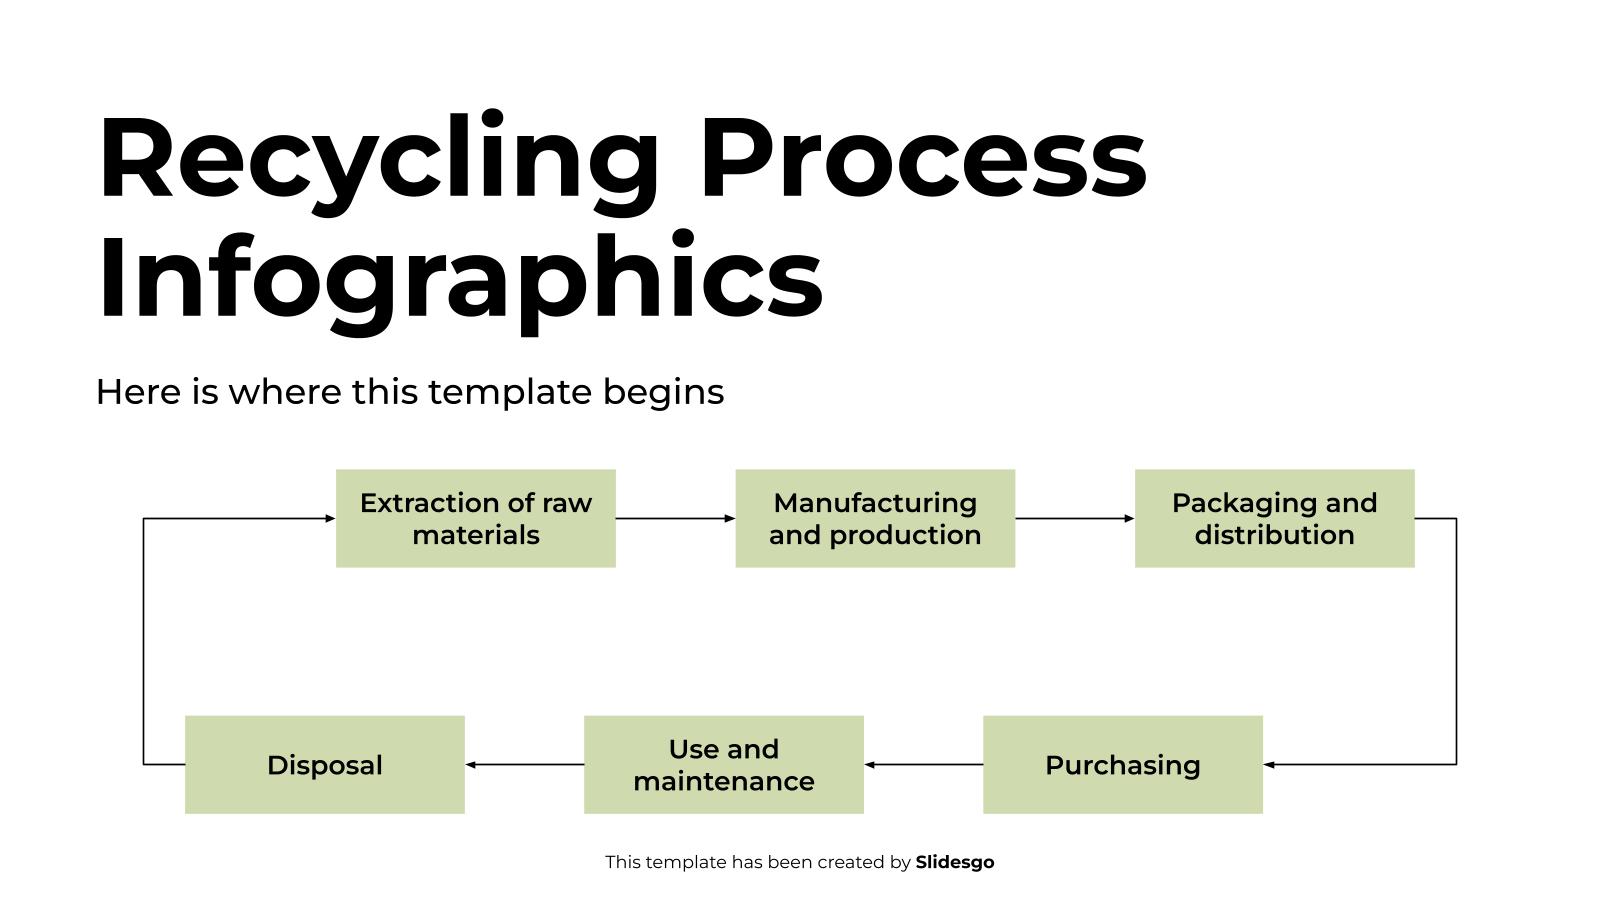
Download the Recycling Process Infographics template for PowerPoint or Google Slides to get the most out of infographics. Whether you want to organize your business budget in a table or schematically analyze your sales over the past year, this set of infographic resources will be of great help. Start using...

Download the Timeline Infographics template for PowerPoint or Google Slides to get the most out of infographics. Whether you want to organize your business budget in a table or schematically analyze your sales over the past year, this set of infographic resources will be of great help. Start using infographics...
Download the "Arrow Infographics" template for PowerPoint or Google Slides and discover the power of infographics. An infographic resource gives you the ability to showcase your content in a more visual way, which will make it easier for your audience to understand your topic. Slidesgo infographics like this set here...
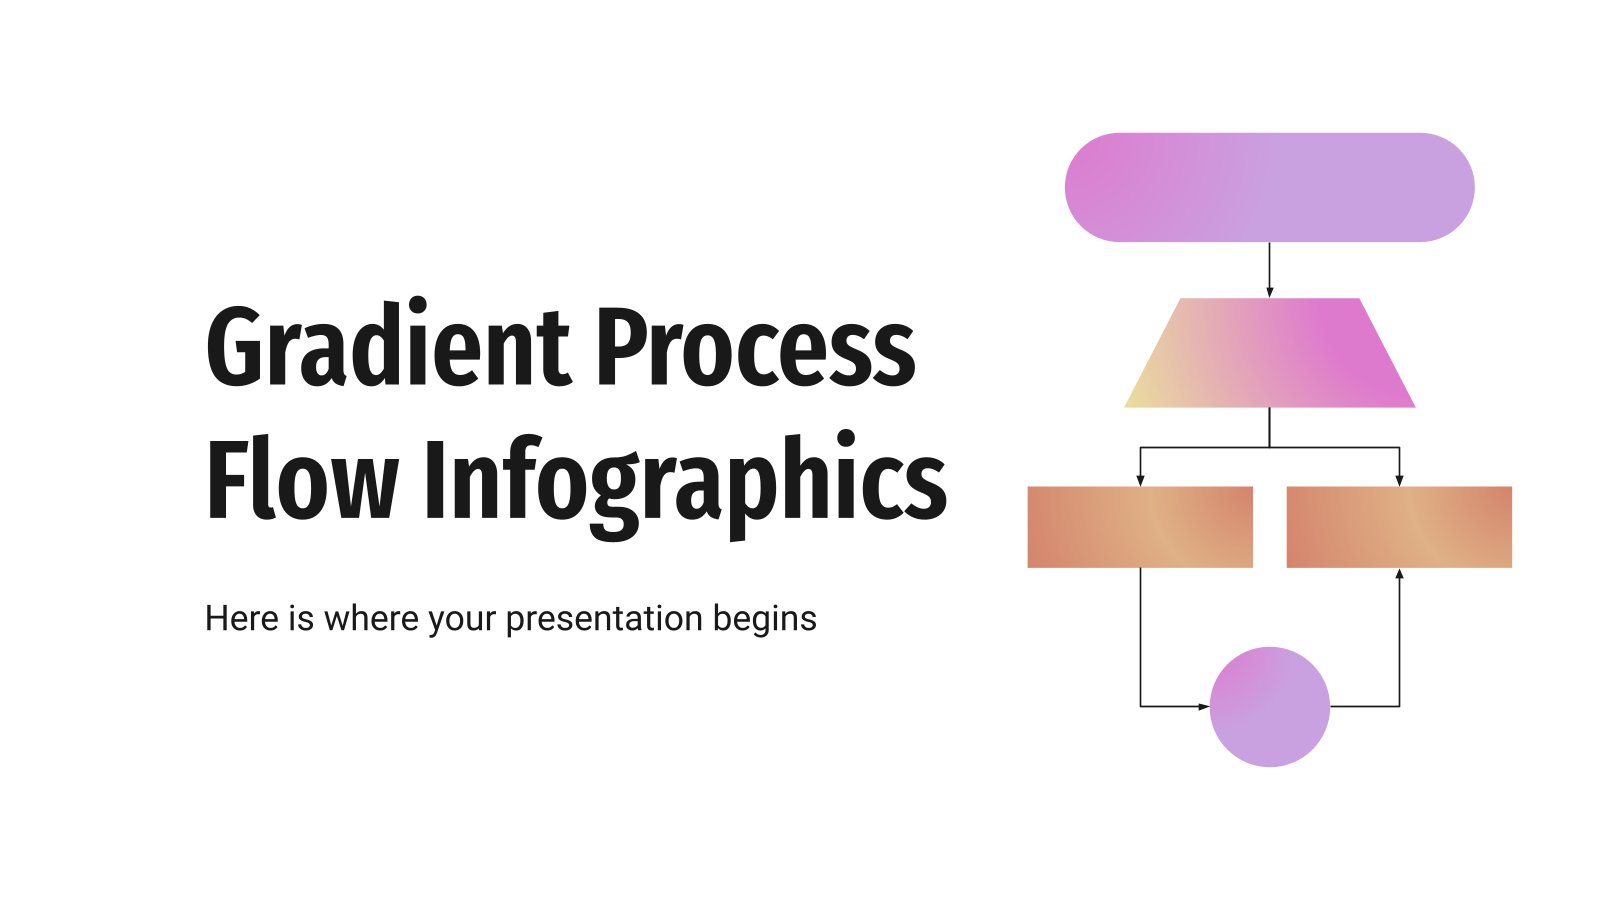
Life is made out of choices, and for every choice you take, more choices open up in front of you! Represent this never-ending process with these infographics with beautiful gradients in purple and orange. Having a clear idea of where your choices get you is key if you don’t want...
Whether we’re talking about mass production, batch processing, workflow or logistics, industrial processes are a topic with a lot to talk and learn about. If you’re trying to present these processes in a visually clear way to your college students, you may want to check out these infographics! With industrial...

Do you know how the acronym RAPID is formed? It comes from "recommend", "agree", "perform", "input" and "decide". These words create RAPID, which is a decision-making model for companies. With this model you can organize the decision-making process from start to finish. So, we have designed this set of infographics...
You must follow the directions, specifically the arrows, but upward arrows to success! This template contains 32 infographics, with lots and lots of arrows for all kinds of uses in your presentations. Arrange your data in chronological order or just enjoy the amazing decorative touch of the arrows. Follow the...

This process is simple: first you discover this amazing template with infographics, then, you click on download. Do you know what happens next? Process maps are a great way of illustrating ideas that flow, changing options or different outcomes of a situation. With a set of infographics like this one,...

Download the Change Management Process: Flow Diagrams for a Business Plan Infographics presentation for PowerPoint or Google Slides. Conveying your business plan accurately and effectively is the cornerstone of any successful venture. This template allows you to pinpoint essential elements of your operation while your audience will appreciate the clear...
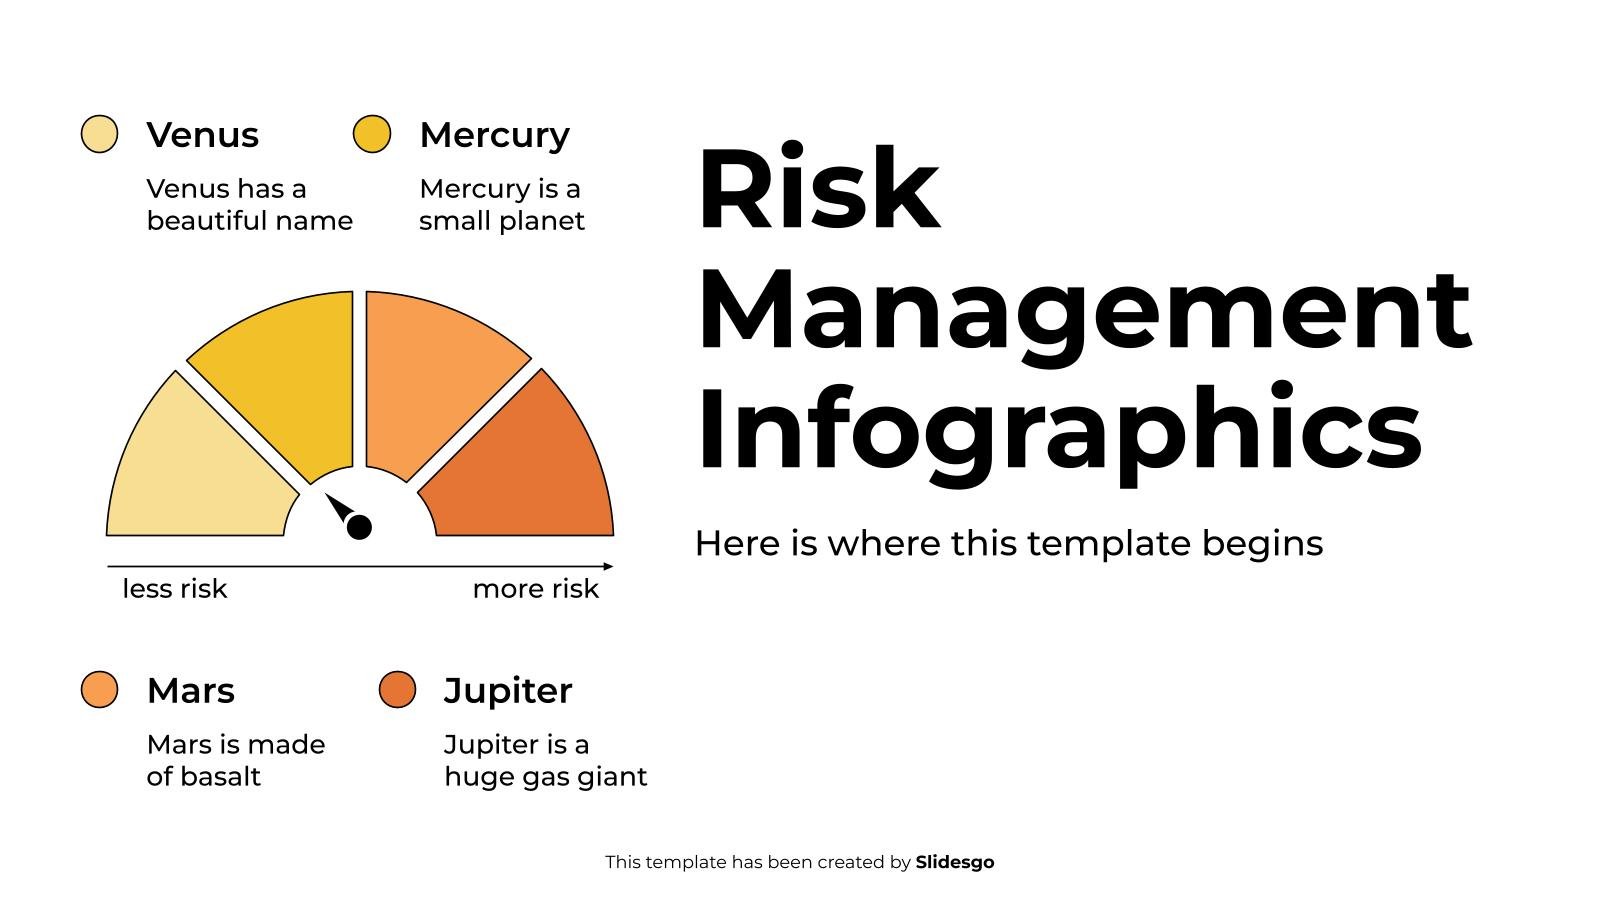
Download the Risk Management Infographics template for PowerPoint or Google Slides to get the most out of infographics. Whether you want to organize your business budget in a table or schematically analyze your sales over the past year, this set of infographic resources will be of great help. Start using...