Infographics Presentation templates - Page 31
Discover our engaging Google Slides and PowerPoint slides full of infographics to present your information or data clearly and quickly!


It seems that you like this template!

Register for free and start downloading now
Download the "Cycle Diagrams Theme for a Company Profile" presentation for PowerPoint or Google Slides. Presenting a comprehensive company profile can be a game-changer for your business. A well-crafted profile connects with potential clients and vendors on another level, giving them a deep understanding of your organization. This company profile...
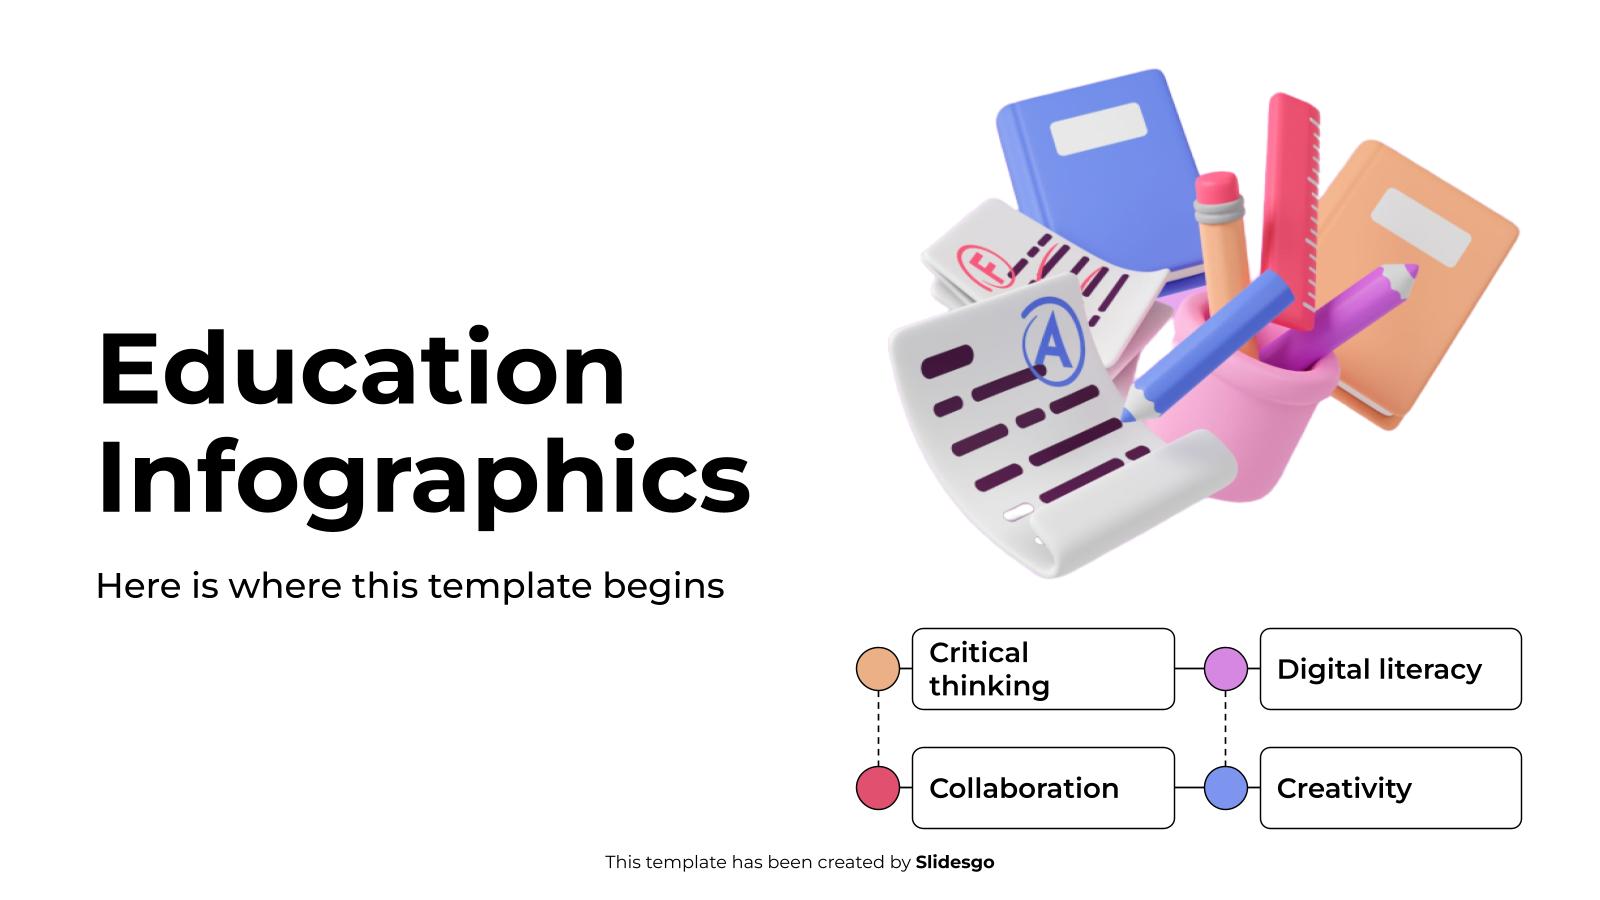
Download the Education Infographics template for PowerPoint or Google Slides and discover this set of editable infographics for education presentations. These resources, from graphs to tables, can be combined with other presentations or used independently. The most important thing is what you will achieve: transmit information in an orderly and...

If you like abstract designs, leaves, soft colors and a Memphis style, and at the same time you wanted some help with the presentation for your thesis defense, this template might be of your taste! Like its parent template, these come with earthy tones and a combination of abstract designs...

Transform your data into a visual masterpiece with the power of chart infographics! Forget about dull spreadsheets and create something truly unique and compelling. With templates like this one, the sky's the limit when it comes to creativity and customization. And the best part? You can adapt them to your...

The opinion of your customers is invaluable in order to keep improving your services, products, shops, anything! If you're going to show a report on customer satisfaction, make it more visual by using these infographics. All of them depict different emojis, representing various degrees of approval or disapproval. Most of...

Download the Strategic Roadmap Infographics template for PowerPoint or Google Slides to get the most out of infographics. Whether you want to organize your business budget in a table or schematically analyze your sales over the past year, this set of infographic resources will be of great help. Start using...

Download the "CSR Infographics" template for PowerPoint or Google Slides and discover the power of infographics. An infographic resource gives you the ability to showcase your content in a more visual way, which will make it easier for your audience to understand your topic. Slidesgo infographics like this set here...

Expressing different emotions will be easier than ever thanks to this infographics template with funny emojis that convey different feelings. These funny emoticons have become a universal language, and what better way than through them to talk about feelings. It includes graphs, diagrams, infographics and even process infographics with the...

Download the A/B Testing Infographics template for PowerPoint or Google Slides to get the most out of infographics. Whether you want to organize your business budget in a table or schematically analyze your sales over the past year, this set of infographic resources will be of great help. Start using...

These infographic resources are designed to help consultants show clients how they can achieve success. Every consultant needs the correct information to interpret data and make informed decisions, and these infographics provide this in an easy-to-read format. What’s more, this set of infographics is the complementary tool of one of...

What you'll find in this new template is a collection of infographics of the Six Sigma strategy, one of the best tools for process improvement. Our designs make use of gradients and come with five elements in order to represent the DMAIC methodology (Define, Measure, Analyze, Improve and Control). This...

A stakeholder is a public of interest for a company. Public refers to all the people or organizations that are related to the activities and decisions of a business, such as: employees, suppliers, customers, government, among others. For a corporation, analyzing its stakeholders is very important, explain how to do...

Technology is everywhere: the computer, the screen you're looking at right now, the smartphone, the earphones, the train you're boarding, the electric scooter... For a presentation that highlights the importance of technology in the business sector, we've designed a set of editable infographics that go well with that topic. Complementing...
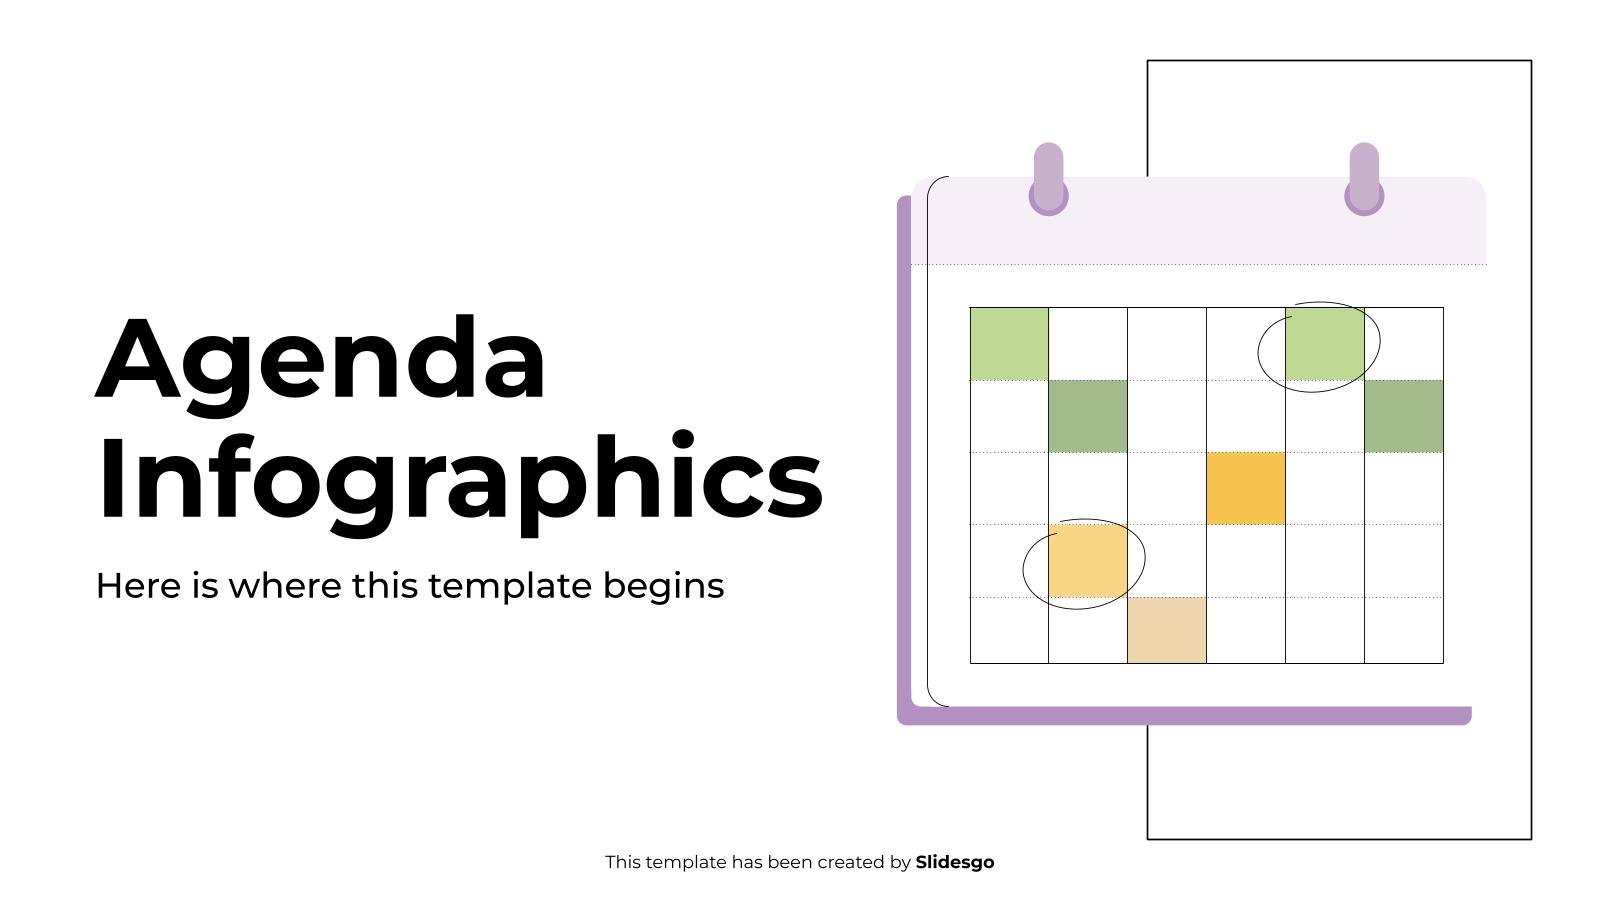
Download the Agenda Infographics template for PowerPoint or Google Slides to get the most out of infographics. Whether you want to organize your business budget in a table or schematically analyze your sales over the past year, this set of infographic resources will be of great help. Start using infographics...

There are two things that have no limits when it comes to template editing: creativity and imagination. A Slidesgo template can always keep improving itself, thanks to your content and new infographic resources, like the ones we bring you here. You can continue to complement the presentation All About Asia...

You might think torn paper is something to be thrown to the garbage bin. We see it as something we can give a new use to. With this set of editable infographics, you'll realize how! These designs, which also include graphs and diagrams, give life to those pieces of paper...
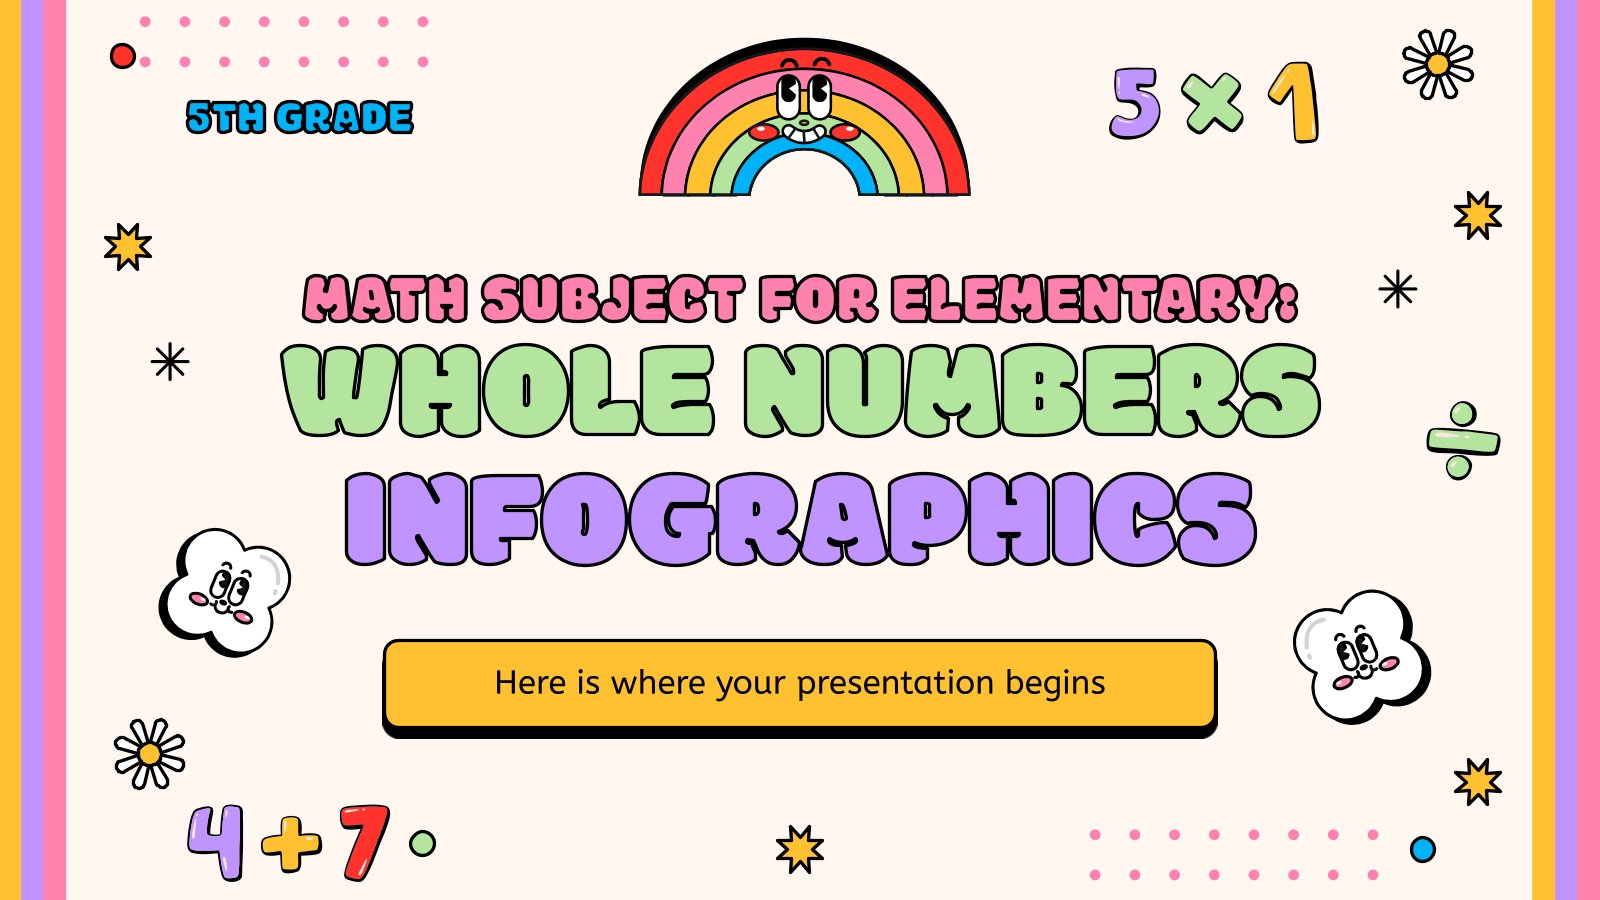
Download the Math Subject for Elementary - 5th Grade: Whole Numbers Infographics template for PowerPoint or Google Slides and discover the power of infographics. An infographic resource gives you the ability to showcase your content in a more visual way, which will make it easier for your audience to understand...

After completing a thesis on the issues of smoking, you came to Slidesgo and downloaded a template called "Social Issues Thesis: Smoking". You customized it and then... you thought that some extra infographic designs would improve your presentation even more. Here you are, infographics with a similar style to the...