Infographics Presentation templates - Page 32
Discover our engaging Google Slides and PowerPoint slides full of infographics to present your information or data clearly and quickly!


It seems that you like this template!

Register for free and start downloading now
Businesses, organizations, groups or individuals, when gathered together in order to discuss what's the best course of action they have to take to achieve their goals, have to decide that road they'll follow. If you ask us, it's a simple thing: visit Slidesgo, then locate roadmap infographics like this one,...

Indexes are great for organizing chapters in books but… What if you could use something similar to arrange your concepts, ideas or steps? We have created some agenda diagrams that will help you do so!

Being computer literate and mastering the different platforms there are to communicate online is a valuable skill that will open many doors for you, not only in your career, but also in your personal life. Explain its importance with this set of modern infographics with a corporate and illustrative design,...
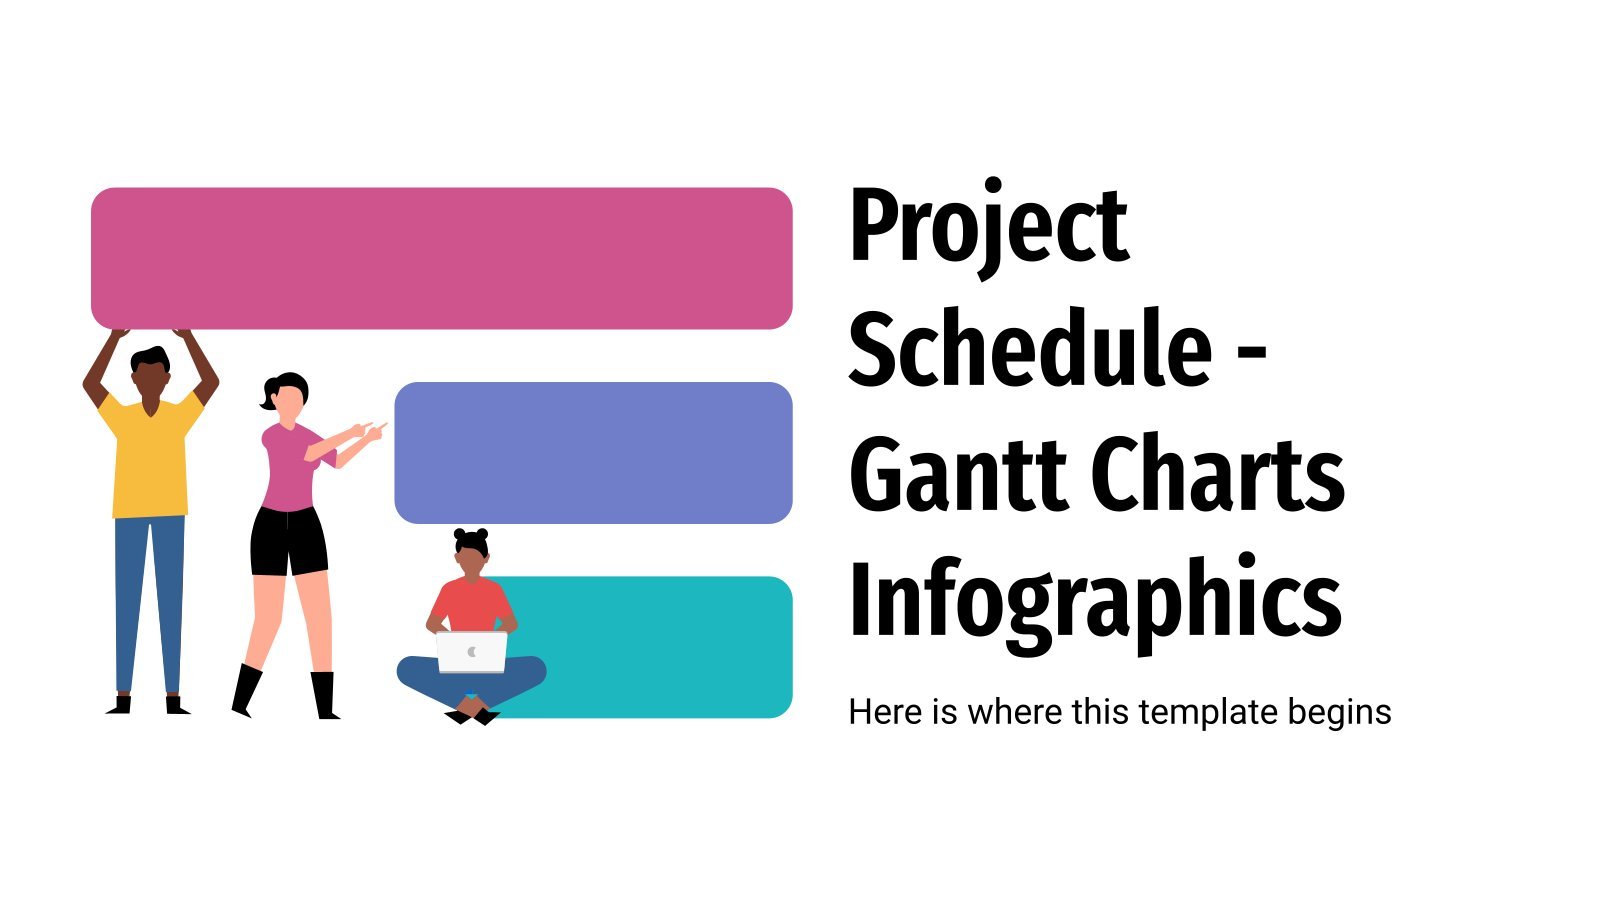
The ultimate collection of Gantt charts for projects has arrived! Slidesgo has designed thirty different layouts with this kind of chart, ideal for representing the duration of tasks or activities. Great for keeping track of deadlines at a glance, adapt these designs to your needs and match the colors to...

Account-based marketing tries to break with the thought that "we must sell this product to everyone" and, instead, tries to market several products to an individual customer (or account). The steps to take can be explained visually in these editable infographics for presentations. We've created a good variety of flat-styled...
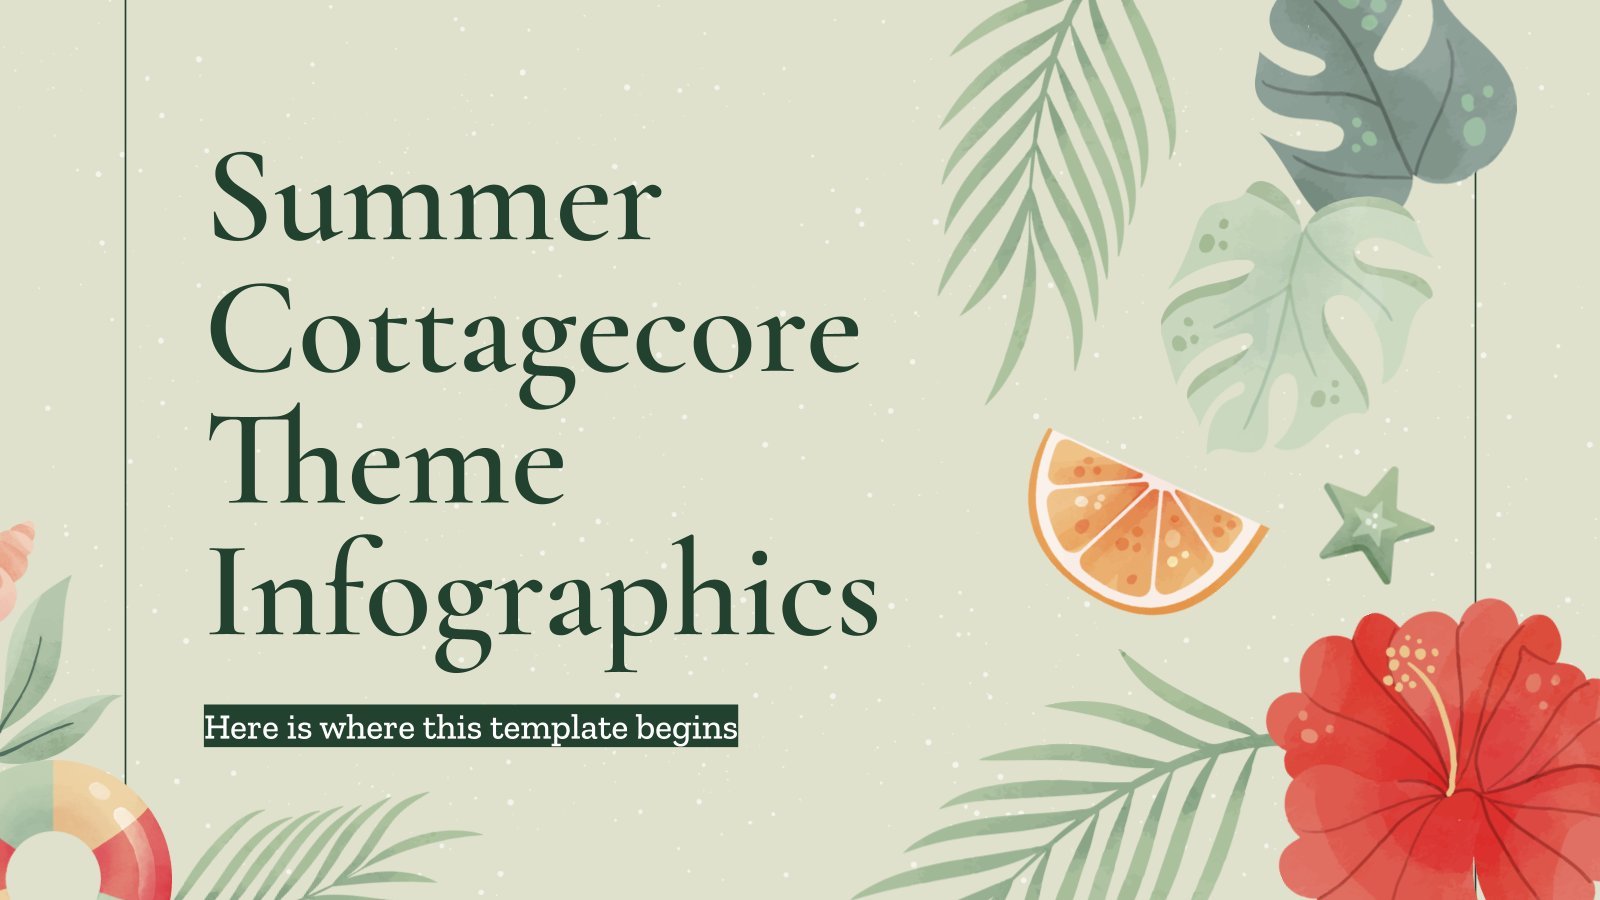
Download the Summer Cottagecore Theme Infographics template for PowerPoint or Google Slides and discover the power of infographics. An infographic resource gives you the ability to showcase your content in a more visual way, which will make it easier for your audience to understand your topic. Slidesgo infographics like this...

Download the Biography Infographics presentation for PowerPoint or Google Slides. The world of business encompasses a lot of things! From reports to customer profiles, from brainstorming sessions to sales—there's always something to do or something to analyze. This customizable design, available for Google Slides and PowerPoint, is what you were...

Let's make the work of pediatricians much easier! At least, when it comes to giving information to parents of a newborn! These infographics of all kinds (graphs, diagrams, pie charts, timelines and more) are quite useful to explain the stages of child development, especially within the first 12 months. We've...

Download the Checklist Infographics template for PowerPoint or Google Slides to get the most out of infographics. Whether you want to organize your business budget in a table or schematically analyze your sales over the past year, this set of infographic resources will be of great help. Start using infographics...

Day and night are so different! Some people even feel different depending on the time it is at the moment. Boost your presentations by inserting these editable infographics, which revolve around daylight and information derived from that. The designs are quite varied, with all kinds of illustrations and arrangements. There're...

Looking for an effective way of displaying your business processes and flows? In Slidesgo, we have created spiral diagrams to help you. They are pretty useful to show, for example, cyclical steps. Give them a go and try the perks of using one of these diagrams.
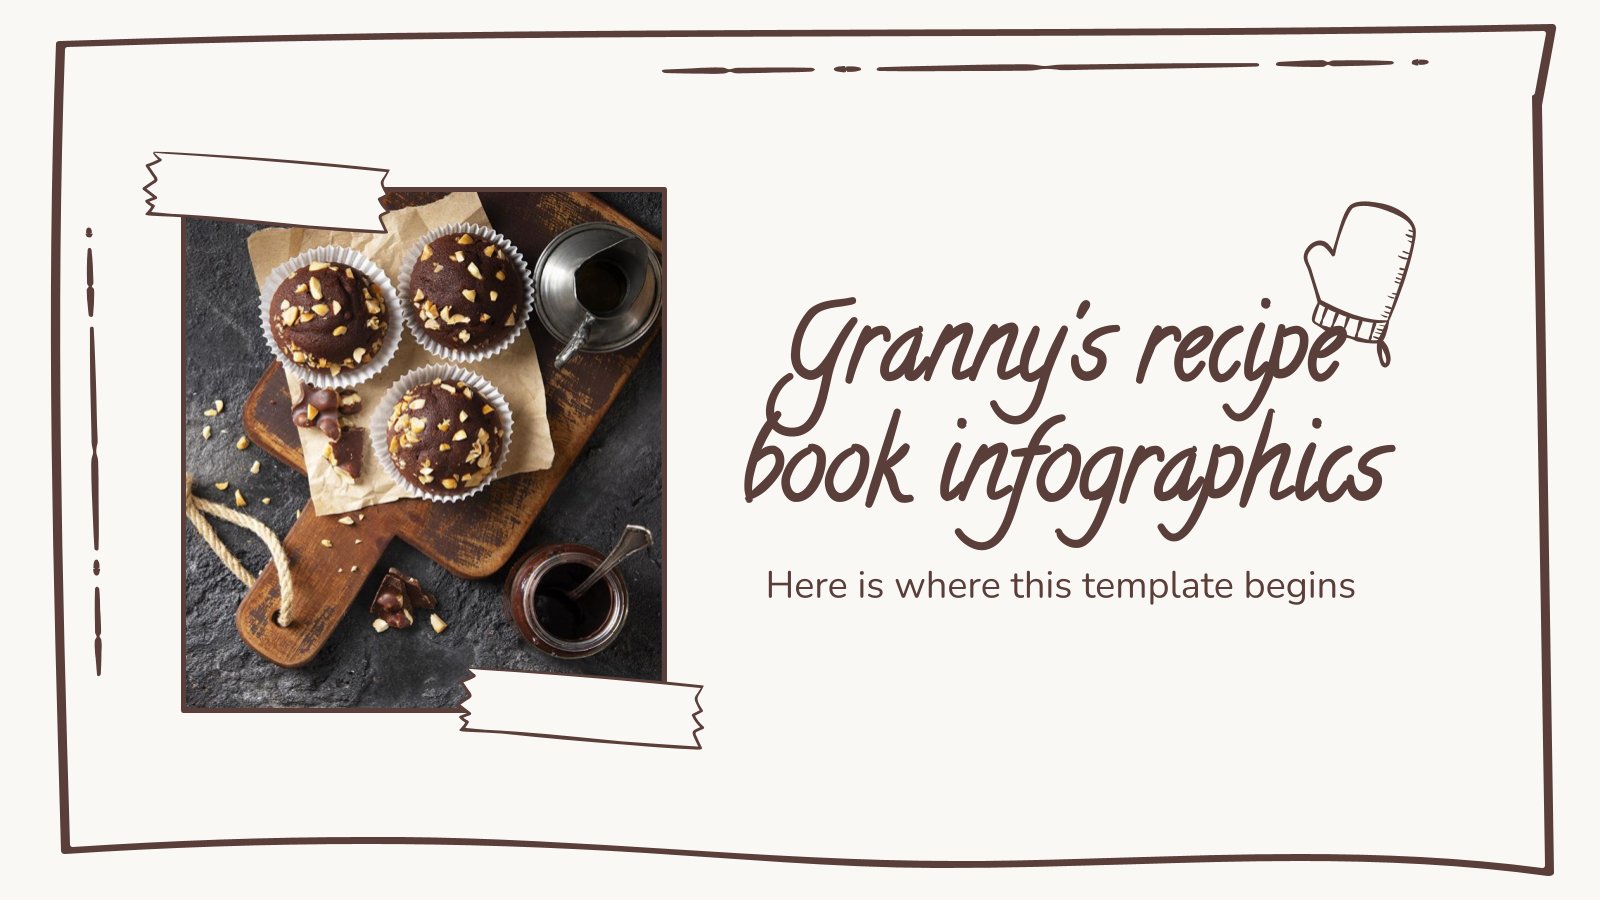
Nobody cooks like your grandmother. Could it be the love she uses when cooking, or maybe it's a secret ingredient? Whatever the answer, grouping all the recipes in one place can be a great idea, so you can have the recipes close at hand when you want to prepare one...

Are you looking for some infographics to describe the activities of your company? Value chains are great for doing so, and to add some value for the final client and the enterprise itself. They resemble arrows, and they display flat, linear and filled designs and 4 to 6 sections per...

Begin this new school year full of energy! Use this chalkboard template to gather information for your pupils and their parents. It will make the communication process easier and you’ll have all the important data very well organized from the start!

This process is simple: first you discover this amazing template with infographics, then, you click on download. Do you know what happens next? Process maps are a great way of illustrating ideas that flow, changing options or different outcomes of a situation. With a set of infographics like this one,...

We've created a very special design! It is a set of infographics complementary to the presentation "Social Skills Subject: Practice Problem-Solving in Social Situations for Pre-K" so that you can continue to help develop better social skills in your preschool students. The infographics include more than 30 activities in which...

Apples, oranges, bananas, pineapples, watermelons... The variety of fruit available in this world is huge! They're a healthy source of vitamins and other beneficial substances, and we're sure you know some recipes that you'd like to share with your audience. Download this set of infographics, customize them and surprise everyone!...
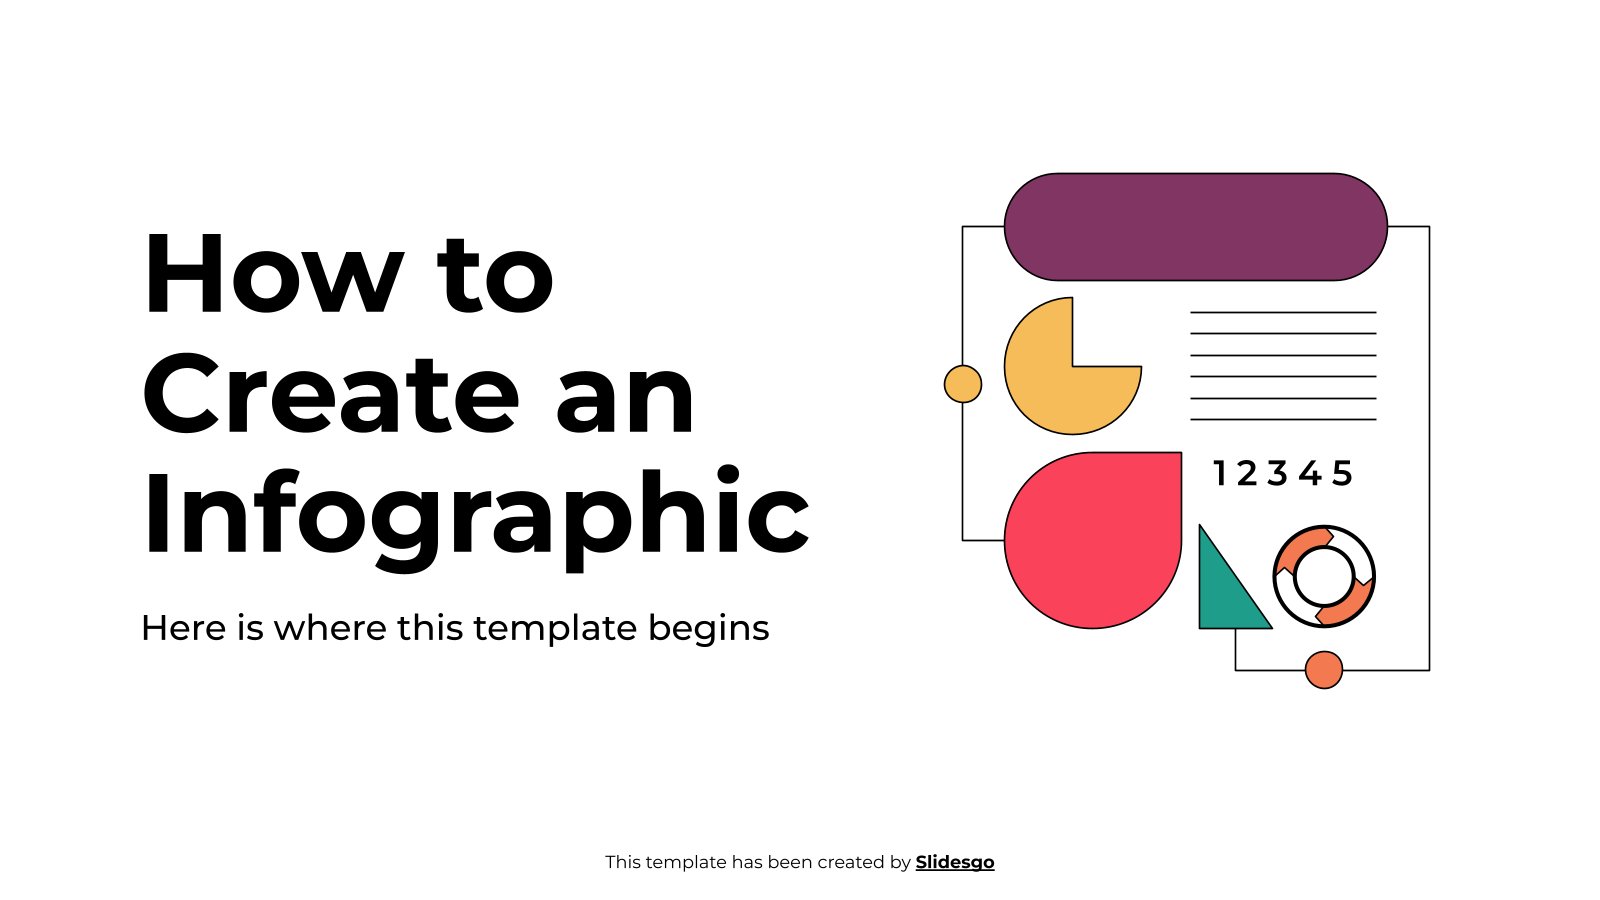
Download the "How To Create An Infographic" template for PowerPoint or Google Slides and discover the power of infographics. An infographic resource gives you the ability to showcase your content in a more visual way, which will make it easier for your audience to understand your topic. Slidesgo infographics like...