Infographics Presentation templates - Page 14
Discover our engaging Google Slides and PowerPoint slides full of infographics to present your information or data clearly and quickly!


It seems that you like this template!

Register for free and start downloading now
Download the "Cycle Diagrams Theme for Business" presentation for PowerPoint or Google Slides. The world of business encompasses a lot of things! From reports to customer profiles, from brainstorming sessions to sales—there's always something to do or something to analyze. This customizable design, available for Google Slides and PowerPoint, is...

Download the Creative Checklist Infographics template for PowerPoint or Google Slides to get the most out of infographics. Whether you want to organize your business budget in a table or schematically analyze your sales over the past year, this set of infographic resources will be of great help. Start using...

Download the Beer Infographics template for PowerPoint or Google Slides and discover the power of infographics. An infographic resource gives you the ability to showcase your content in a more visual way, which will make it easier for your audience to understand your topic. Slidesgo infographics like this set here...

Keep track of your team’s productivity with these creative infographics for business. We have included all different kinds of planners: monthly, daily, yearly, divided per tasks… don’t worry if you need something tailor-made, we have also made sure that everything is editable so that you can create your own personalized...

Download the Marketing Infographics template for PowerPoint or Google Slides and discover the power of infographics. An infographic resource gives you the ability to showcase your content in a more visual way, which will make it easier for your audience to understand your topic. Slidesgo infographics like this set here...

What ways do you know of to show respect? For example, listening and not interrupting when a person is talking or not judging other people's opinions are ways to show respect. Thus, from Slidesgo, we have designed a set of infographics to continue learning about respect and to put it...
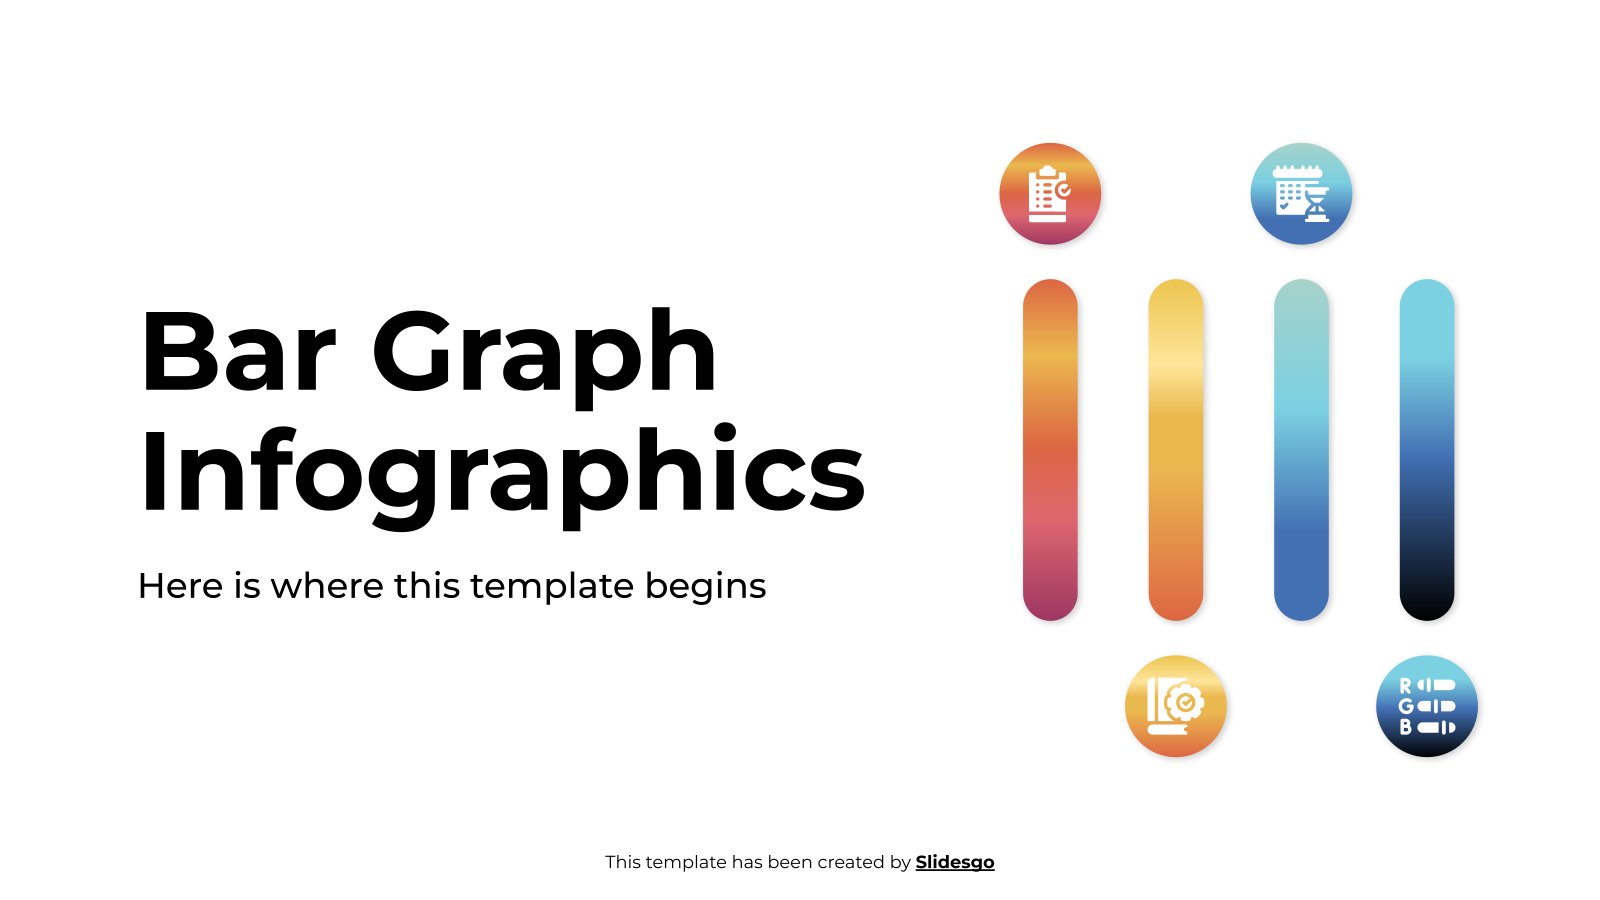
Download the Bar Graph Infographics template for PowerPoint or Google Slides and discover the power of infographics. An infographic resource gives you the ability to showcase your content in a more visual way, which will make it easier for your audience to understand your topic. Slidesgo infographics like this set...

Are you looking for a way to show your data in a visual way for your students? Try using these Training Infographics to compare items or explain steps, These slides include timelines, processes, schedules, tables, blocks or banners that are notable for their flat design. They have three to six...

Download the List Infographics template for PowerPoint or Google Slides to get the most out of infographics. Whether you want to organize your business budget in a table or schematically analyze your sales over the past year, this set of infographic resources will be of great help. Start using infographics...
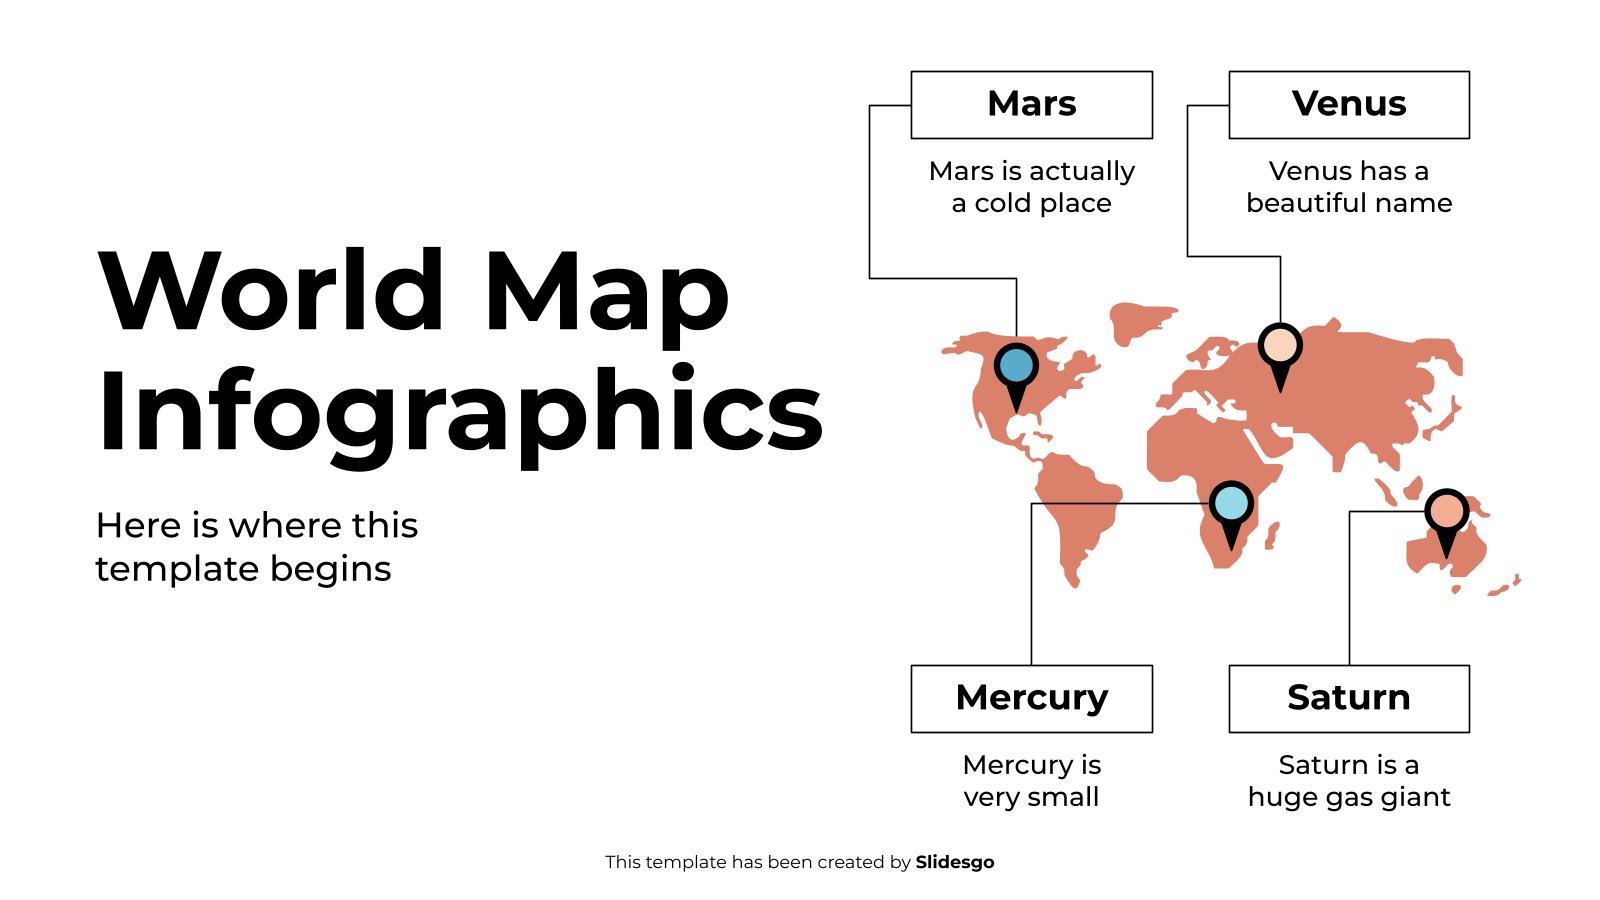
Download the World Map Infographics template for PowerPoint or Google Slides to get the most out of infographics. Whether you want to organize your business budget in a table or schematically analyze your sales over the past year, this set of infographic resources will be of great help. Start using...

Ready to use funnel infographics? They are perfect for business and marketing. Thanks to their conical shapes, you can depict the different steps to achieve your goal (e.g. a given client or lead.) Each section represents a percentage of loss for each stage of the process, that’s why they are...

Download the Process Infographics template for PowerPoint or Google Slides to get the most out of infographics. Whether you want to organize your business budget in a table or schematically analyze your sales over the past year, this set of infographic resources will be of great help. Start using infographics...

Download the Exercise Infographics template for PowerPoint or Google Slides and discover the power of infographics. An infographic resource gives you the ability to showcase your content in a more visual way, which will make it easier for your audience to understand your topic. Slidesgo infographics like this set here...
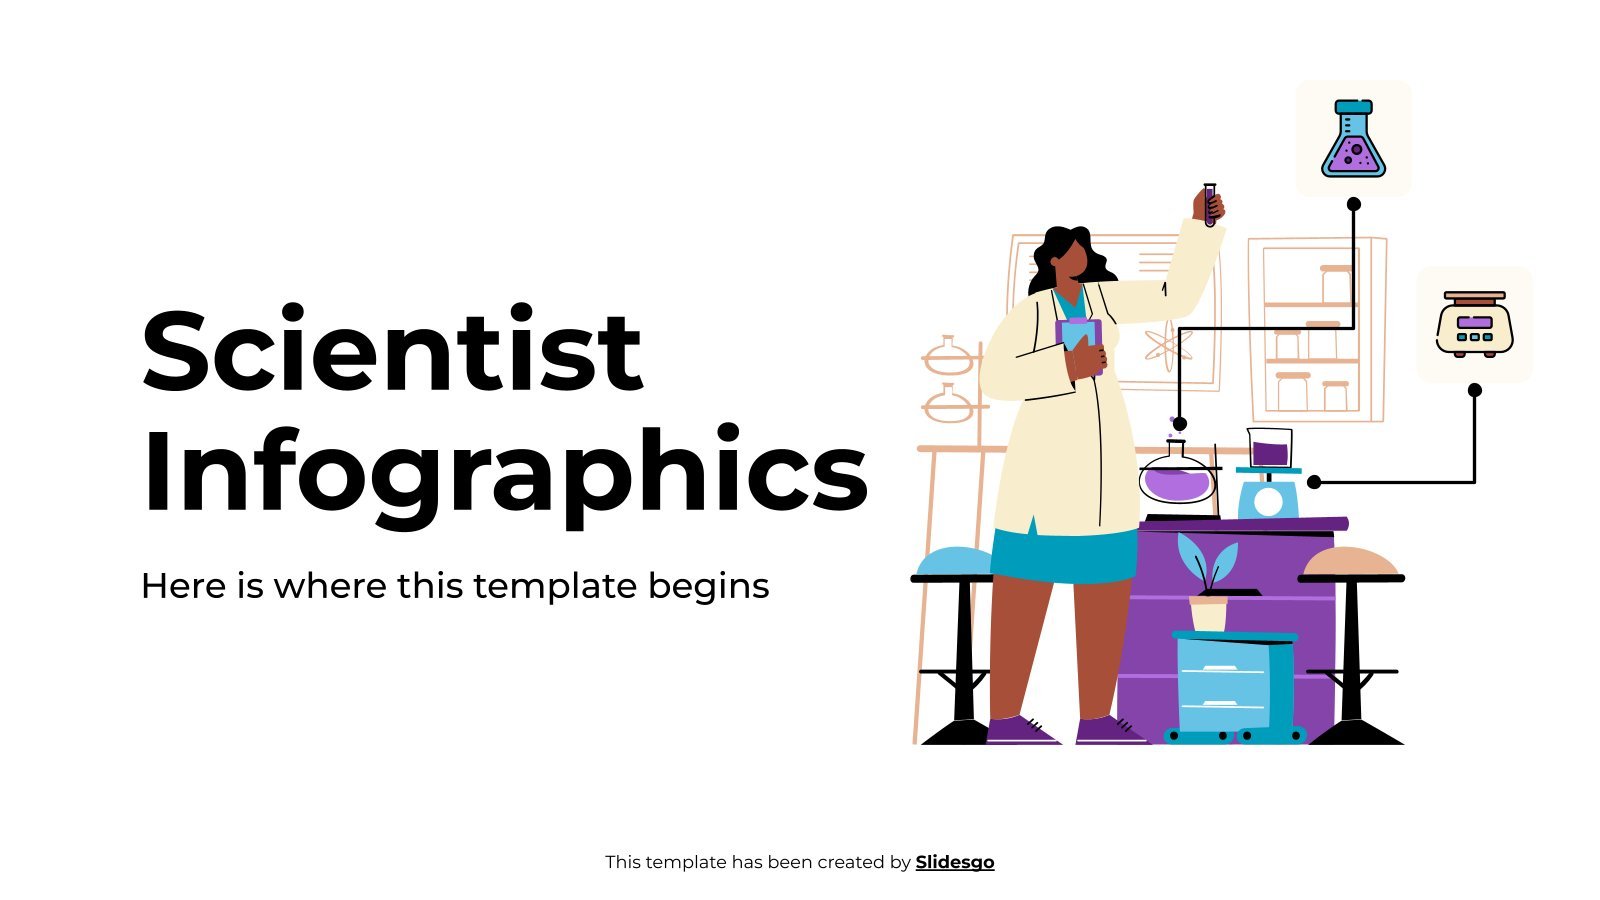
Download the Scientist Infographics template for PowerPoint or Google Slides and discover the power of infographics. An infographic resource gives you the ability to showcase your content in a more visual way, which will make it easier for your audience to understand your topic. Slidesgo infographics like this set here...

Times are changing and the styles in graphic design evolve, transform, bifurcate... Sometimes, even retro styles come back to life again! In this case, we wanted a modern approach: a set of infographic timelines whose style reflects current preferences. Suffice to say, the layouts depict different ideas on how to...

Download the Compost Infographics template for PowerPoint or Google Slides and discover the power of infographics. An infographic resource gives you the ability to showcase your content in a more visual way, which will make it easier for your audience to understand your topic. Slidesgo infographics like this set here...

These infographics will get your content moving! That’s right, they are all animated and will make you speak about different processes or timelines an easy task. Don’t hesitate to download them and edit them, time flies, and so do these creative designs full of color and creativity! In the template...

Download the "Timeline Infographics" template for PowerPoint or Google Slides and discover the power of infographics. An infographic resource gives you the ability to showcase your content in a more visual way, which will make it easier for your audience to understand your topic. Slidesgo infographics like this set here...