Cycle Infographics Presentation templates - Page 5
Things come and go, and sometimes they come and go again, and come and go again, in aeternum. That's how cycles work, and that's either the type or the theme of the editable infographics that we have here for your Google Slides and PowerPoint presentations. Customize any of them to your liking and then download another template. Customize it to your liking and then download another template again. And again. And again...

It seems that you like this template!

Register for free and start downloading now
Download the "Icons Infographics" template for PowerPoint or Google Slides and discover the power of infographics. An infographic resource gives you the ability to showcase your content in a more visual way, which will make it easier for your audience to understand your topic. Slidesgo infographics like this set here...
Download the "Agriculture Infographics" template for PowerPoint or Google Slides and discover the power of infographics. An infographic resource gives you the ability to showcase your content in a more visual way, which will make it easier for your audience to understand your topic. Slidesgo infographics like this set here...

Download the "Cycle Diagrams Theme for Marketing" presentation for PowerPoint or Google Slides and take your marketing projects to the next level. This template is the perfect ally for your advertising strategies, launch campaigns or report presentations. Customize your content with ease, highlight your ideas and captivate your audience with...

Is it time to power up your presentations by adding some visual content that keeps your audience focused on your speech? Let us stress the running theme of this set of infographics: time! There are thirty different designs of clocks and stopwatches, along with other colorful resources. Business, marketing, education......

Download the "Marketing Plan with Cycle Diagrams" presentation for PowerPoint or Google Slides. This incredible template is designed to help you create your own marketing plan that is sure to impress your entire team. Using this amazing tool, you'll be able to analyze your target audience, assess your competitors, map...

Download the "Cycle Diagrams Theme for Marketing" presentation for PowerPoint or Google Slides and take your marketing projects to the next level. This template is the perfect ally for your advertising strategies, launch campaigns or report presentations. Customize your content with ease, highlight your ideas and captivate your audience with...

Download the "Agile Infographics" template for PowerPoint or Google Slides and discover the power of infographics. An infographic resource gives you the ability to showcase your content in a more visual way, which will make it easier for your audience to understand your topic. Slidesgo infographics like this set here...

Squares are shapes that are tied to order, good organization, symmetry. With these infographics, you can visually explain concepts and compare items with ease. Some designs borrow elements from calendars, processes and pricing tables, apart from other usual graphs, such as cycle diagrams or Gantt charts.
There’s lots of pedagogical theories that back up the idea that visual learning holds an important role in the development of schooler’s mental and analytical abilities. That is why using infographics in your lessons, regardless of which lesson it is, is a great choice. Maths, history, language, geography… data always...

Download the Idea Infographics template for PowerPoint or Google Slides to get the most out of infographics. Whether you want to organize your business budget in a table or schematically analyze your sales over the past year, this set of infographic resources will be of great help. Start using infographics...
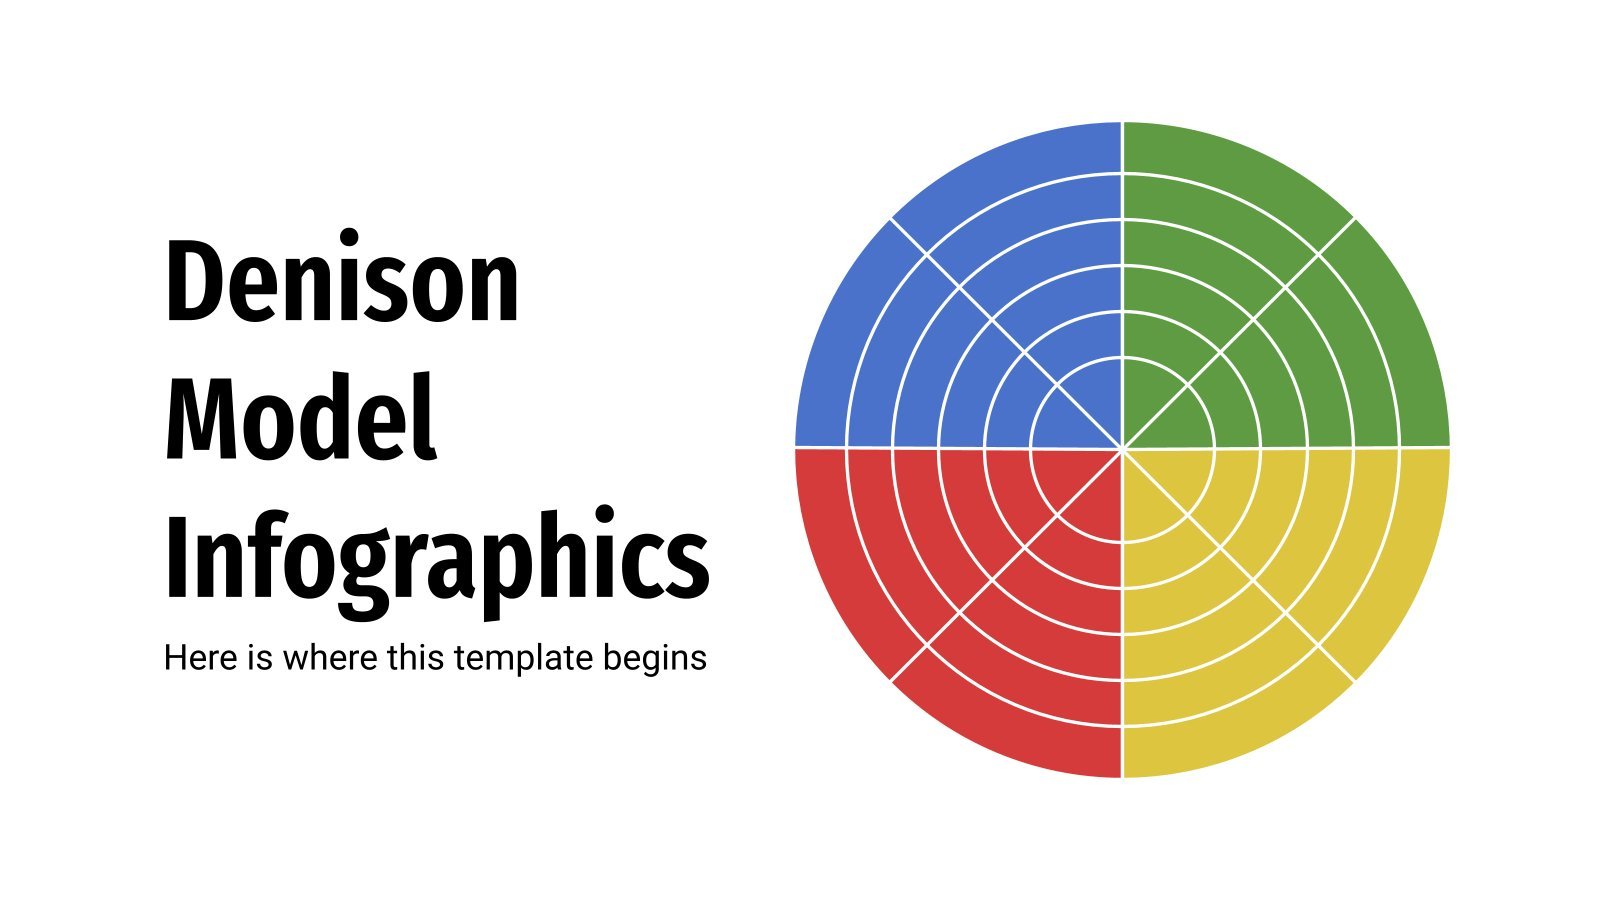
The Denison model is based on the research of Dr. Daniel Denison, who related organizational culture to certain business performance indicators. Both must be aligned to achieve business objectives. This template includes dozens of graphs and flat style infographics related to this model, which analyzes four key company factors: adaptability,...

Download the Effective Mind Maps Infographics template for PowerPoint or Google Slides to get the most out of infographics. Whether you want to organize your business budget in a table or schematically analyze your sales over the past year, this set of infographic resources will be of great help. Start...

Download the "Creating Infographics" template for PowerPoint or Google Slides and discover the power of infographics. An infographic resource gives you the ability to showcase your content in a more visual way, which will make it easier for your audience to understand your topic. Slidesgo infographics like this set here...

It's the cycle of life: people are born, they grow up, they become old and finally they pass away. These stages in the life of a person are different: our priorities vary depending on our age, and the experience that we accumulate as we grow older becomes a useful resource...

Download the Marketing Theme with Cycle Diagrams presentation for PowerPoint or Google Slides and take your marketing projects to the next level. This template is the perfect ally for your advertising strategies, launch campaigns or report presentations. Customize your content with ease, highlight your ideas and captivate your audience with...

Some things have a beginning, an ending and some steps in between, and then they start again, following the same steps endlessly. That's how cycles are, and there are many ways of representing them in a visual manner. Get inspired by this design and see if it fits your needs!...

Download the Annual Business Goal Infographics template for PowerPoint or Google Slides to get the most out of infographics. Whether you want to organize your business budget in a table or schematically analyze your sales over the past year, this set of infographic resources will be of great help. Start...

Some things have a beginning, an ending and some steps in between, and then they start again, following the same steps endlessly. That's how cycles are, and there are many ways of representing them in a visual manner. Get inspired by this design and see if it fits your needs!...