Cycle Infographics Presentation templates - Page 4
Things come and go, and sometimes they come and go again, and come and go again, in aeternum. That's how cycles work, and that's either the type or the theme of the editable infographics that we have here for your Google Slides and PowerPoint presentations. Customize any of them to your liking and then download another template. Customize it to your liking and then download another template again. And again. And again...


It seems that you like this template!

Register for free and start downloading now
Make your sales strategy understandable and impress everyone with this business template. Use the different infographics to explain the whole process from start to finish. Show all the different elements of the sales procedure and how they interact with each other and indicate the goals and deadlines of your plan.

Let’s say you need to talk about five steps of your project or list exactly five elements in order of importance. Good, then use these infographics. They’re layered out in a sequence so you can describe a process over time, but there’s also some pyramids to sort things from the...

Download the "Cycle Diagrams Theme for a Business Plan" presentation for PowerPoint or Google Slides. Conveying your business plan accurately and effectively is the cornerstone of any successful venture. This template allows you to pinpoint essential elements of your operation while your audience will appreciate the clear and concise presentation,...

Download the "Cycle Diagrams Theme for a Case Report" presentation for PowerPoint or Google Slides. A clinical case is more than just a set of symptoms and a diagnosis. It is a unique story of a patient, their experiences, and their journey towards healing. Each case is an opportunity for...
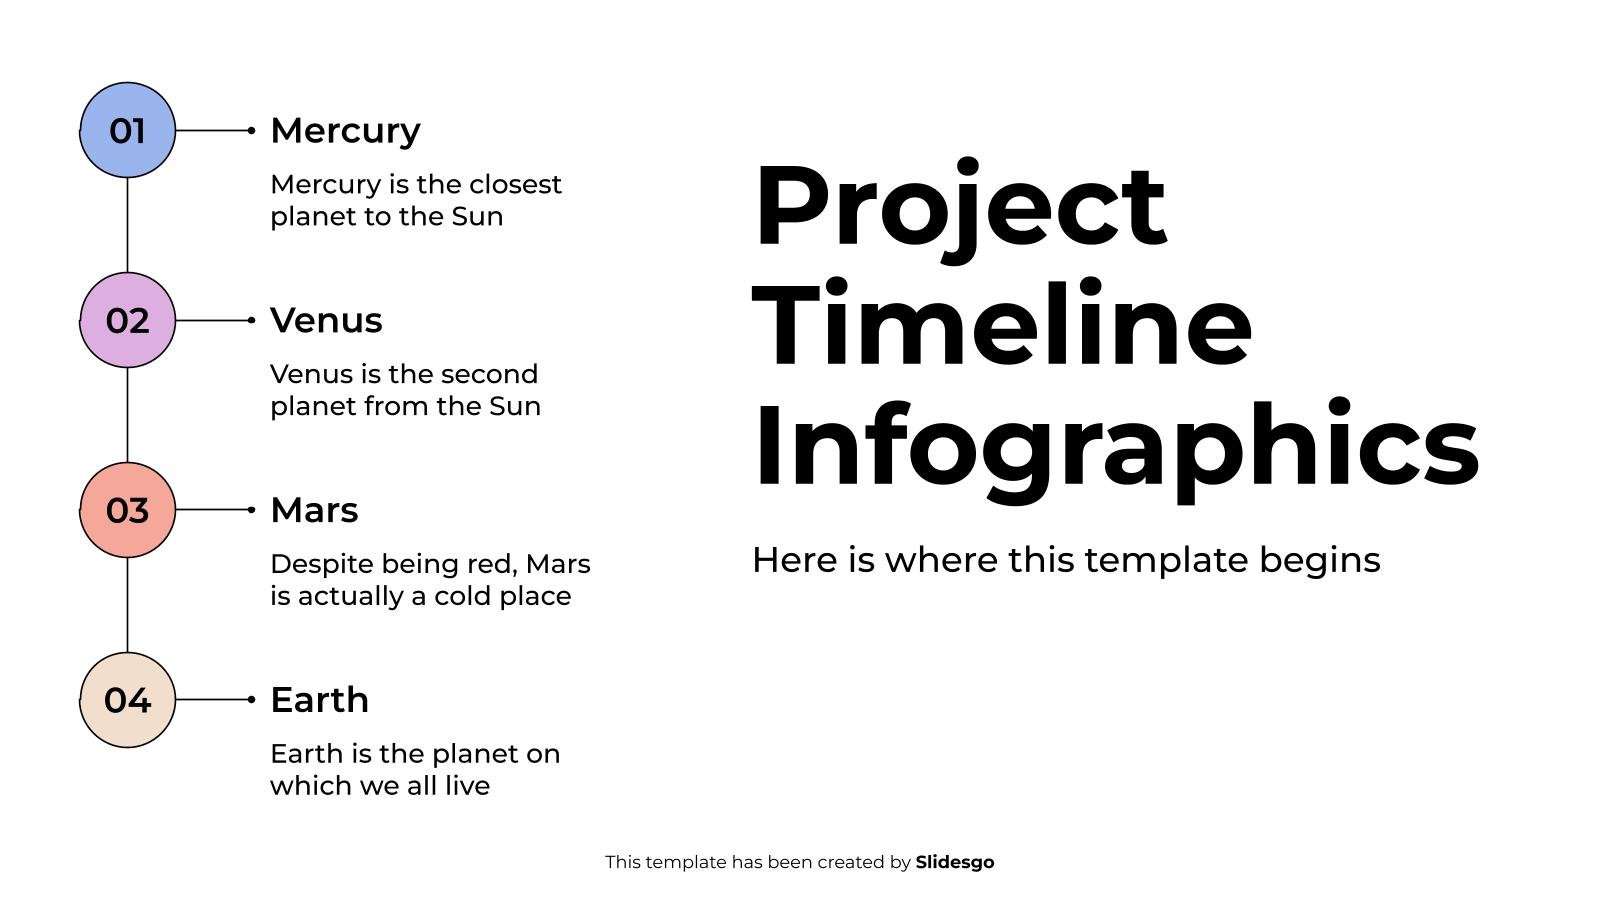
Download the Project Timeline Infographics template for PowerPoint or Google Slides to get the most out of infographics. Whether you want to organize your business budget in a table or schematically analyze your sales over the past year, this set of infographic resources will be of great help. Start using...

This pack of infographics is intended for marketing gurus. We propose several ways of representing data within several well-known frameworks in marketing. If “PESTLE”, “SWOT” or “7S” sound familiar to you, do not hesitate to download this template and start editing the contents with some campaign results or analyses!

Download the "Cycle Diagrams Theme for a Pitch Deck" presentation for PowerPoint or Google Slides. Whether you're an entrepreneur looking for funding or a sales professional trying to close a deal, a great pitch deck can be the difference-maker that sets you apart from the competition. Let your talent shine...
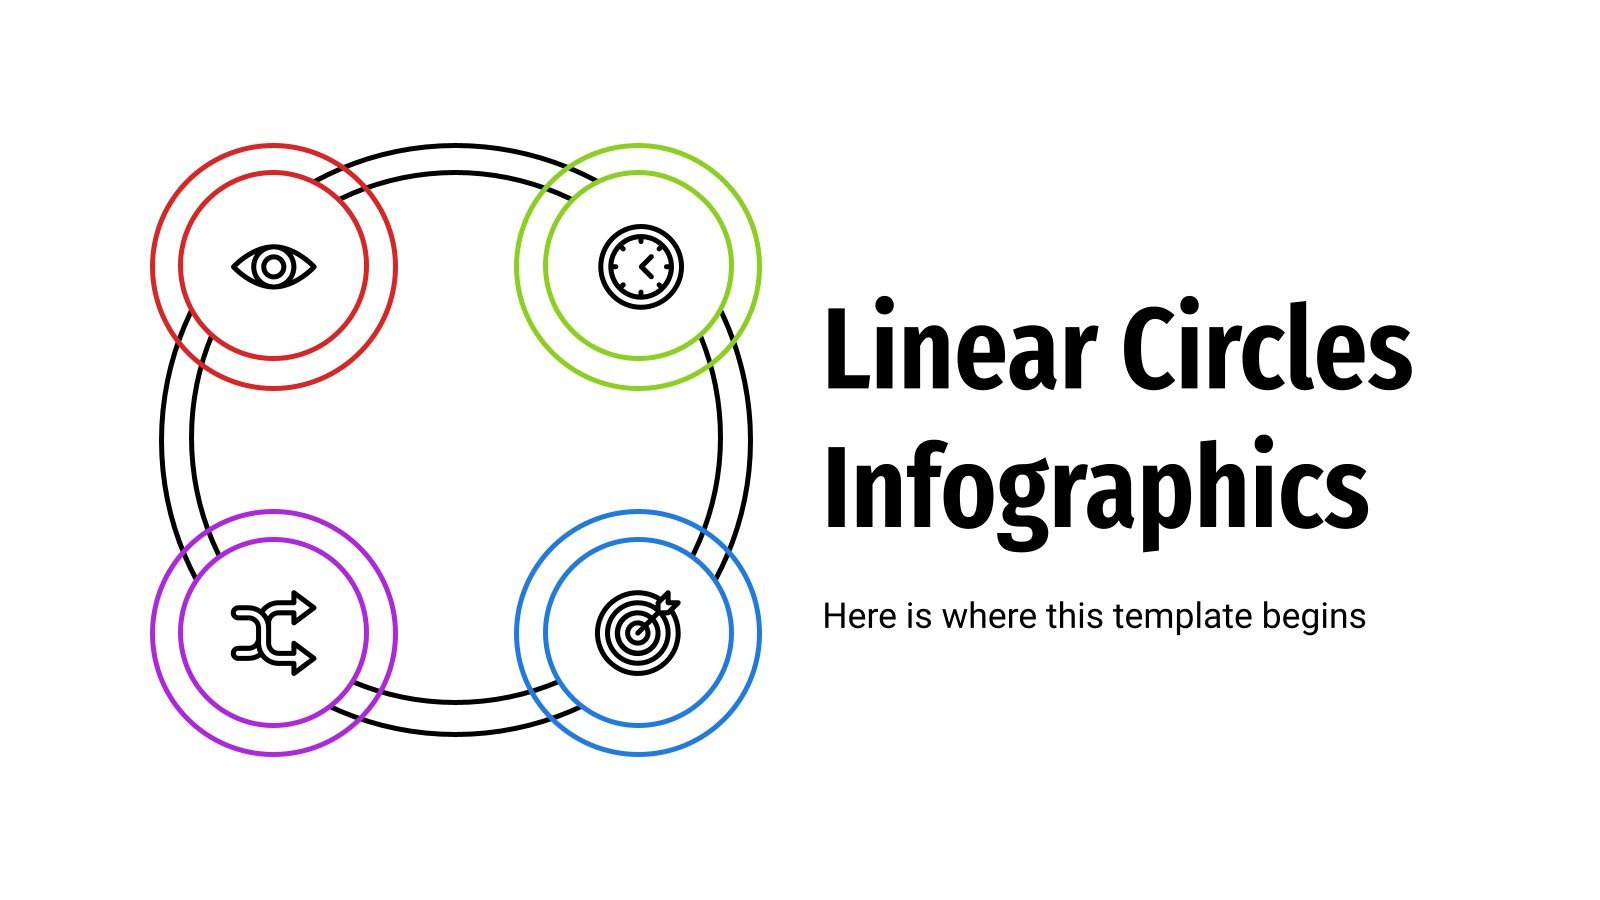
This set of infographics is the perfect way of representing fractions, parts of processes or products. Every single slide includes lots of colorful circles that will make it easier for you to illustrate your content in a creative way that your clients, superiors or co-workers will have never seen before....

Let's say we have magma (in a bottle or something, don't ask). When it freezes and crystallizes, it becomes an igneous rock. And if you let that rock erode, you get a sedimentary rock. And... well, we're not going to spoil the entire rock cycle. That's up to you, but...

Download the Workshop with Cycle Diagrams presentation for PowerPoint or Google Slides. If you are planning your next workshop and looking for ways to make it memorable for your audience, don’t go anywhere. Because this creative template is just what you need! With its visually stunning design, you can provide...

Download the College Lessons with Cycle Diagrams presentation for PowerPoint or Google Slides. As university curricula increasingly incorporate digital tools and platforms, this template has been designed to integrate with presentation software, online learning management systems, or referencing software, enhancing the overall efficiency and effectiveness of student work. Edit this...

Bicycles are the favorite choice of people whose priority is ecology and sustainability. This means of transport doesn't pollute and, with a bit of care, can last for years without replacement! Today, with the help of the infographics included in this template, you can promote your own products related to...

The infinity loop is one of the most recognized symbols worldwide. In this template we give you numerous alternatives to use it in different types of graphics. You can use them to explain sequential processes visually and with different styles in which you can include more or less information depending...

What you'll find in this new template is a collection of infographics of the Six Sigma strategy, one of the best tools for process improvement. Our designs make use of gradients and come with five elements in order to represent the DMAIC methodology (Define, Measure, Analyze, Improve and Control). This...

Download the "Cycle Diagrams Theme for Marketing" presentation for PowerPoint or Google Slides and take your marketing projects to the next level. This template is the perfect ally for your advertising strategies, launch campaigns or report presentations. Customize your content with ease, highlight your ideas and captivate your audience with...

Download the Roadblock Slideshow Infographics template for PowerPoint or Google Slides to get the most out of infographics. Whether you want to organize your business budget in a table or schematically analyze your sales over the past year, this set of infographic resources will be of great help. Start using...

Download the Elementary Lesson with Cycle Diagrams presentation for PowerPoint or Google Slides and easily edit it to fit your own lesson plan! Designed specifically for elementary school education, this eye-catching design features engaging graphics and age-appropriate fonts; elements that capture the students' attention and make the learning experience more...

As a project management tool, these RAID infographics can help you cover multiple concepts at a glance in your presentation. Of course, all our designs, from graphs to Gantt charts, contain four elements: Risks, Assumptions, Issues and Dependencies. Some of them will surprise you, like the one with a 3D...