Business Infographics Presentation templates - Page 18
Thinking about new techniques to improve your company performance? Try our effective infographics for Google Slides and PowerPoint and present your data and results easily!


It seems that you like this template!

Register for free and start downloading now
You're in the meadows, looking at the flowers and their beautiful petals and... suddenly, they start talking to you about competitors and business! Sounds like a dream, but we can make it true! This template contains thirty designs of the so-called "petal diagrams", whose name says it all. You can...
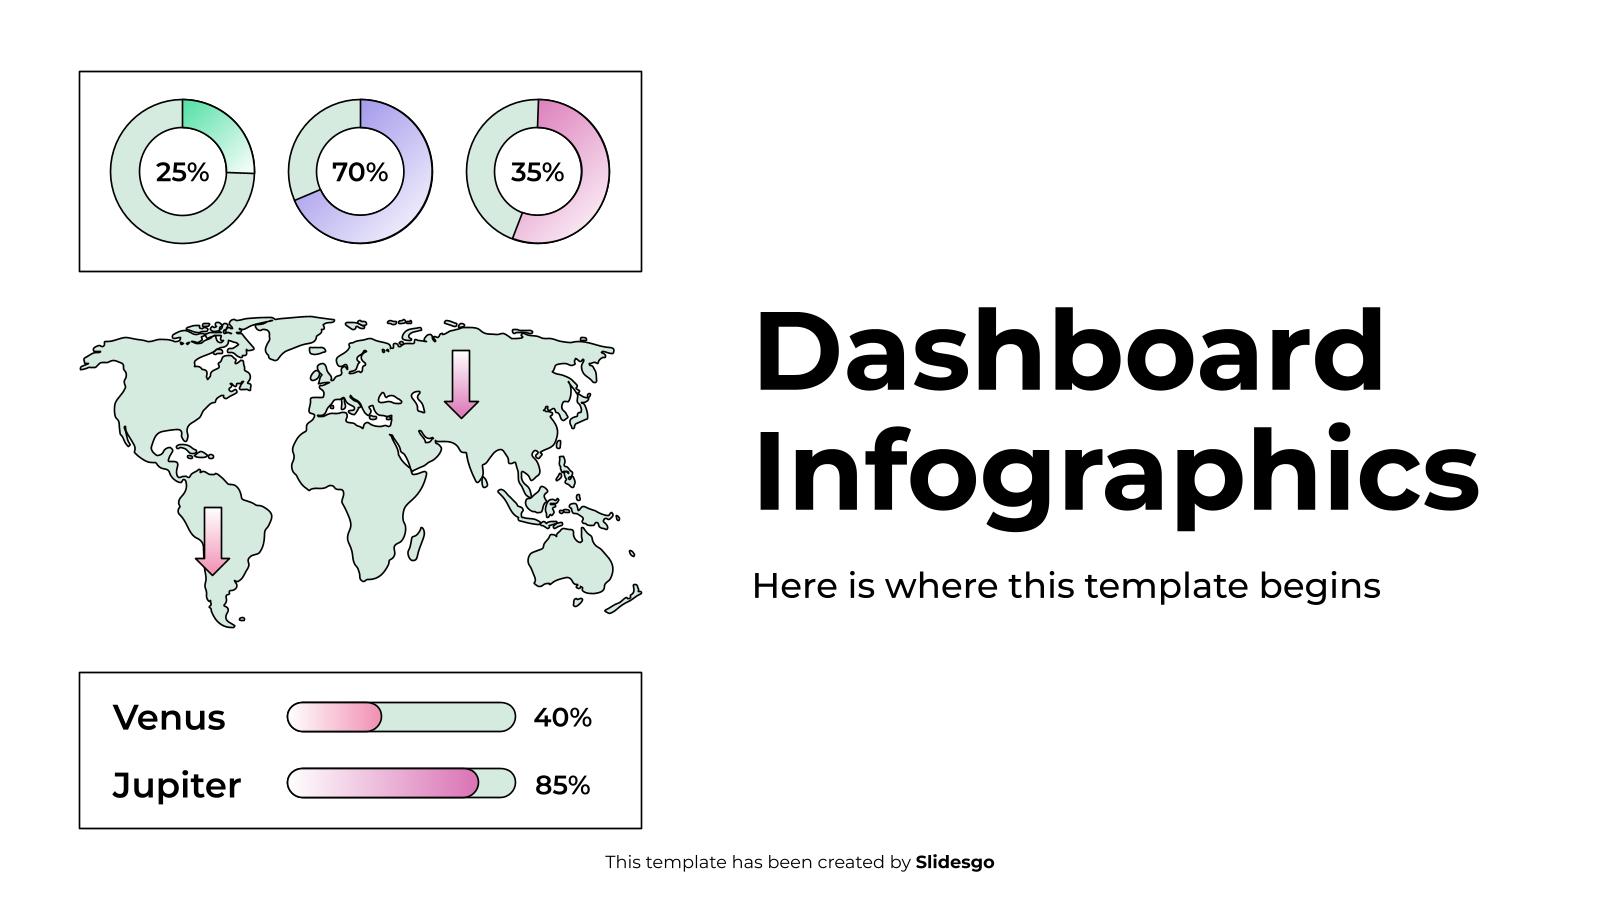
Download the Dashboard Infographics template for PowerPoint or Google Slides to get the most out of infographics. Whether you want to organize your business budget in a table or schematically analyze your sales over the past year, this set of infographic resources will be of great help. Start using infographics...

Download the Visual Comparison Infographics template for PowerPoint or Google Slides to get the most out of infographics. Whether you want to organize your business budget in a table or schematically analyze your sales over the past year, this set of infographic resources will be of great help. Start using...

An environmental scanning is the tool used by companies to obtain competitive advantages, track changes in the market and adapt objectives and strategies according to the changing conditions in their environment. To make this analysis easier for you, we have designed a presentation with 32 different infographics that will help...

These Google Slides and PowerPoint infographics offer a fresh, impeccable watercolor look that can take your project proposals to the next level! Not only can they be easily customized to suit your content, but they also provide a variety of resources to help you present your information elegantly and understandably....

Transform your data into a visual masterpiece with the power of chart infographics! Forget about dull spreadsheets and create something truly unique and compelling. With templates like this one, the sky's the limit when it comes to creativity and customization. And the best part? You can adapt them to your...
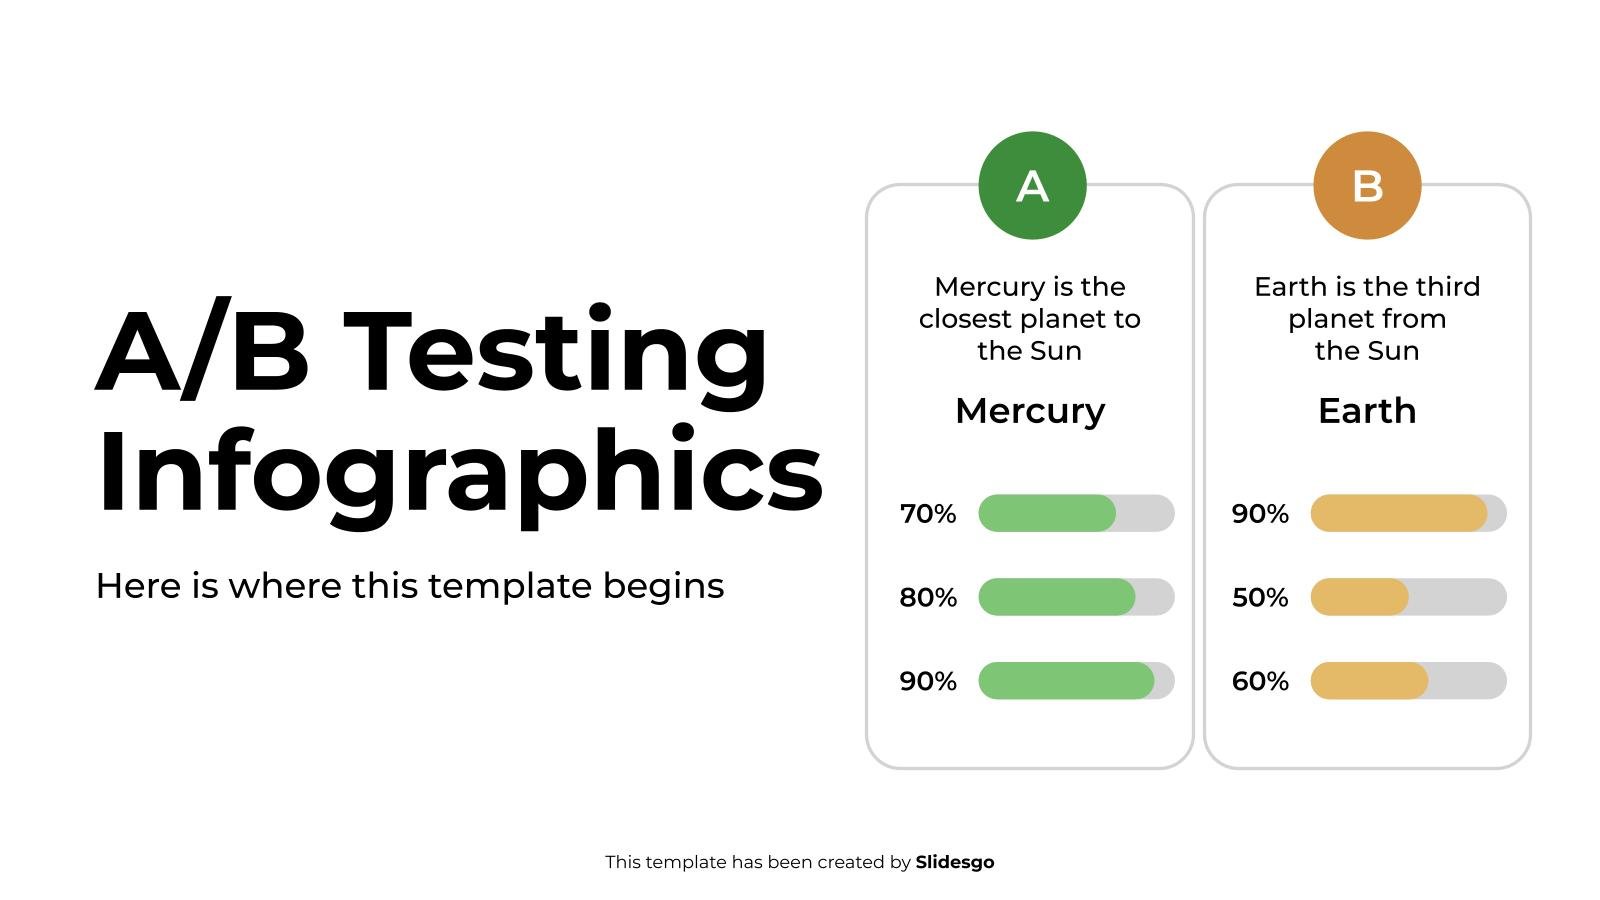
Download the A/B Testing Infographics template for PowerPoint or Google Slides to get the most out of infographics. Whether you want to organize your business budget in a table or schematically analyze your sales over the past year, this set of infographic resources will be of great help. Start using...

A good idea to keep track of your company’s success is making quarterly reviews. An even better idea is to present them with this set of illustrative infographics! These resources will make your business data come alive and will make it easier to explain where you come from, what the...

Looking for an effective way of displaying your business processes and flows? In Slidesgo, we have created spiral diagrams to help you. They are pretty useful to show, for example, cyclical steps. Give them a go and try the perks of using one of these diagrams.

This process is simple: first you discover this amazing template with infographics, then, you click on download. Do you know what happens next? Process maps are a great way of illustrating ideas that flow, changing options or different outcomes of a situation. With a set of infographics like this one,...

Do you have a good idea of how your customers look like and what their interests are? Then, show that buyer persona in an infographic, such as the ones included in this template. Being a powerful marketing resource for business, you can make it even more useful by adding illustrations...
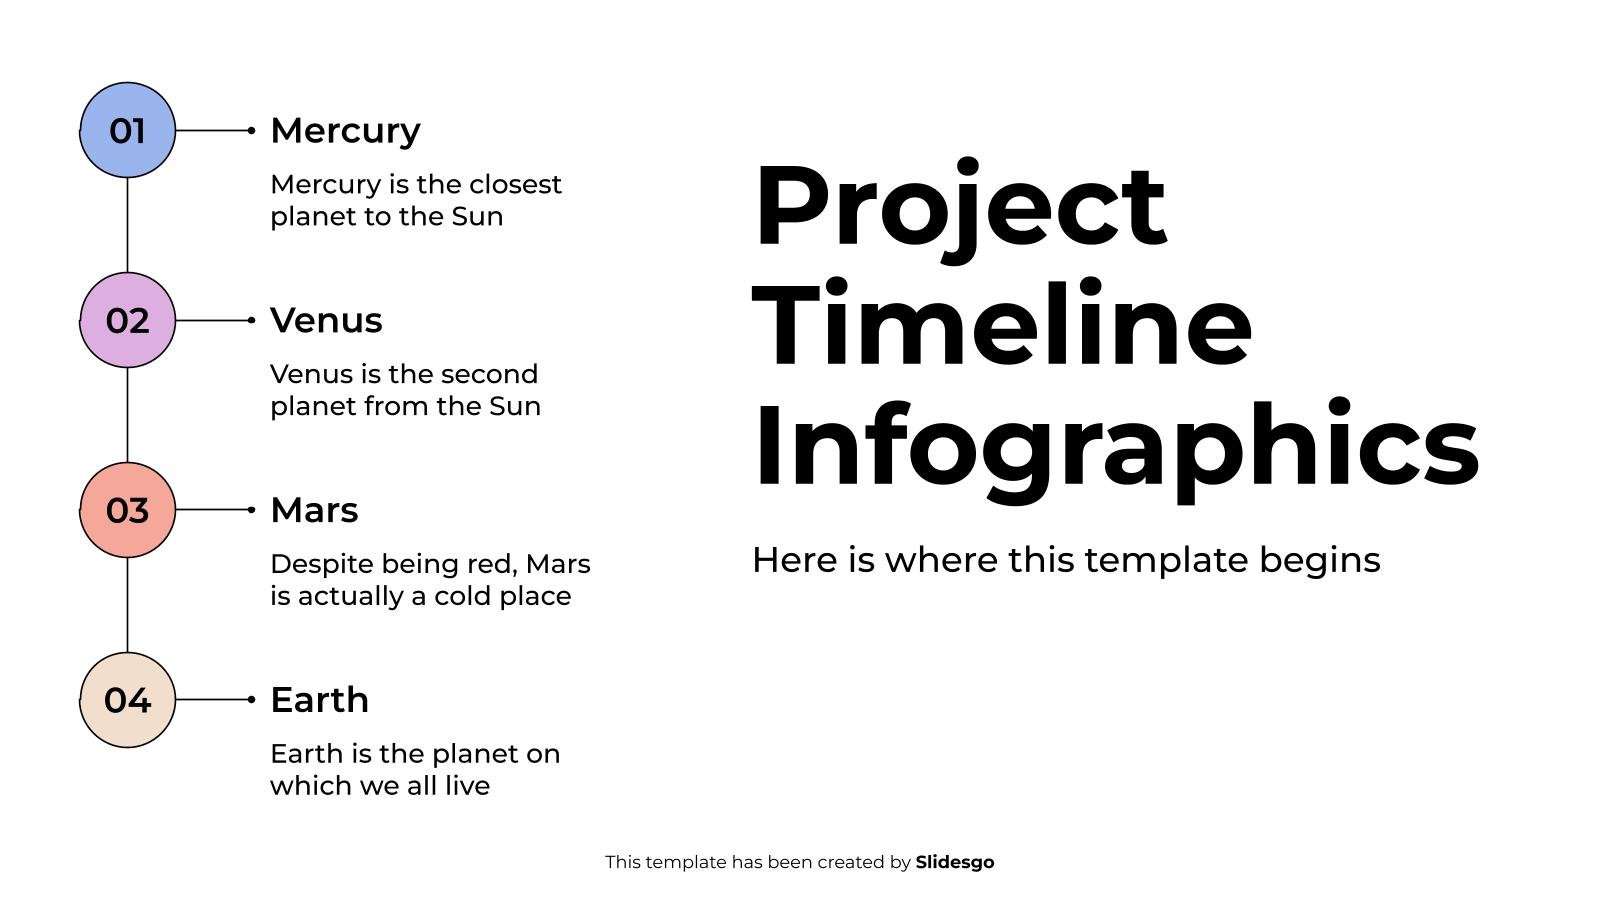
Download the Project Timeline Infographics template for PowerPoint or Google Slides to get the most out of infographics. Whether you want to organize your business budget in a table or schematically analyze your sales over the past year, this set of infographic resources will be of great help. Start using...

Wow, another year has gone by. 12 months full of sales, business, meetings, management, ideas… it was about time we make a review of our accomplishments, right? With this set of infographics, you can put your company’s performance in the spotlight! Speak about revenue, expenses, new employees or branches, new...

What you'll find in this new template is a collection of infographics of the Six Sigma strategy, one of the best tools for process improvement. Our designs make use of gradients and come with five elements in order to represent the DMAIC methodology (Define, Measure, Analyze, Improve and Control). This...

You and your coworkers are part of the same team, you must work together and along them so that they can develop their true potential and accompany them during their development in the company. By empowering them, you give them the tools and the room to develop themselves, become autonomous...

If we can define a "sale" as the transaction in which a product is obtained in exchange of money, what would a "sales process" be? As obvious as it may seem, there's much more to it than meets the eye. Customize these editable infographics and add them to your slideshows...

Mekko charts, also known as mosaic plots, are visual representations of data by using stacks of tiles in different colors. Some of our designs give more leeway and are combined with other types of graphs, such as bar charts. You’ll find borderless tiles, others with stroke and even hand-drawn elements.

Collaboration and cross-functional teams: that is what the Agile practices are about. Help your team better understand this concept by using our infographics, designed with variety and usability in mind. They are quite colorful, and you’ve got many styles to choose from: flat, fill, isometric or hand-drawn.