Business Infographics Presentation templates - Page 19
Thinking about new techniques to improve your company performance? Try our effective infographics for Google Slides and PowerPoint and present your data and results easily!

It seems that you like this template!
Register for free and start downloading now
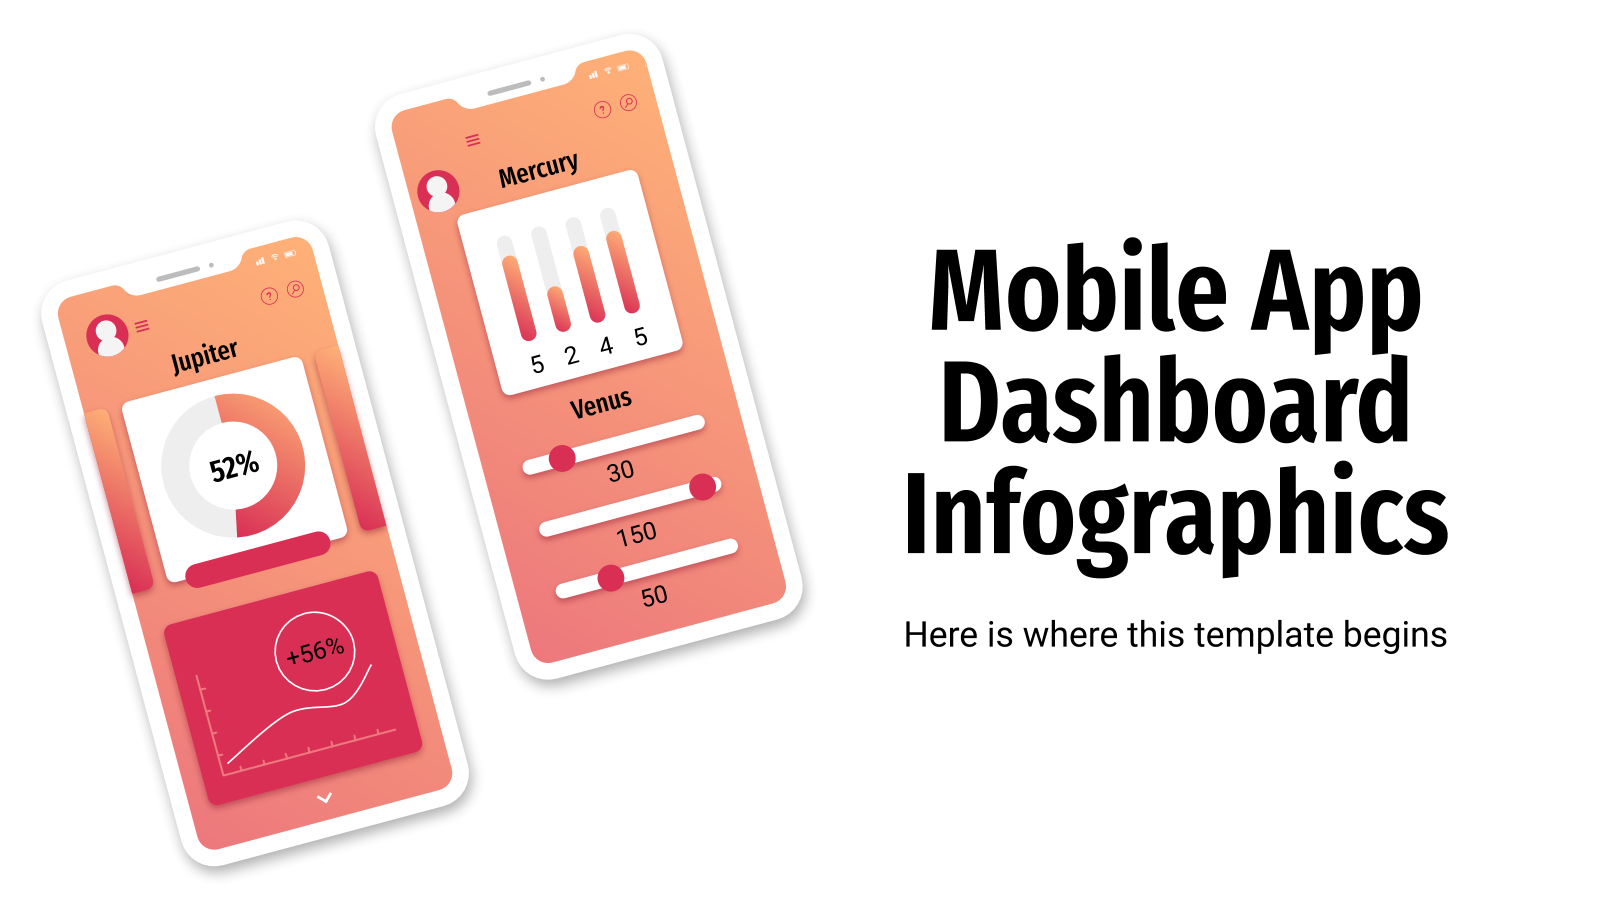
Do you want to be original when presenting information? Infographics are a powerful resource, but how about showing your data like if it were in a mobile app's dashboard? Complete with gauges, icons, gradients and silhouettes of cellphones, these designs will convey visually all the numbers, stats and key performance...
This set of infographics is a new creation for business-related presentations. Whenever you need to analyze a value chain so that your product reaches the market in a way that is desired by the customers or clients, try representing your data in these designs. From cycle diagrams to timelines and...
Download the "Cycle Diagrams Theme for a Business Plan" presentation for PowerPoint or Google Slides. Conveying your business plan accurately and effectively is the cornerstone of any successful venture. This template allows you to pinpoint essential elements of your operation while your audience will appreciate the clear and concise presentation,...
As a project management tool, these RAID infographics can help you cover multiple concepts at a glance in your presentation. Of course, all our designs, from graphs to Gantt charts, contain four elements: Risks, Assumptions, Issues and Dependencies. Some of them will surprise you, like the one with a 3D...
We're sure your team will appreciate some kind of visual tracker to see what tasks are already completed and what tasks need to be done. Slidesgo is happy to introduce this set of editable infographics for this exact purpose! You'll find different designs of tables and calendars where you can...
Download the "Cycle Diagrams Theme for a Project Proposal" presentation for PowerPoint or Google Slides. A well-crafted proposal can be the key factor in determining the success of your project. It's an opportunity to showcase your ideas, objectives, and plans in a clear and concise manner, and to convince others...
Competition is fierce in almost any field, so you must go always one step ahead of other companies. With this set of infographics, you can add to your slideshow a representation of Porter's 5 Forces framework, consisting of "Threat of new entrants", "Threat of substitutes", "Buyer power", "Supplier power" and...
Download the Dancing Social Media Platform Business Plan Infographics template for PowerPoint or Google Slides and discover the power of infographics. An infographic resource gives you the ability to showcase your content in a more visual way, which will make it easier for your audience to understand your topic. Slidesgo...
Download the Glasses Brand Project Proposal Infographics template for PowerPoint or Google Slides and discover the power of infographics. An infographic resource gives you the ability to showcase your content in a more visual way, which will make it easier for your audience to understand your topic. Slidesgo infographics like...
If we can define a "sale" as the transaction in which a product is obtained in exchange of money, what would a "sales process" be? As obvious as it may seem, there's much more to it than meets the eye. Customize these editable infographics and add them to your slideshows...
To know where to focus the product and identify customer needs, one of the most useful marketing techniques to employ is the customer journey. Through this process, you identify an area where the ideal customer profile (the buyer persona) has a need and start working from there. To help you...
2023 has already begun and with it many tasks and projects to plan. Although that will not be a problem, because now thanks to this set of infographics you will be able to plan and organize everything related to your company, making this year productivity does not stop increasing. Among...
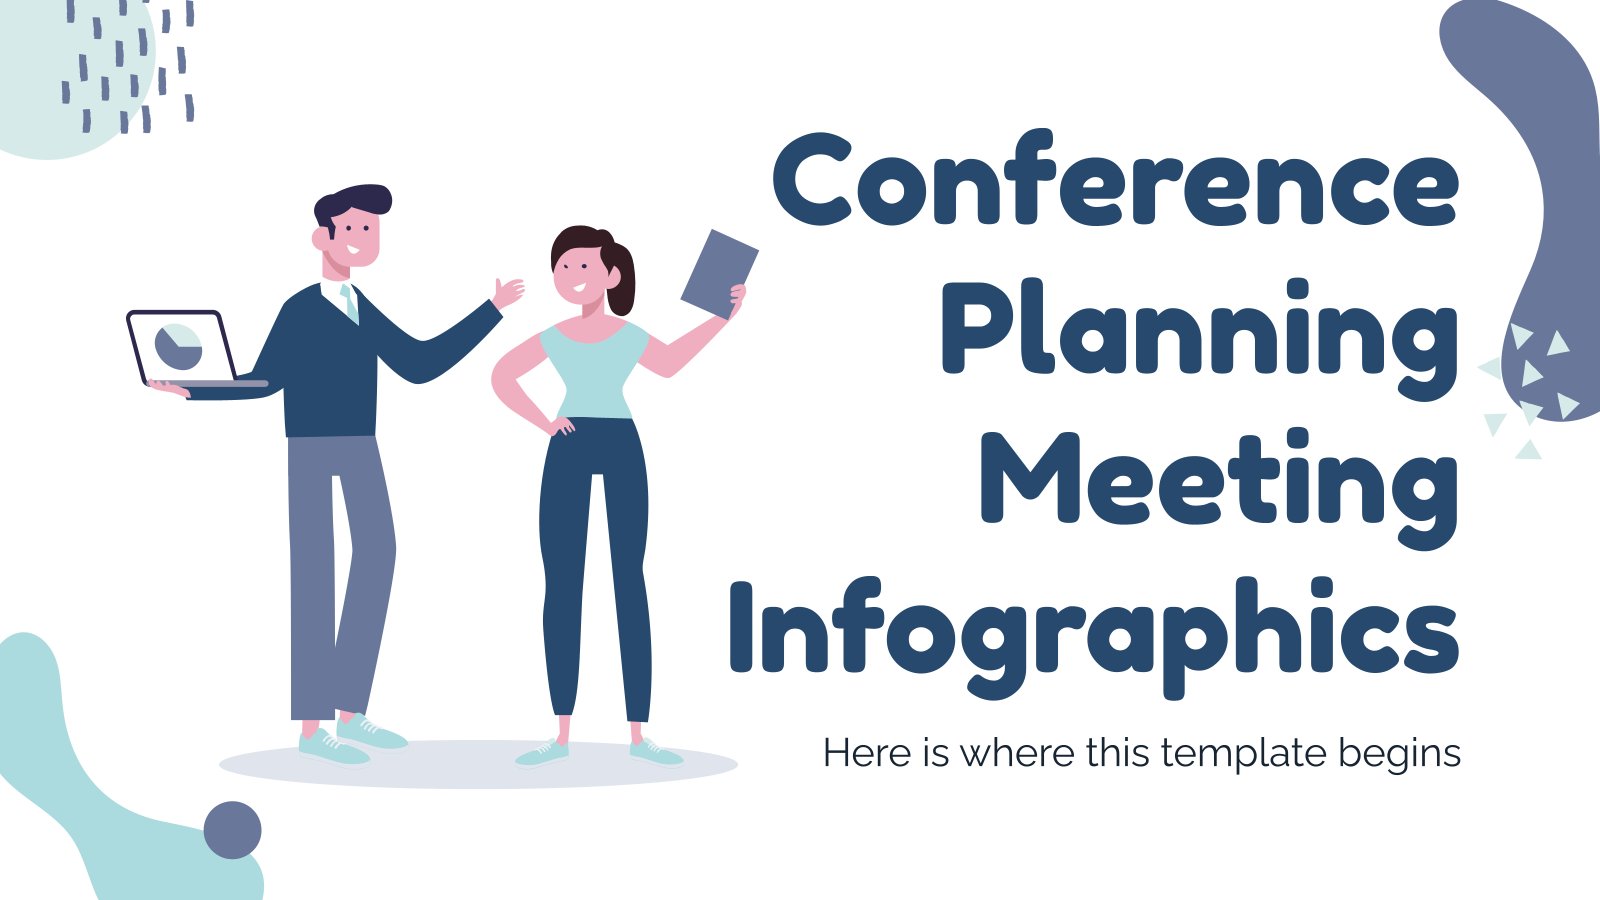
Is there anything more stressful than planning a whole conference? Not that we can think of, really… but on the plus side, we’ve figured out a way to make your conference planning meeting a good bit less tedious: This collection of infographics specifically designed around everything that needs to be...
Biodata is, to put it simply, information about life, work experience and education of a certain person. Do you think that this can be useful for recruiting processes or when choosing who to order a commission? These infographics are, firstly, totally customizable, and secondly, ideal for showing profiles with biodata....
Infographics? Business analysis framework? Hmmmm, these are two concepts that are meant to be... at least when it comes to templates by Slidesgo! This set focuses on VRIO, a framework that poses four questions about Value, Rarity, Imitability, and Organization. These four questions are an important part of each of...
Download the Christmas Lights Installation Company Infographics template for PowerPoint or Google Slides and discover the power of infographics. An infographic resource gives you the ability to showcase your content in a more visual way, which will make it easier for your audience to understand your topic. Slidesgo infographics like...
Download the Community Bank Business Plan Infographics template for PowerPoint or Google Slides and discover the power of infographics. An infographic resource gives you the ability to showcase your content in a more visual way, which will make it easier for your audience to understand your topic. Slidesgo infographics like...
Flowcharts are representations of a process or a workflow, and we know that including one in your presentations can be a good idea. All the designs are in linear style, which means that shapes have no color fill, only stroke. Give them a try!


