Business Infographics Presentation templates - Page 17
Thinking about new techniques to improve your company performance? Try our effective infographics for Google Slides and PowerPoint and present your data and results easily!


It seems that you like this template!

Register for free and start downloading now
Is it time to check out how well a project is faring so far? To make it visually appealing, try our infographics. Your reports will look amazing with these designs, which make use of traffic lights or status bars to represent the different stages and their current status. Everything is...

It's the time to explain to the world what the most important strategies companies are using in today's business world! We have designed around thirty designs with infographics and other kinds of graphs or data representations, with lots of colors, to help you convey in your slides what works and...
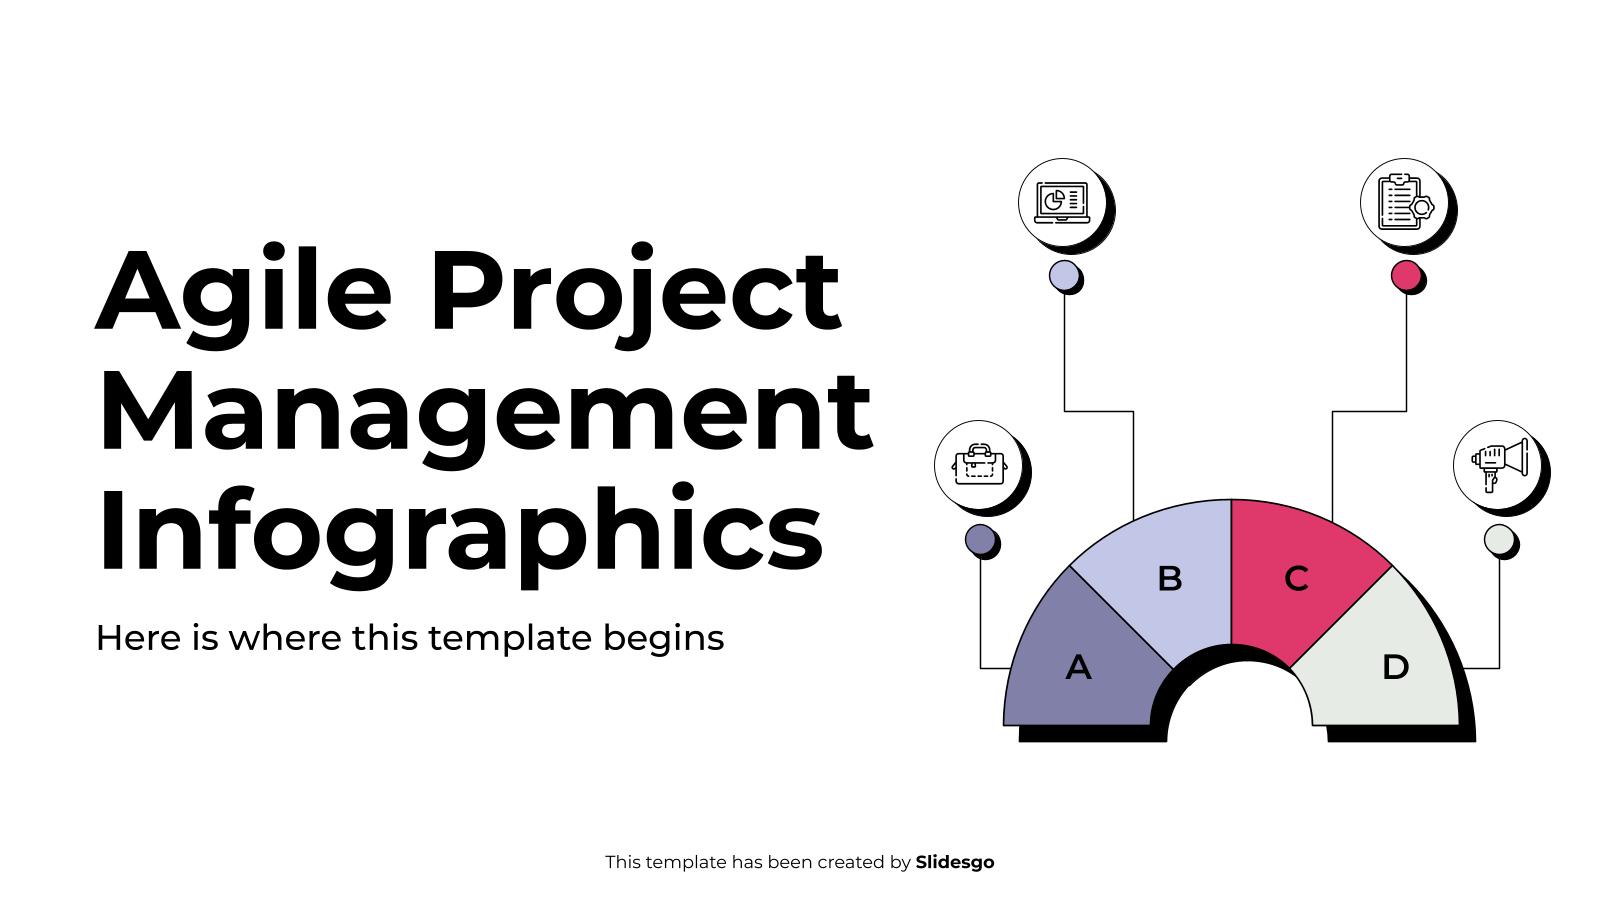
Download the Agile Project Management Infographics template for PowerPoint or Google Slides to get the most out of infographics. Whether you want to organize your business budget in a table or schematically analyze your sales over the past year, this set of infographic resources will be of great help. Start...

Transform your data into a visual masterpiece with the power of chart infographics! Forget about dull spreadsheets and create something truly unique and compelling. With templates like this one, the sky's the limit when it comes to creativity and customization. And the best part? You can adapt them to your...
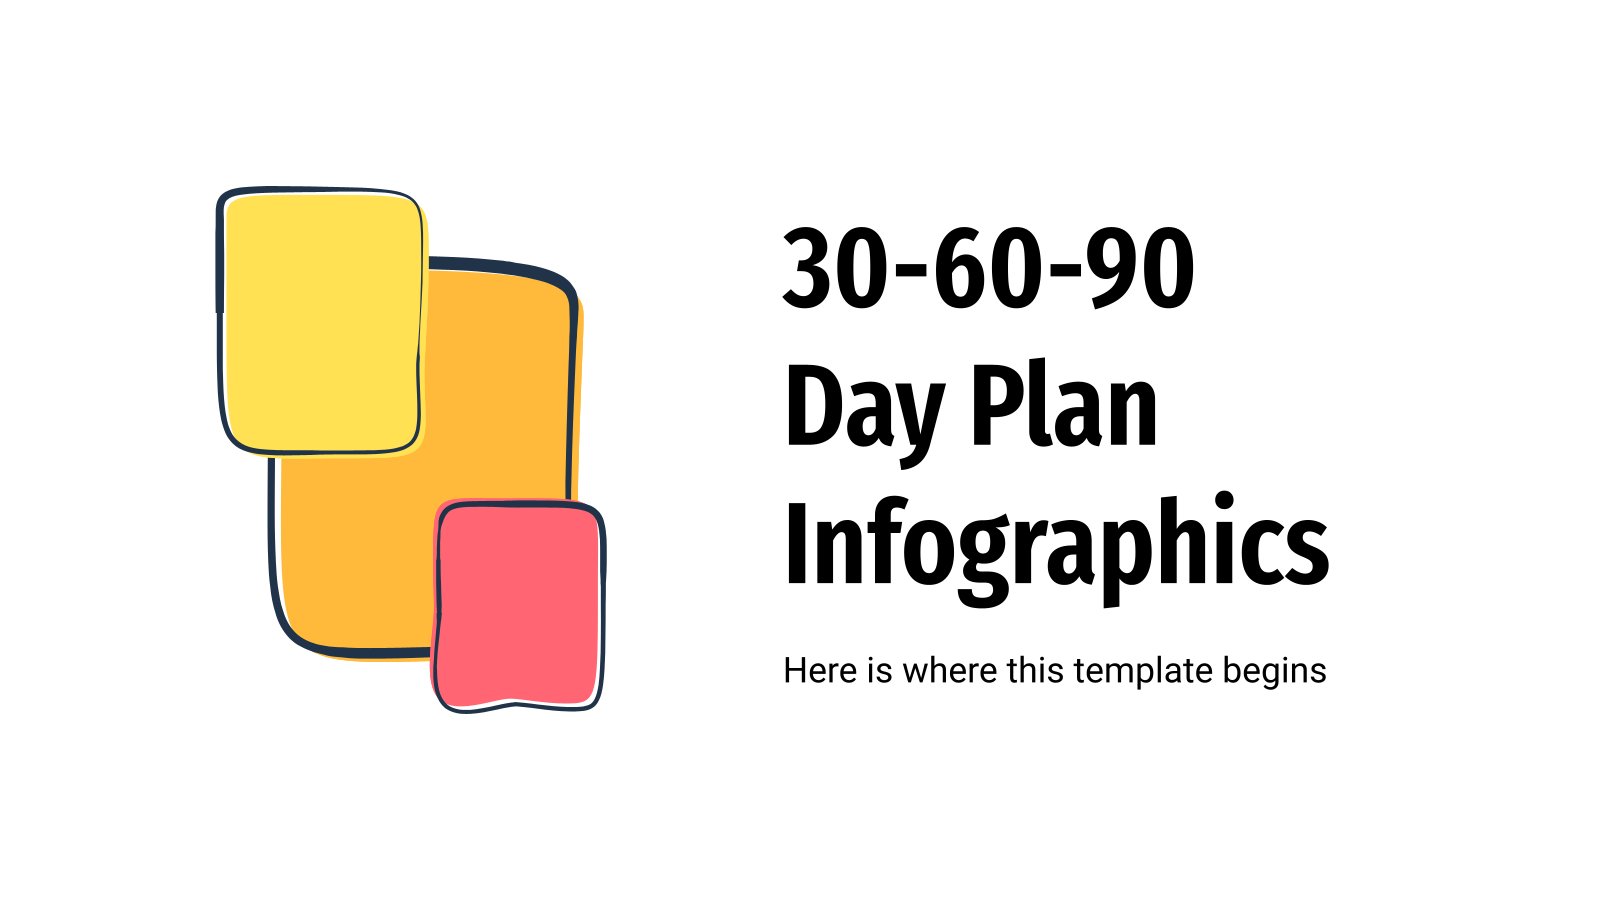
Are you looking for a way to represent a 30-, 60- or a 90-day process in a visual manner so it is understandable for your audience? We're bringing you some flat, semi-flat and doodle-like designs depicting different types of infographics. Arrows, tables and other extra resources are also provided for...

Download the AI Tech Infographics template for PowerPoint or Google Slides to get the most out of infographics. Whether you want to organize your business budget in a table or schematically analyze your sales over the past year, this set of infographic resources will be of great help. Start using...

Download the KPI Finances Infographics template for PowerPoint or Google Slides to get the most out of infographics. Whether you want to organize your business budget in a table or schematically analyze your sales over the past year, this set of infographic resources will be of great help. Start using...

Do you need some inspiration in order to display some information in hierarchical order? These new free infographics will help you define what’s on top and what’s below it. Organizational charts, funnels, pyramid diagrams and radial charts are supplied, and the styles are quite varied too, including flat, fill, and...

Know your market a bit better and adapt your marketing strategies and products to your potential buyers with the help of these infographics. There are many kinds of designs here—including radial graphs, cycle charts and pyramid diagrams—and a colorful palette to effectively show the market segmentation to the rest of...

As a project management tool, these RAID infographics can help you cover multiple concepts at a glance in your presentation. Of course, all our designs, from graphs to Gantt charts, contain four elements: Risks, Assumptions, Issues and Dependencies. Some of them will surprise you, like the one with a 3D...

Download the Stock Market Infographics template for PowerPoint or Google Slides to get the most out of infographics. Whether you want to organize your business budget in a table or schematically analyze your sales over the past year, this set of infographic resources will be of great help. Start using...

Download the Roadblock Slideshow Infographics template for PowerPoint or Google Slides to get the most out of infographics. Whether you want to organize your business budget in a table or schematically analyze your sales over the past year, this set of infographic resources will be of great help. Start using...

Download the Architect Infographics template for PowerPoint or Google Slides to get the most out of infographics. Whether you want to organize your business budget in a table or schematically analyze your sales over the past year, this set of infographic resources will be of great help. Start using infographics...

The recruitment process and job finding in general has changed drastically due to the pandemic and now everything happens online. For some, this is a new world they need to adapt to and having someone explain it to them with a visual infographic is going to be very appreciated! Use...

To achieve your objectives you should have smart goals, they need to be specific, measurable, achievable, realistic and time bound. Using these infographics you can set them to help focus your efforts and increase the chances of success. They are shown as blocks, graphics, pie charts, timelines... and best of...

Lights, camera, action! It’s time to read a script with the whole crew, so prepare for that moment with an original template. Check out these infographics slides that look like clapperboards! They match the Table Read Meeting presentation, so you can edit them and include them there or in any...

Download the "Cycle Diagrams Theme for a Business Plan" presentation for PowerPoint or Google Slides. Conveying your business plan accurately and effectively is the cornerstone of any successful venture. This template allows you to pinpoint essential elements of your operation while your audience will appreciate the clear and concise presentation,...

Technology is everywhere: the computer, the screen you're looking at right now, the smartphone, the earphones, the train you're boarding, the electric scooter... For a presentation that highlights the importance of technology in the business sector, we've designed a set of editable infographics that go well with that topic. Complementing...