Corporate Business Benchmarking Infographics
Free template
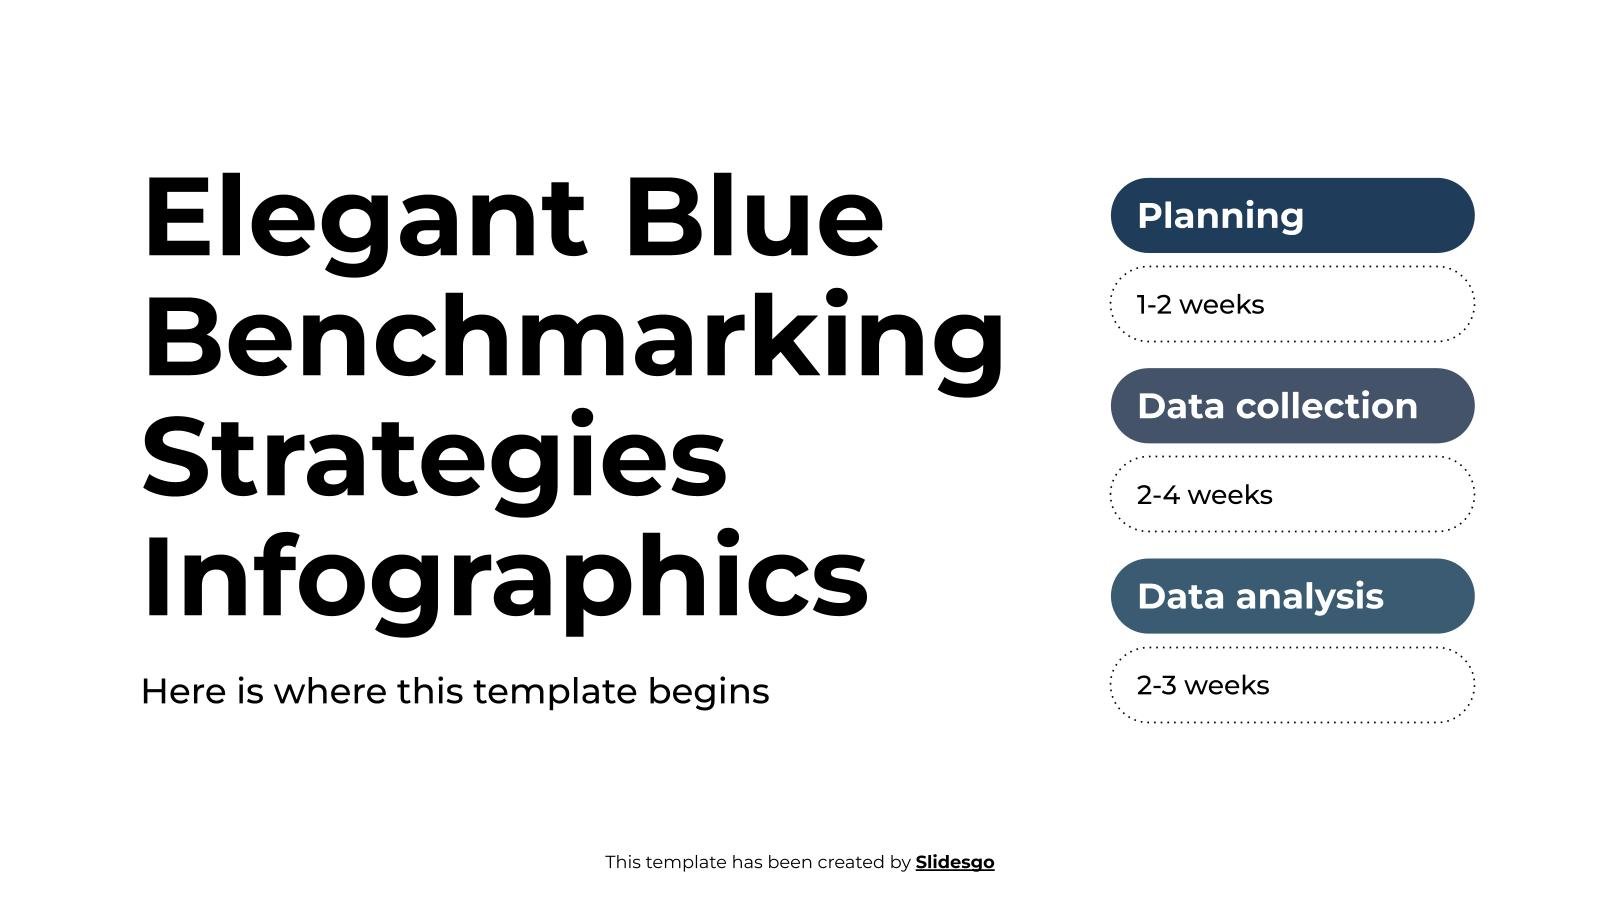
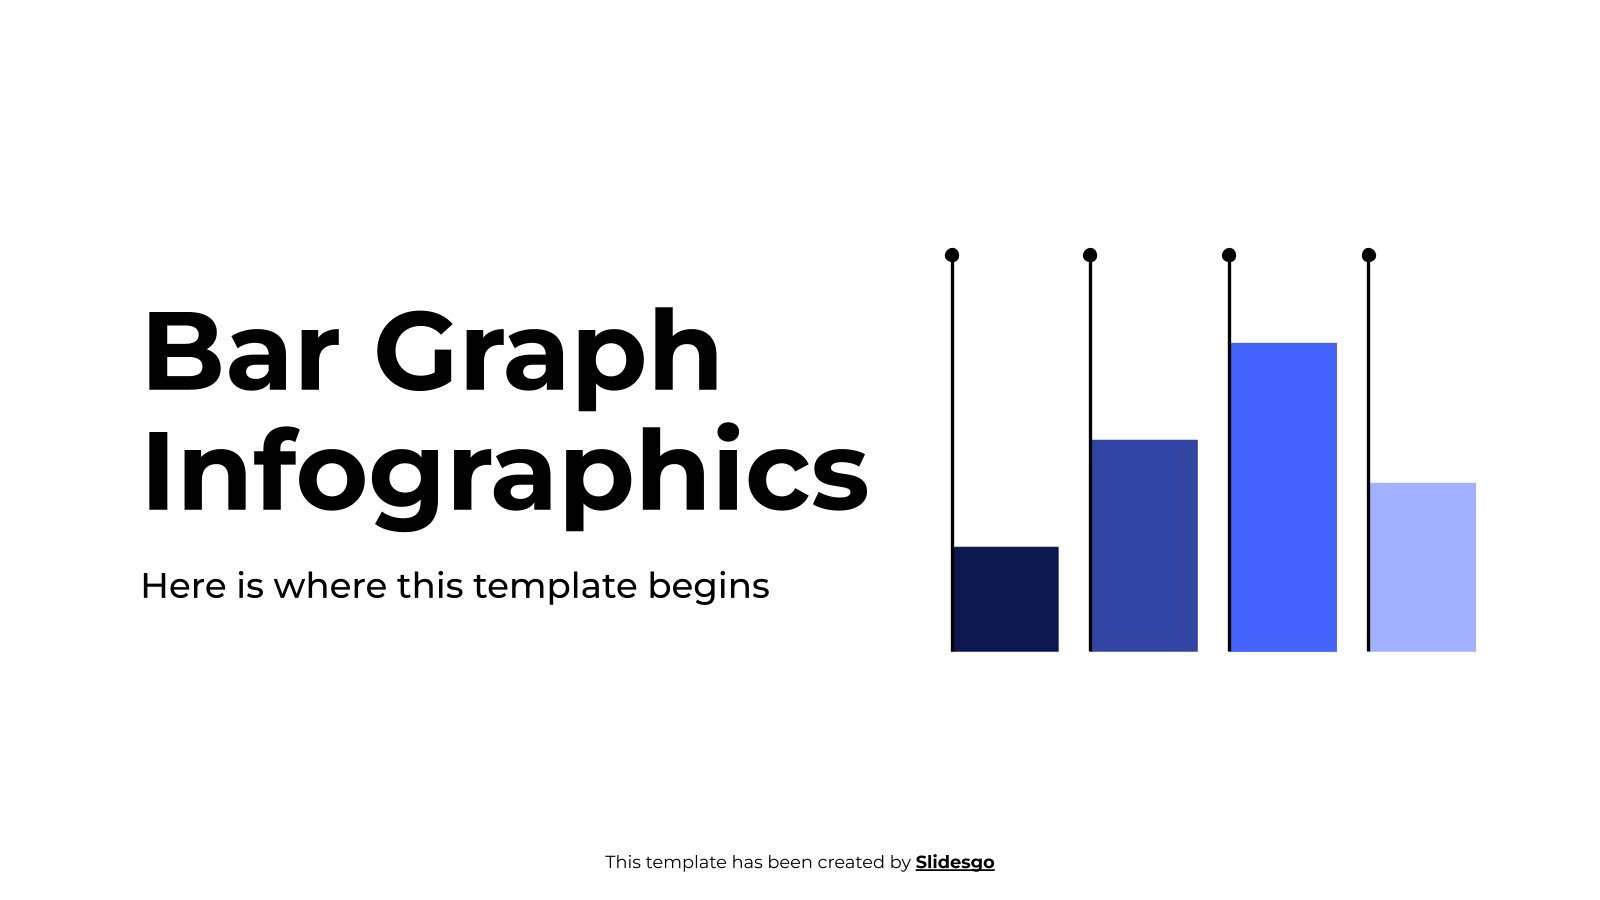
Business benchmarking is a process used to identify and measure key performance indicators of an organization against those of industry peers. It can help companies understand their operations in comparison to their counterparts, discover areas for improvement and set achievable goals. But how to explain all that complex data in an easier way? With the use of these editable infographics, designed to simplify data representations. By default, the tones used revolve around blue, but you can adapt this to your corporate identity. Check out the different designs included, from timelines, gauges and diagrams to graphs and comparisons.
Features of these infographics
- 100% editable and easy to modify
- 32 different infographics to boost your presentations
- Include icons and Flaticon’s extension for further customization
- Designed to be used in Google Slides, Canva, and Microsoft PowerPoint
- 16:9 widescreen format suitable for all types of screens
- Include information about how to edit and customize your infographics
- Learn more in How to use this template?
Register for free and start downloading now


