Report Presentation templates
Let everyone in your company know about the status of a project, the balance sheets or a summary of the annual performance with these templates for Reports. Their infographics and graphs included will help you a lot!


It seems that you like this template!

Register for free and start downloading now
How did you company do during this year? Annalise your spendings, liabilities, earnings, profits, investments, etc. with this set of business infographics made for people who want to increase their productivity! They’re very easy to use and will help your company understand its achievements and its mistakes, to learn from...
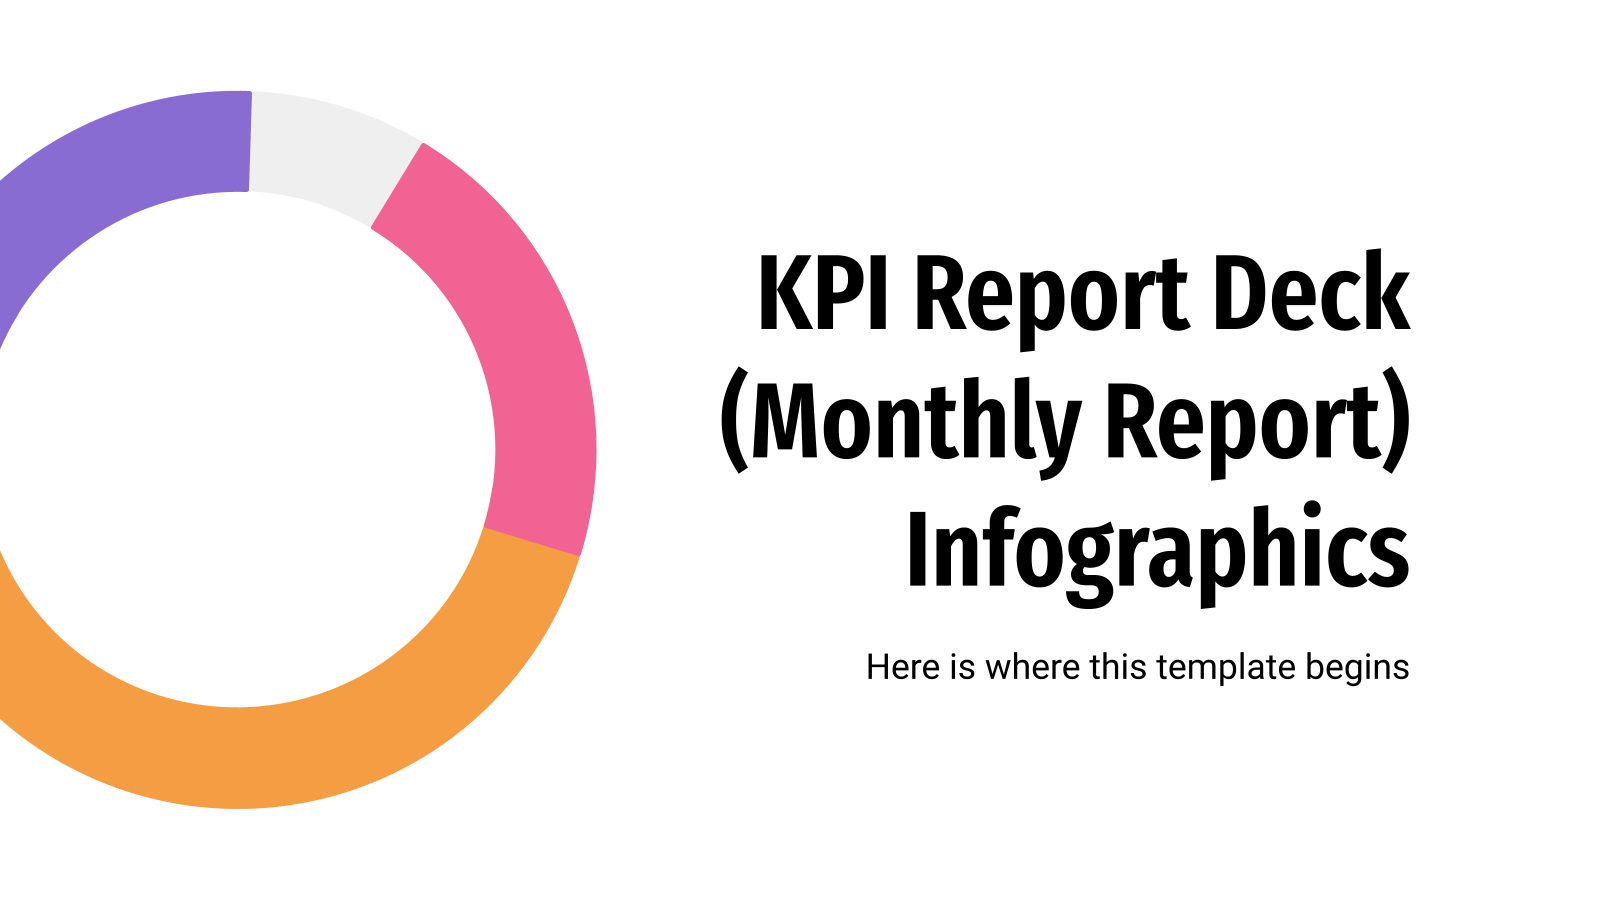

With this set of infographics, you'll find it super easy to keep track of the KPI (or key performance indicators), at least in a visual manner. Boost your presentations with these resources and take advantage of their multiple colors and representations: we've got maps, timelines, calendars, bar graphs, radial charts,...
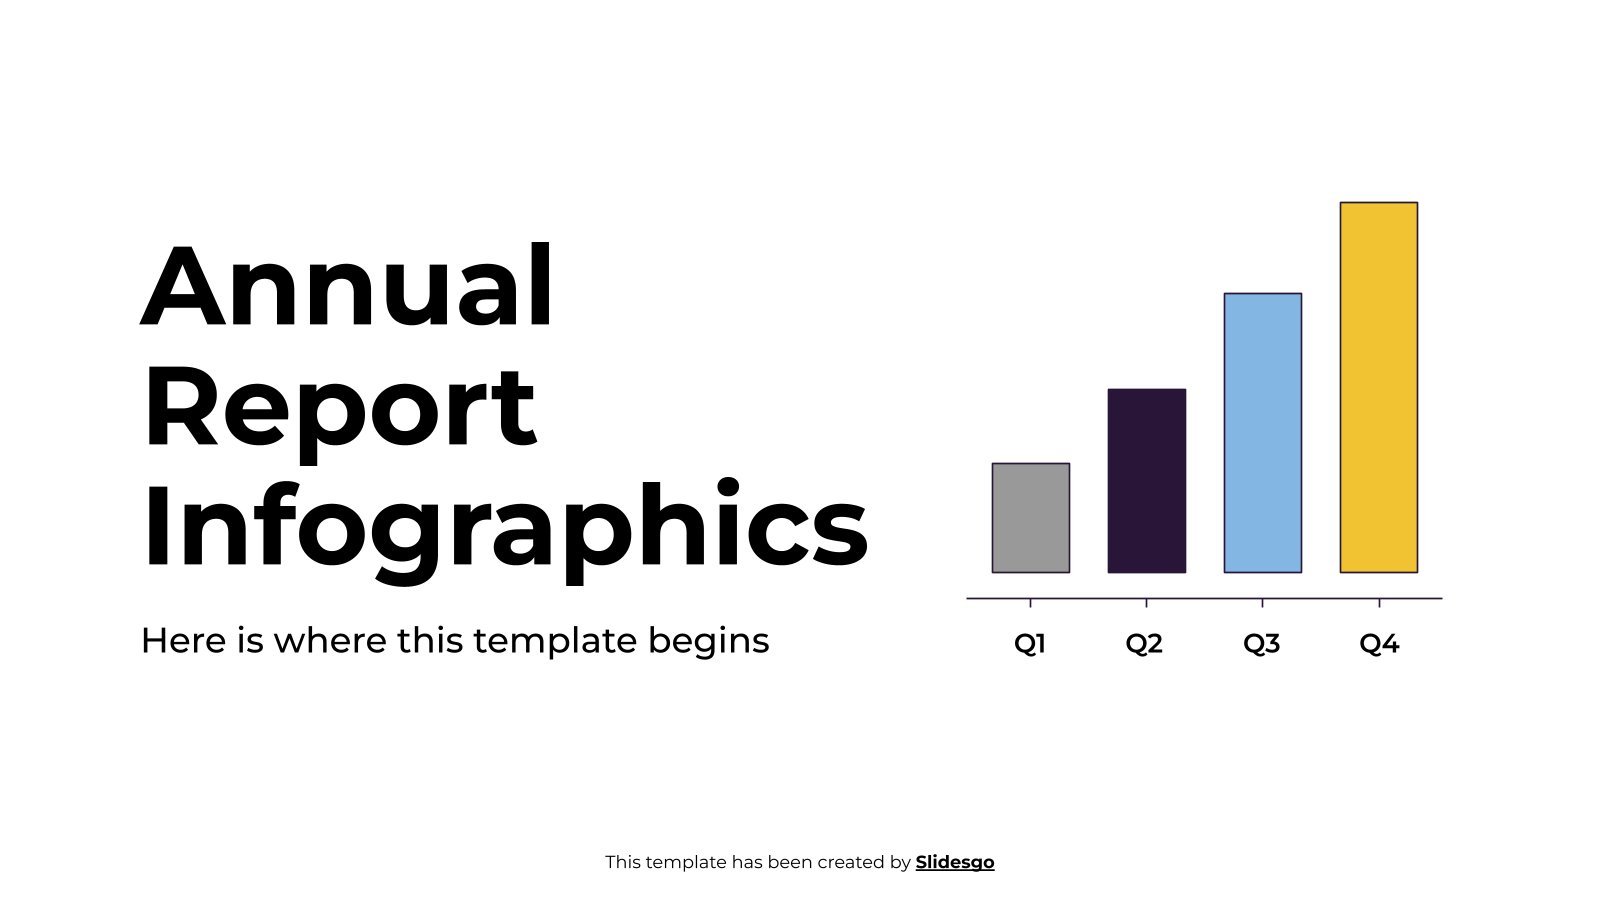

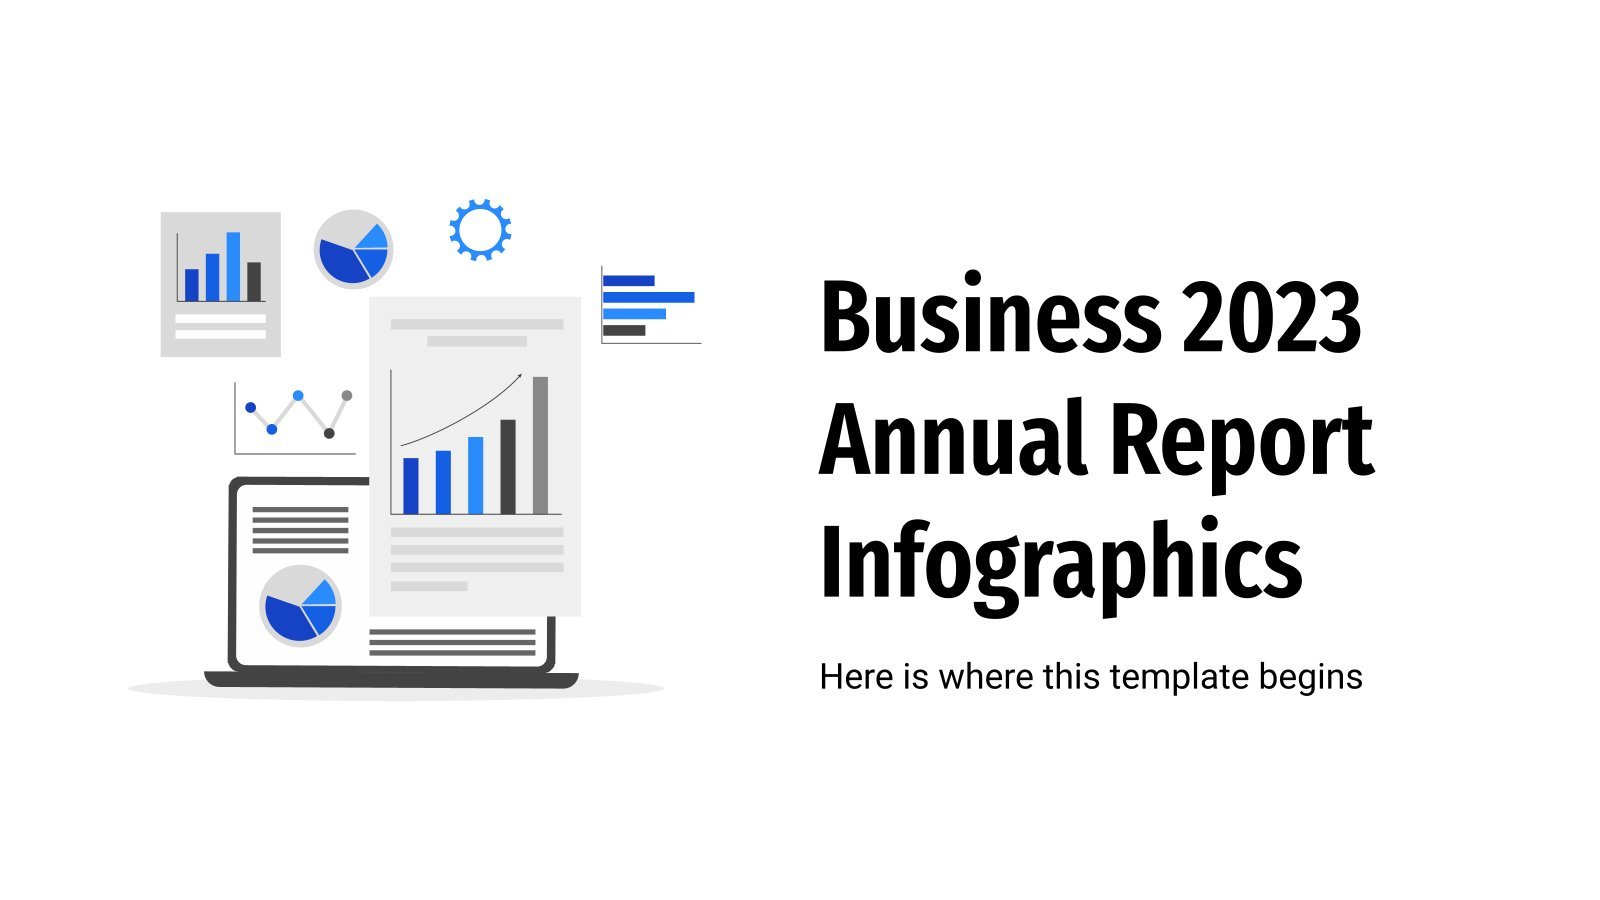
Download the "Annual Report Infographics" template for PowerPoint or Google Slides and discover the power of infographics. An infographic resource gives you the ability to showcase your content in a more visual way, which will make it easier for your audience to understand your topic. Slidesgo infographics like this set...
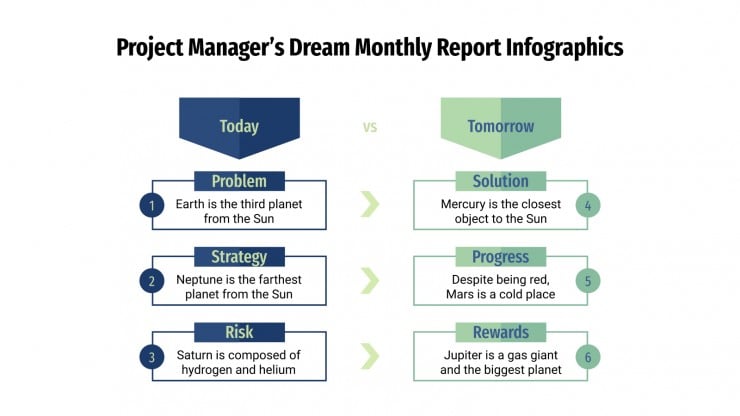
As a manager in your company, sometimes you must prepare a report in which various aspects and performance metrics are gauged and displayed. For this reason, we want to help you by releasing this set of infographics. Need to show percentages? A progress? Statistics? These are the designs you're looking...


Wow, another year has gone by. 12 months full of sales, business, meetings, management, ideas… it was about time we make a review of our accomplishments, right? With this set of infographics, you can put your company’s performance in the spotlight! Speak about revenue, expenses, new employees or branches, new...


Download the CSR Report Infographics template for PowerPoint or Google Slides to get the most out of infographics. Whether you want to organize your business budget in a table or schematically analyze your sales over the past year, this set of infographic resources will be of great help. Start using...

If you’re doing an internship, you probably need to write a report about it. After all, it’s interesting to gather all the information you have learned over the months and use it in the future. For a great report, we recommend infographics! They’re very visual and easy to use. Write...


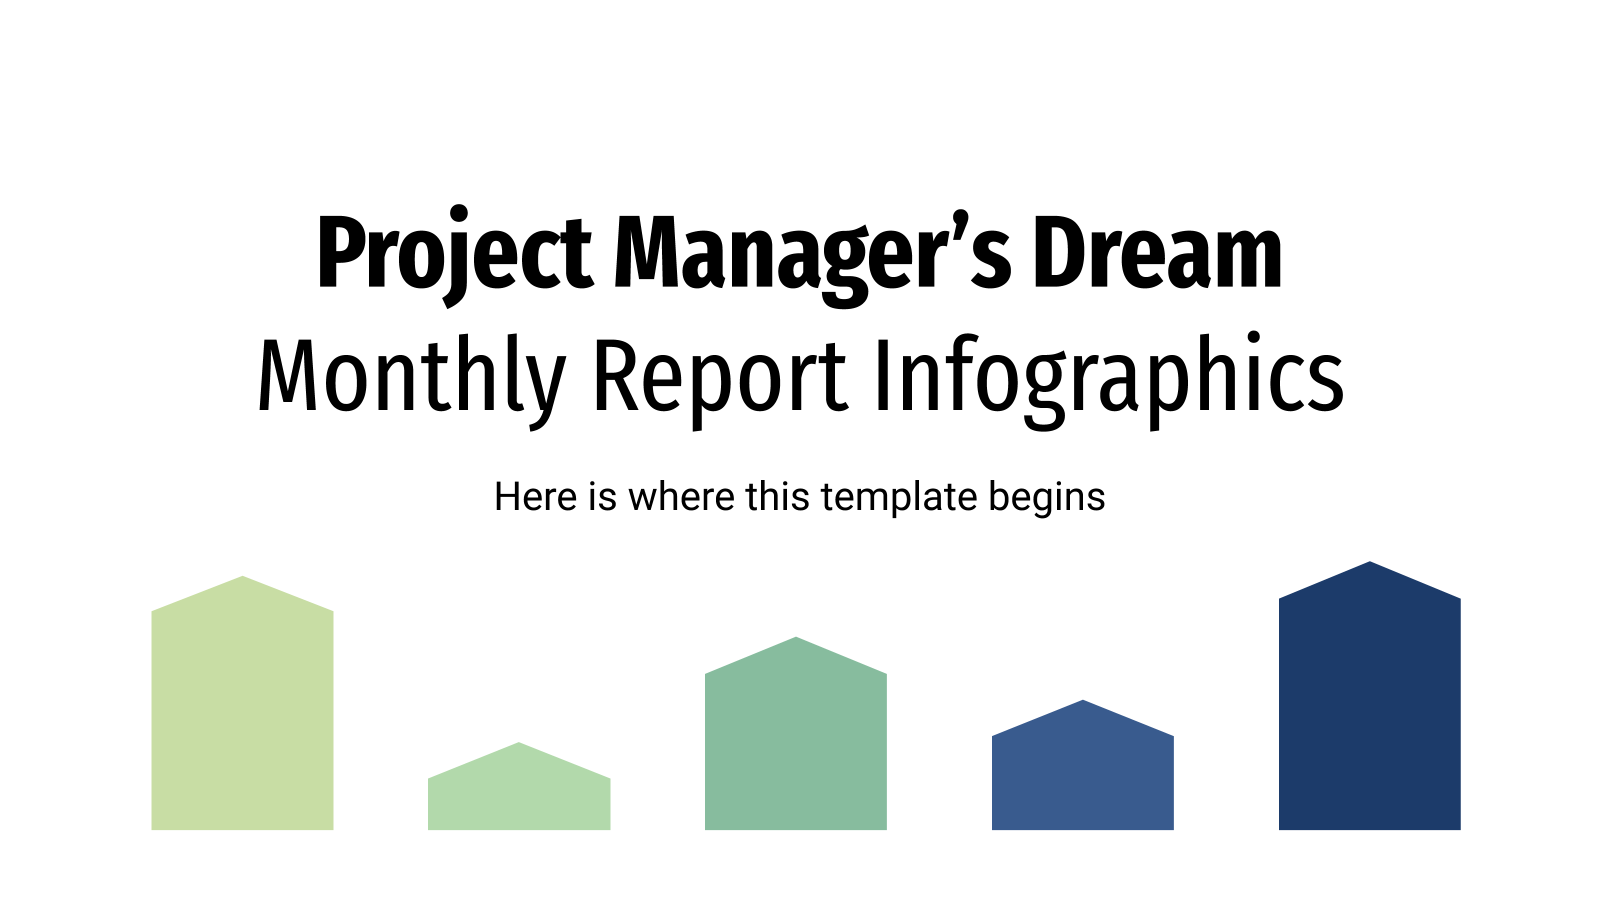
Download the Monthly Report Infographics template for PowerPoint or Google Slides to get the most out of infographics. Whether you want to organize your business budget in a table or schematically analyze your sales over the past year, this set of infographic resources will be of great help. Start using...


A whole year of business in plain sight, that’s what this template offers. Represent graphically the wellbeing of your company with these illustrative infographics about business. They are focused on the differences between each month so you can compare seasonal earnings, new client waves or statistical data. Give life to...


Present your clinical case on heart failure in an organized and visually appealing way with this infographics template. It features an array of resources like graphs, timelines, and tables to make sure you have all the necessary information to explain everything in detail. All the colors are chosen to give...


How optimized is your website for search engines? Did the number of visits increase last month? Display your metrics and results as visually attractive as possible with these infographics. The designs range from pie charts and radial charts to pyramid diagrams and circle diagrams. The graphs are editable too, with...


What has 2021 left us? Did the economy go up or did it worsen? Did global warming affect temperatures in your country? These infographics are absolutely multi-purpose, as their variety is suitable for a lot of different topics. Are you looking for circular graphs? Or timelines? Maybe a map of...


Download the CSR Report Infographics template for PowerPoint or Google Slides and discover the power of infographics. An infographic resource gives you the ability to showcase your content in a more visual way, which will make it easier for your audience to understand your topic. Slidesgo infographics like this set...


"Why did you open that email whose subject said You're our 100th employee, here's an extra month of vacation? Now we've got a virus on our system!" Someone is in need of some cybersecurity lessons! Speaking of which, if you're looking for ways to present your report after a cybersecurity...


These infographics are a perfect way of encouraging students to start reading! The colorful design and the thematic resources will help you present book reports in an easy, comprehensible, and interesting way, which will make everyone who sees them run to the library! Just like books, infographics have infinite different...


Is it time to check out how well a project is faring so far? To make it visually appealing, try our infographics. Your reports will look amazing with these designs, which make use of traffic lights or status bars to represent the different stages and their current status. Everything is...


Diversity refers to cultural and demographic characteristics such as nationality, age, gender and religion. Having diversity in all social environments is very important because that way there is inclusion, and interactions are enriched. Present your diversity report taking advantage of the 32 different infographics in this template that we put...