Marketing Infographics Presentation templates - Page 6
Anticipate and satisfy your customers' needs creating marketing infographics with your own information! Get ready to get more and more clients showing your data and information with great diagrams!

It seems that you like this template!

Register for free and start downloading now
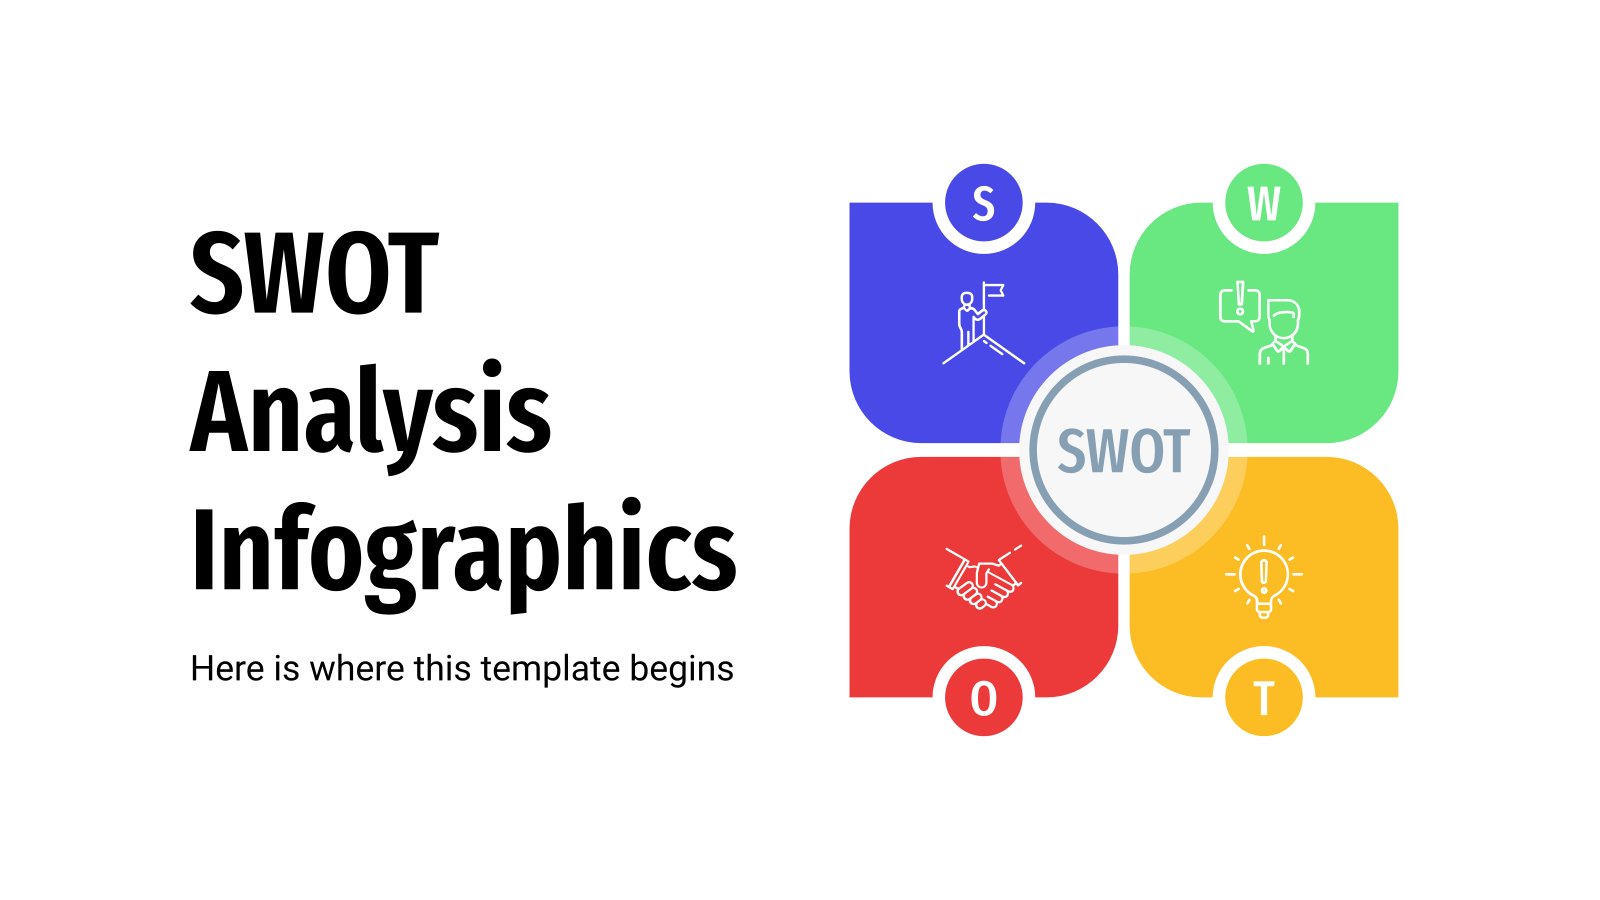
Discover the strengths, weaknesses, opportunities and threats of your own company performing a SWOT analysis. Use this basic strategic planning to evaluate your position with these new infographics created by Slidesgo.

Download the "Aesthetic Infographics" template for PowerPoint or Google Slides and discover the power of infographics. An infographic resource gives you the ability to showcase your content in a more visual way, which will make it easier for your audience to understand your topic. Slidesgo infographics like this set here...

These infographics are focused on a very important part of a marketing strategy: the value proposition. Illustrate what makes your product unique with these editable designs made for business experts. Speak about your goals, benefits, budget or types of value proposition and keep your coworkers updated about the strategy of...

Radio, press, television and the internet are considered mass media. These have accompanied us over time with greater or lesser incidence. Digitization has meant a change in the way we consume these media, and with this template you can explain how that change has been and what the current situation...

Download the Sales Progress Infographics template for PowerPoint or Google Slides to get the most out of infographics. Whether you want to organize your business budget in a table or schematically analyze your sales over the past year, this set of infographic resources will be of great help. Start using...

Download the "Simple Watery Shapes Style MK Campaign Infographics" template for PowerPoint or Google Slides and discover the power of infographics. An infographic resource gives you the ability to showcase your content in a more visual way, which will make it easier for your audience to understand your topic. Slidesgo...

Imagine this: a swirling vortex of information that leads you straight down a path to success. That's the power of a great funnel infographic. With a little bit of creativity, these editable visual aids can guide potential customers through the twists and turns of the decision-making process with ease. And...

List the most importantyour milestones related to your company or marketing campaign with these infographics. You’ll find timelines, roadmaps or steps with a flat design. They include many sections!

Download the Iceberg Diagram Infographics template for PowerPoint or Google Slides to get the most out of infographics. Whether you want to organize your business budget in a table or schematically analyze your sales over the past year, this set of infographic resources will be of great help. Start using...

Do you need to present your data, results or any other sort of complex information? Infographics are a good way to piece things together. Speaking of which, Slidesgo’s back with this template full of puzzle infographics for your presentations!

Download the Illustration Infographics template for PowerPoint or Google Slides and discover the power of infographics. An infographic resource gives you the ability to showcase your content in a more visual way, which will make it easier for your audience to understand your topic. Slidesgo infographics like this set here...

Download the "Marketing Theme with Cycle Diagrams" presentation for PowerPoint or Google Slides and take your marketing projects to the next level. This template is the perfect ally for your advertising strategies, launch campaigns or report presentations. Customize your content with ease, highlight your ideas and captivate your audience with...

Slidesgo’s creative machinery never stops making cool templates for you. This time, we’ve designed infographics with shapes in the form of gears, and they appear as diagrams, timelines, steps, tables and even organizational charts. Styles range from flat and doodle to isometric. Start editing them and show your data as...

This pack of infographics is intended for marketing gurus. We propose several ways of representing data within several well-known frameworks in marketing. If “PESTLE”, “SWOT” or “7S” sound familiar to you, do not hesitate to download this template and start editing the contents with some campaign results or analyses!

Download the Strategic Roadmap Infographics template for PowerPoint or Google Slides and discover the power of infographics. An infographic resource gives you the ability to showcase your content in a more visual way, which will make it easier for your audience to understand your topic. Slidesgo infographics like this set...

Download the Creative Timeline Infographics template for PowerPoint or Google Slides and discover the power of infographics. An infographic resource gives you the ability to showcase your content in a more visual way, which will make it easier for your audience to understand your topic. Slidesgo infographics like this set...

Download the Customer Journey Infographics template for PowerPoint or Google Slides to get the most out of infographics. Whether you want to organize your business budget in a table or schematically analyze your sales over the past year, this set of infographic resources will be of great help. Start using...

In business, it’s important to compare qualities, features and prices of different products or services in the market. Use these free infographics to stand out from the competition and talk about market share, strengths, weaknesses, profit and many more essential info for your colleagues or higher-ups!