Marketing Infographics Presentation templates - Page 7
Anticipate and satisfy your customers' needs creating marketing infographics with your own information! Get ready to get more and more clients showing your data and information with great diagrams!


It seems that you like this template!

Register for free and start downloading now
You might think torn paper is something to be thrown to the garbage bin. We see it as something we can give a new use to. With this set of editable infographics, you'll realize how! These designs, which also include graphs and diagrams, give life to those pieces of paper...

Brrr… cold winds, lots of rain, time to cuddle up inside with a hot chocolate or tea… or using the fall vibes to your advantage in your next marketing presentation! These infographics for Google Slides and PowerPoint bring cute stickers in the form of leaves, pumpkins and hot drinks to...

This process is simple: first you discover this amazing template with infographics, then, you click on download. Do you know what happens next? Process maps are a great way of illustrating ideas that flow, changing options or different outcomes of a situation. With a set of infographics like this one,...
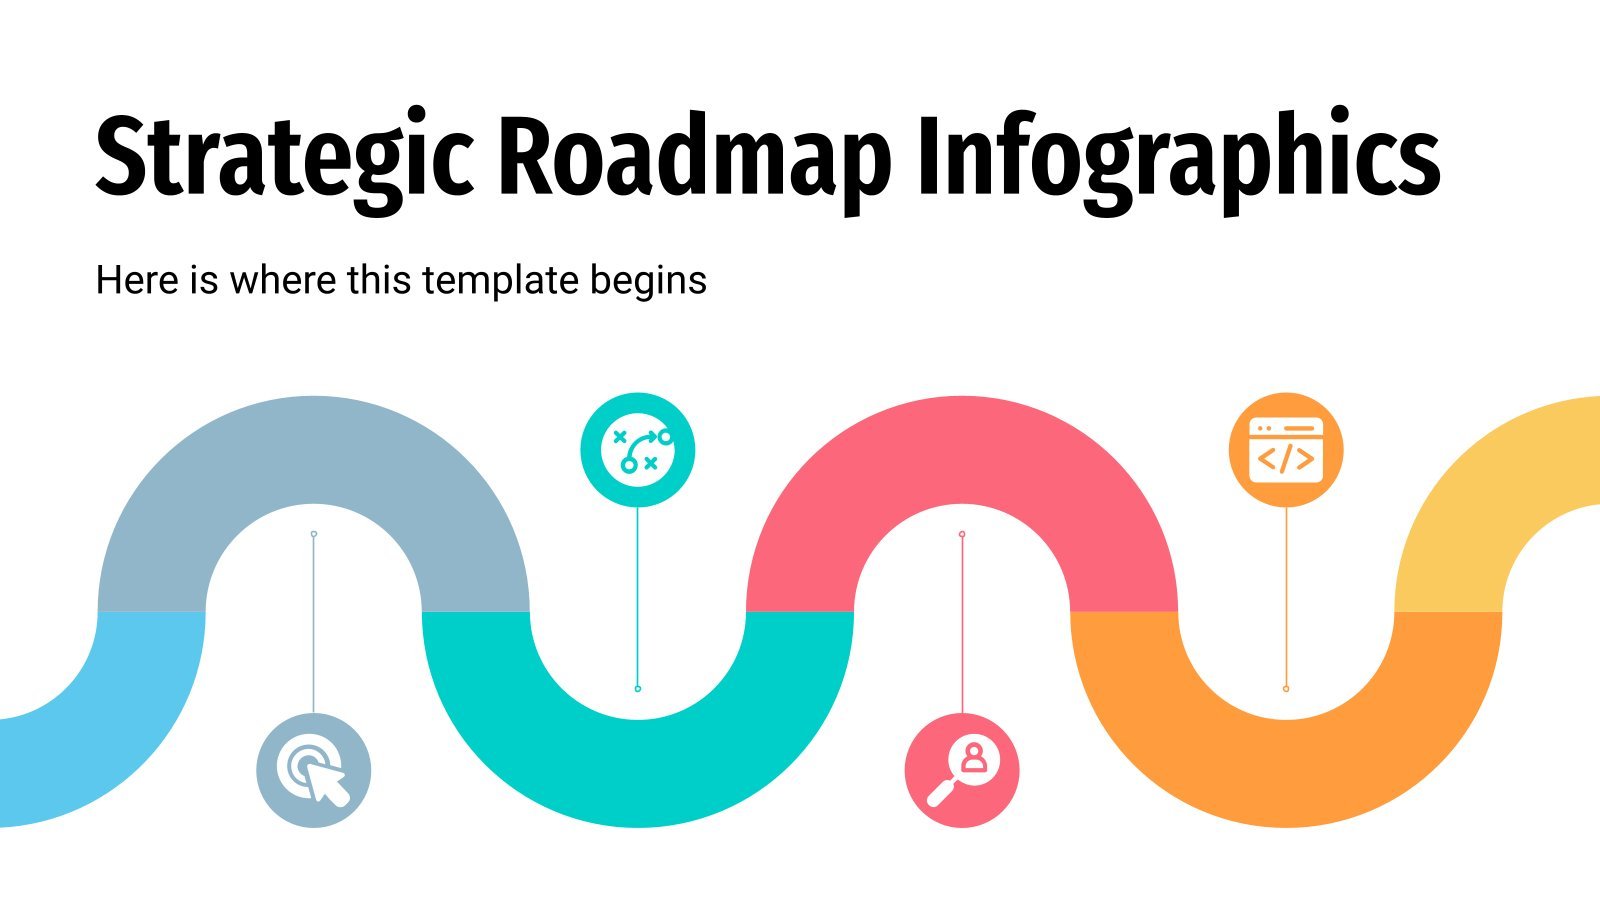
How far can your company go? We know that for you there are no limits and that your company is capable of surpassing everything it decides to do. This is great, but to organize all the goals you want to achieve, designing a strategic roadmap will be a great idea...

Download the "Lead Funnel Infographics" template for PowerPoint or Google Slides and discover the power of infographics. An infographic resource gives you the ability to showcase your content in a more visual way, which will make it easier for your audience to understand your topic. Slidesgo infographics like this set...

To know where to focus the product and identify customer needs, one of the most useful marketing techniques to employ is the customer journey. Through this process, you identify an area where the ideal customer profile (the buyer persona) has a need and start working from there. To help you...

An environmental scanning is the tool used by companies to obtain competitive advantages, track changes in the market and adapt objectives and strategies according to the changing conditions in their environment. To make this analysis easier for you, we have designed a presentation with 32 different infographics that will help...

Download the "Cycle Diagrams Theme for Marketing" presentation for PowerPoint or Google Slides and take your marketing projects to the next level. This template is the perfect ally for your advertising strategies, launch campaigns or report presentations. Customize your content with ease, highlight your ideas and captivate your audience with...

Download the Dashboard Infographics template for PowerPoint or Google Slides and discover the power of infographics. An infographic resource gives you the ability to showcase your content in a more visual way, which will make it easier for your audience to understand your topic. Slidesgo infographics like this set here...

Social media allow us to access information of all kinds, entertain ourselves and create links and relationships with users from all over the world. What better way to celebrate their anniversary than by using this comprehensive template that contains different infographics to explain what they are all about? Download this...

Download the "Cost Reduction in Digital Marketing Infographics" template for PowerPoint or Google Slides and discover the power of infographics. An infographic resource gives you the ability to showcase your content in a more visual way, which will make it easier for your audience to understand your topic. Slidesgo infographics...

Know your market a bit better and adapt your marketing strategies and products to your potential buyers with the help of these infographics. There are many kinds of designs here—including radial graphs, cycle charts and pyramid diagrams—and a colorful palette to effectively show the market segmentation to the rest of...

Download the Investors Social Media Infographics template for PowerPoint or Google Slides and discover the power of infographics. An infographic resource gives you the ability to showcase your content in a more visual way, which will make it easier for your audience to understand your topic. Slidesgo infographics like this...
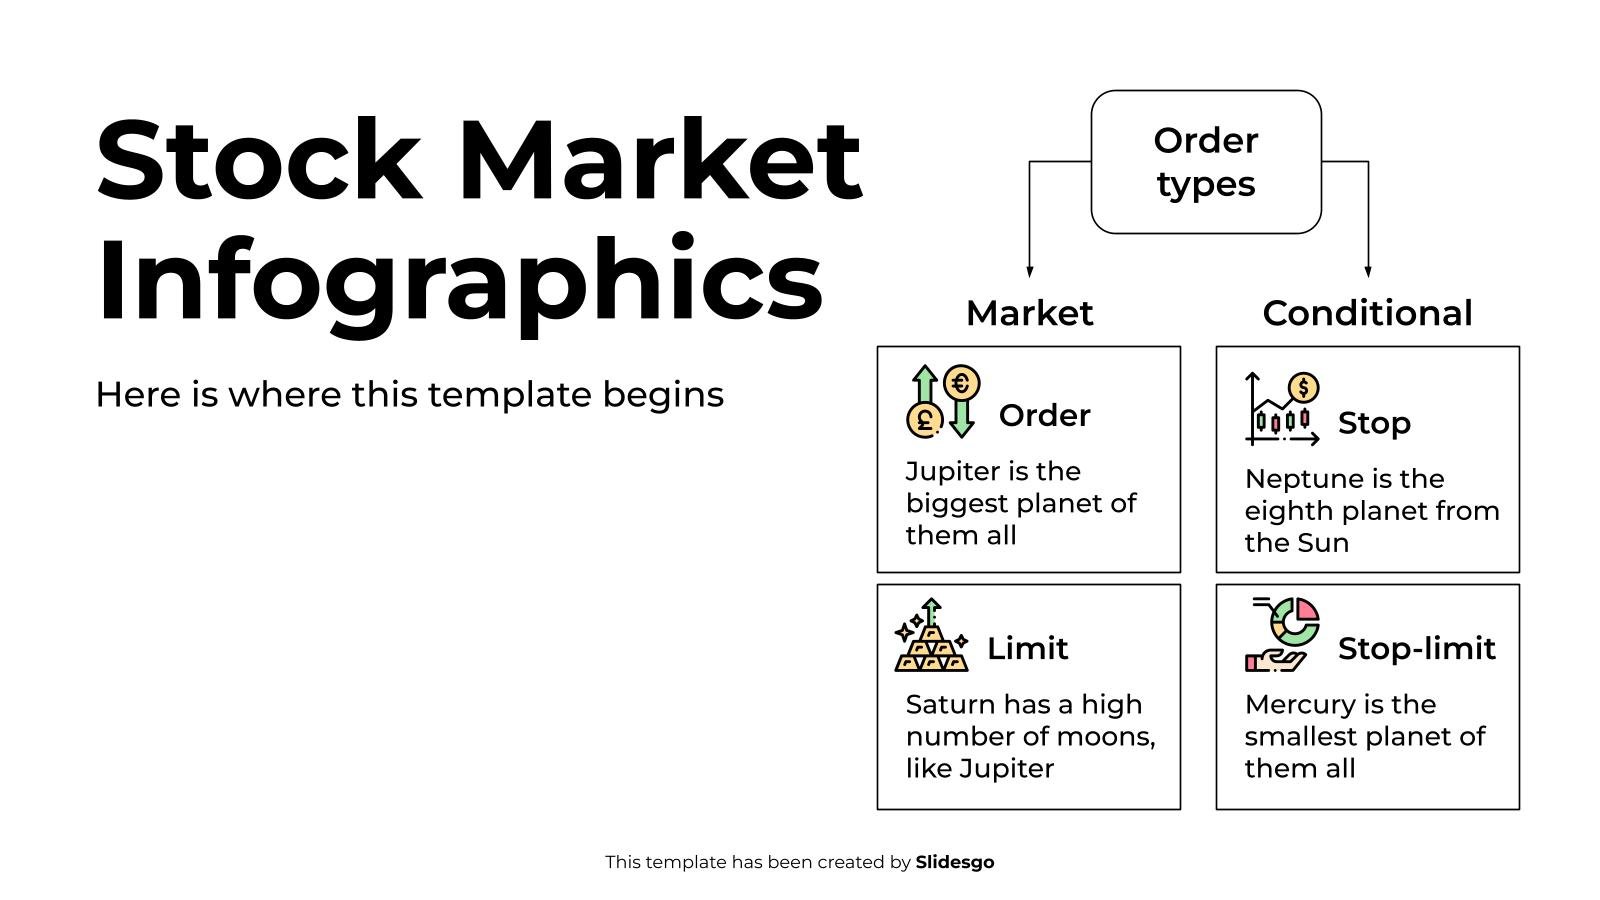
Download the Stock Market Infographics template for PowerPoint or Google Slides to get the most out of infographics. Whether you want to organize your business budget in a table or schematically analyze your sales over the past year, this set of infographic resources will be of great help. Start using...

Do you have a good idea of how your customers look like and what their interests are? Then, show that buyer persona in an infographic, such as the ones included in this template. Being a powerful marketing resource for business, you can make it even more useful by adding illustrations...

Download the Effective Mind Maps Infographics template for PowerPoint or Google Slides to get the most out of infographics. Whether you want to organize your business budget in a table or schematically analyze your sales over the past year, this set of infographic resources will be of great help. Start...
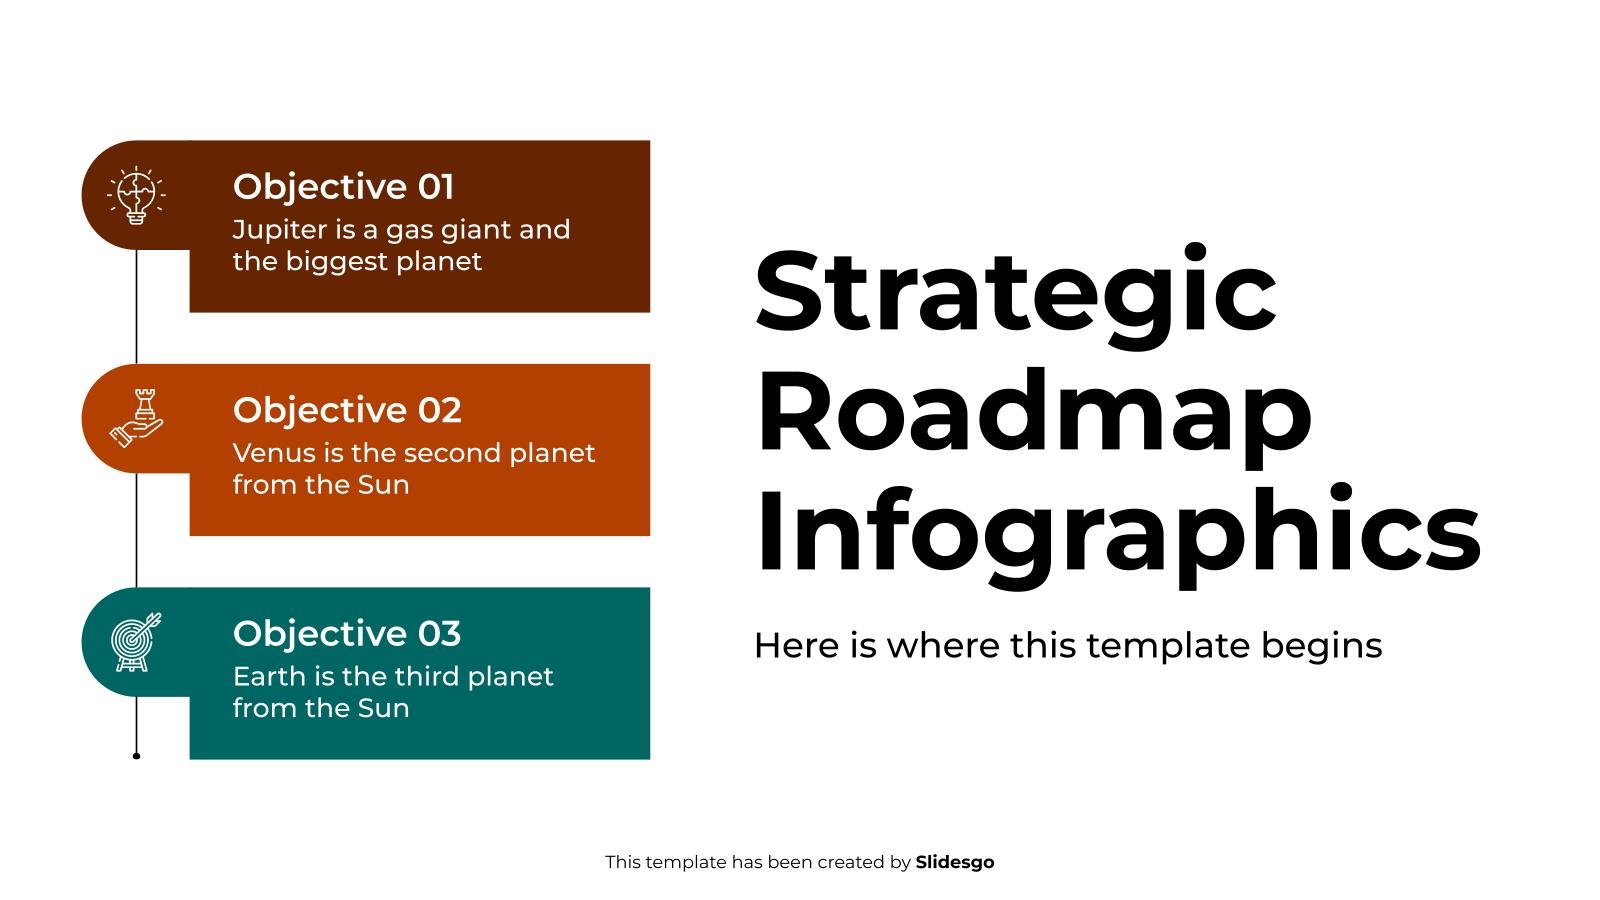
Download the Strategic Roadmap Infographics template for PowerPoint or Google Slides to get the most out of infographics. Whether you want to organize your business budget in a table or schematically analyze your sales over the past year, this set of infographic resources will be of great help. Start using...

Our preferences between one product or another or the way we act in the face of any advertising stimulus is never a random event. Even if you think it is an unconscious action, the brain knows very well what it is doing. There is a discipline in marketing called neuromarketing...