Infographics Presentation templates - Page 9
Discover our engaging Google Slides and PowerPoint slides full of infographics to present your information or data clearly and quickly!

It seems that you like this template!

Register for free and start downloading now
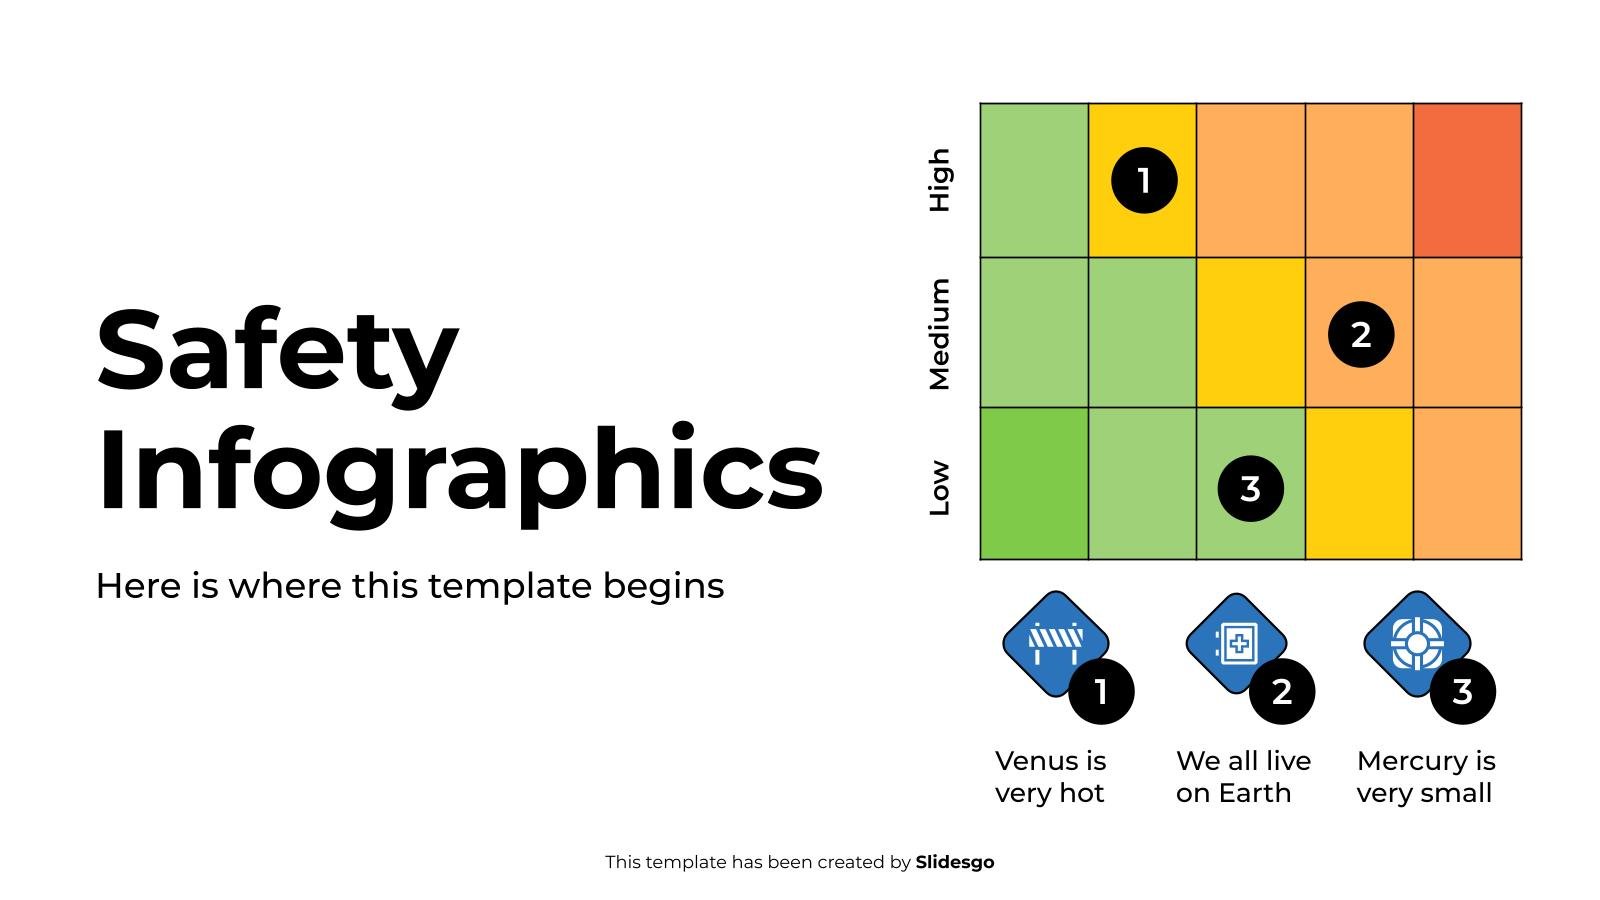
Download the Safety Infographics template for PowerPoint or Google Slides and discover this set of editable infographics for education presentations. These resources, from graphs to tables, can be combined with other presentations or used independently. The most important thing is what you will achieve: transmit information in an orderly and...
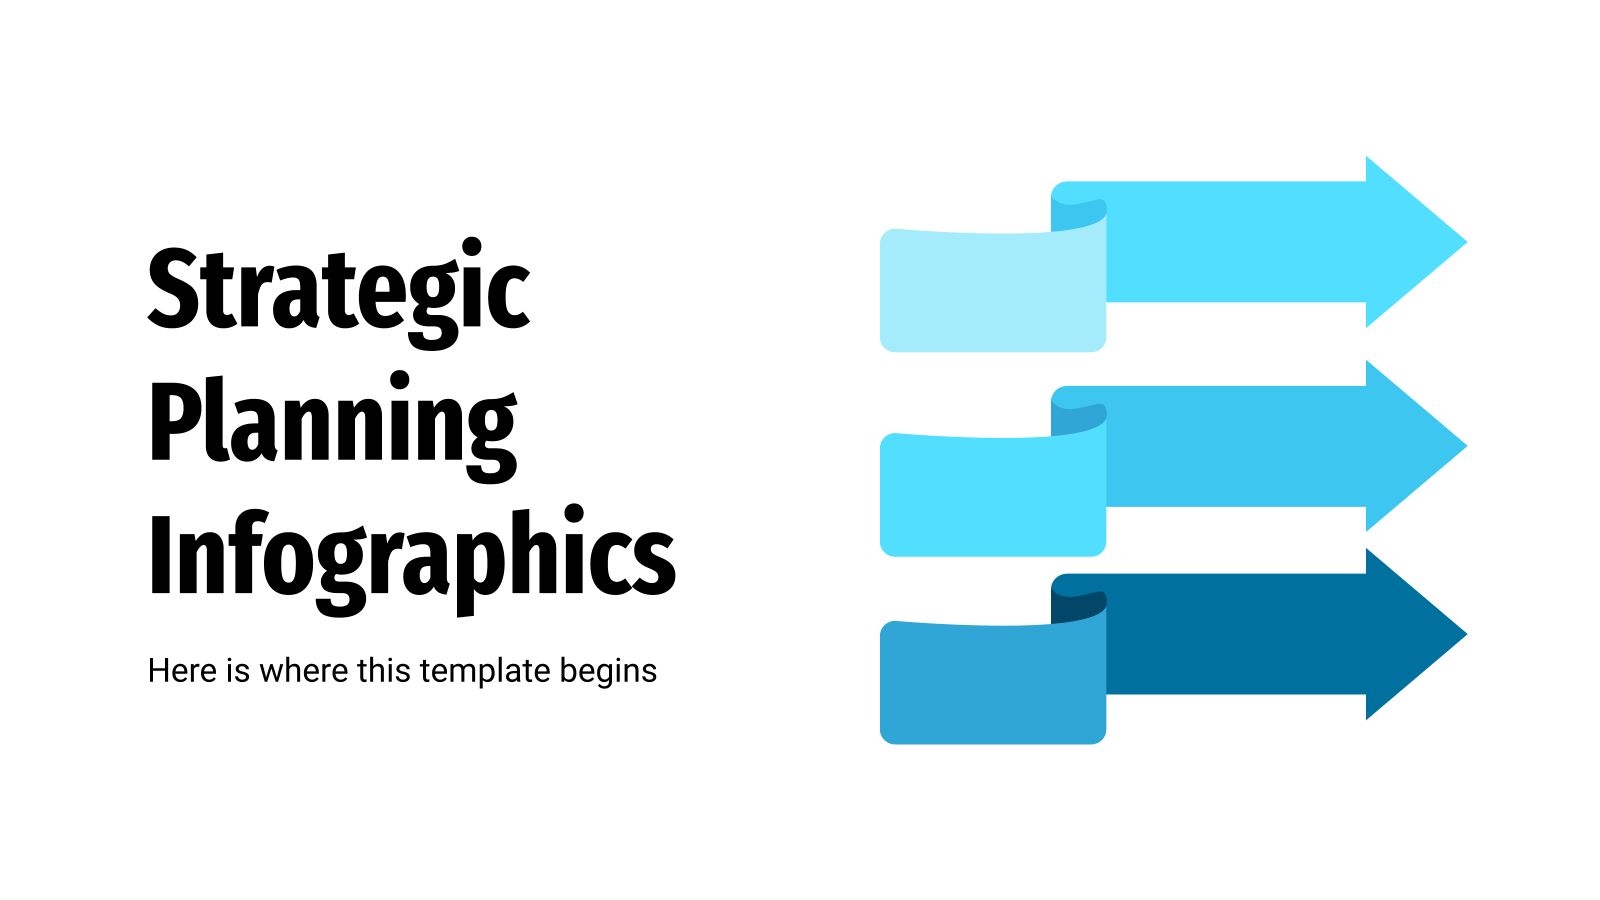
Start editing these infographics to show the different stages of a business' strategic planning. These multiple diagrams, timelines, tables and other kinds of schemes look so clean that there will be no questions asked after the slideshow. Adapt the amount of elements to your needs!
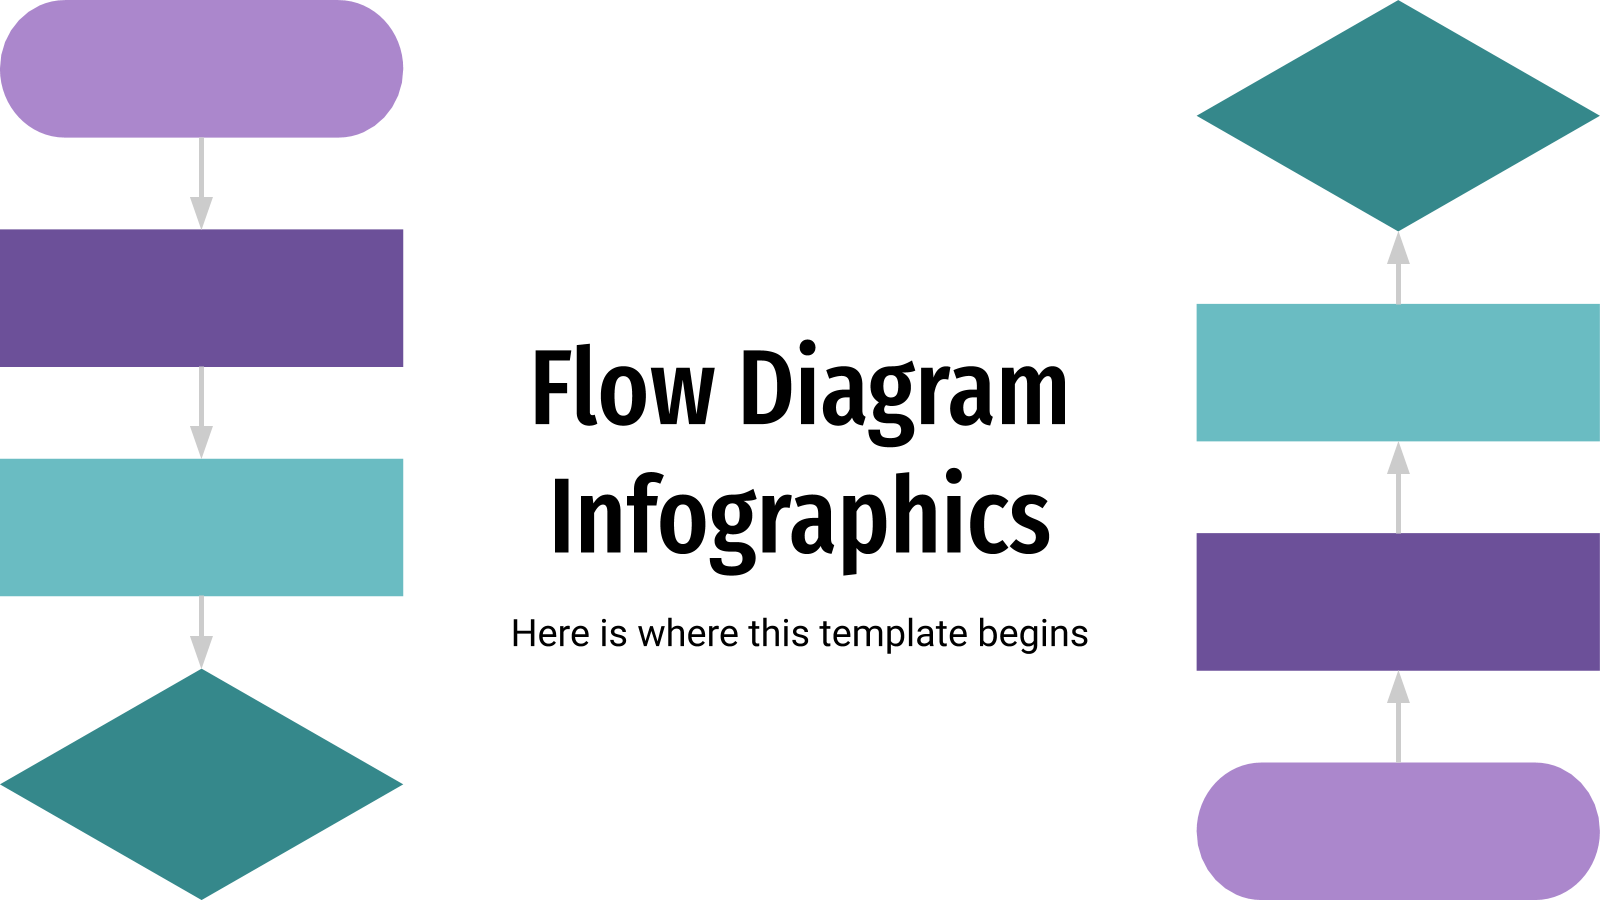
Flow diagrams are used to represent a process or a workflow, along with the possible decisions to take. Download this set of infographics and edit them accordingly. Because making things easier to understand is better than having a hard time trying to explain everything time and time again!

Download the Idea Infographics template for PowerPoint or Google Slides to get the most out of infographics. Whether you want to organize your business budget in a table or schematically analyze your sales over the past year, this set of infographic resources will be of great help. Start using infographics...

Do you want to assess the success or failure of your company? Use these KPI (Key Performance Indicators). It is a great tool to determine if you are achieving a goal or not. Represent your information about actions, strategies or productivity with bar or pie charts, pyramids, tables, percentages, maps......

Download the Annual Business Goal Infographics template for PowerPoint or Google Slides to get the most out of infographics. Whether you want to organize your business budget in a table or schematically analyze your sales over the past year, this set of infographic resources will be of great help. Start...
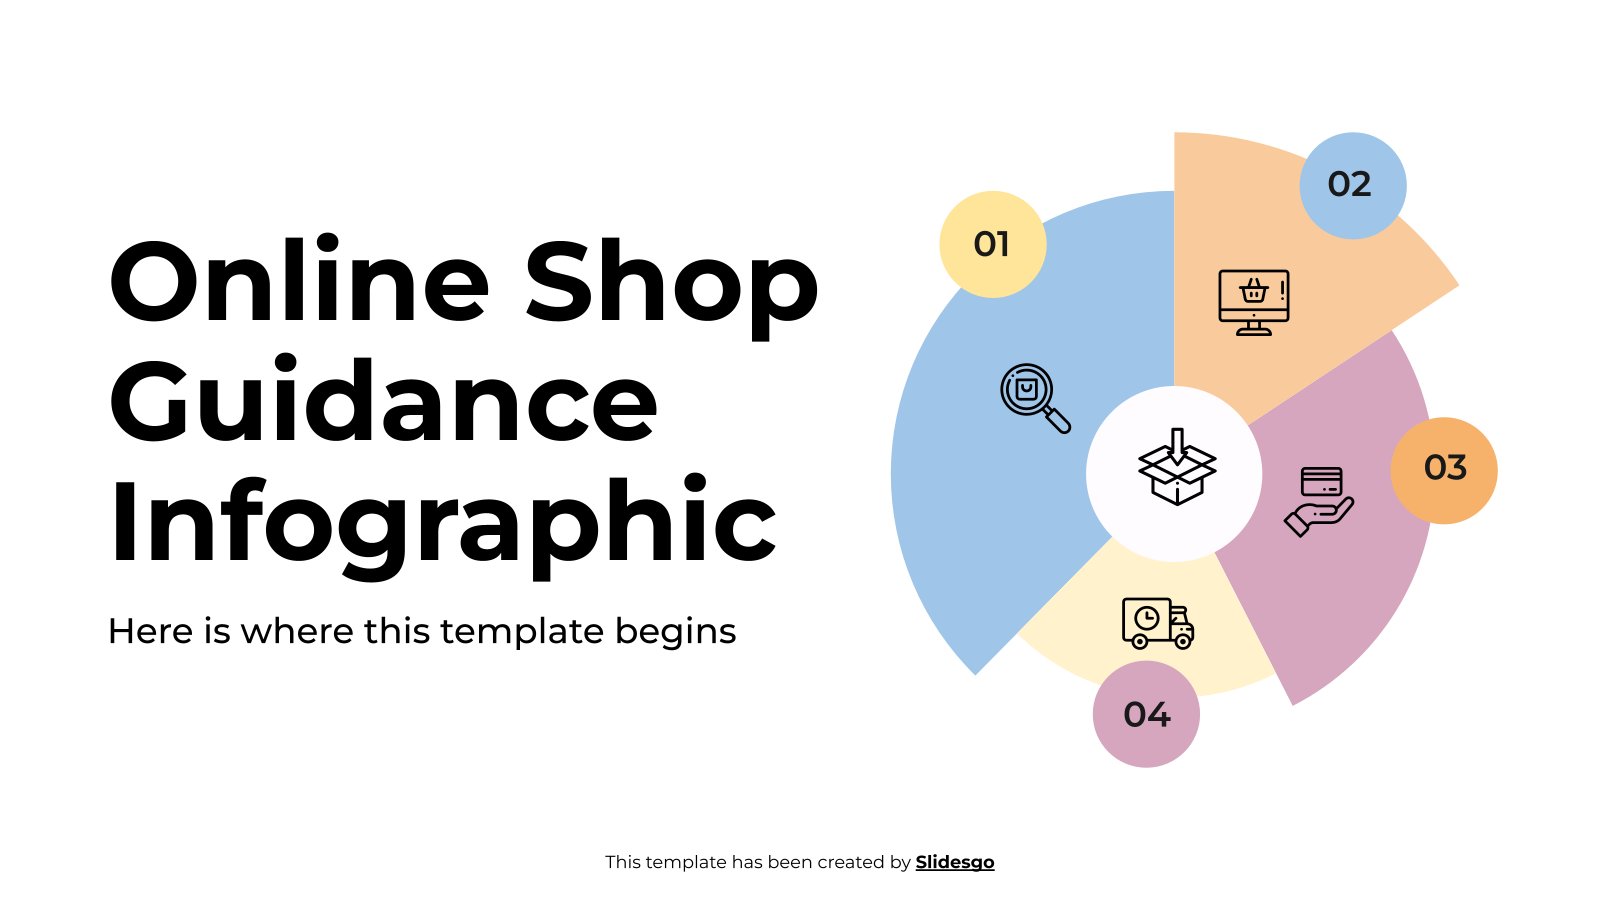
Download the "Online Shop Guidance Infographics" template for PowerPoint or Google Slides to get the most out of infographics. Whether you want to organize your business budget in a table or schematically analyze your sales over the past year, this set of infographic resources will be of great help. Start...

Download the Risk Management Infographics template for PowerPoint or Google Slides to get the most out of infographics. Whether you want to organize your business budget in a table or schematically analyze your sales over the past year, this set of infographic resources will be of great help. Start using...

Download the Process Infographics template for PowerPoint or Google Slides to get the most out of infographics. Whether you want to organize your business budget in a table or schematically analyze your sales over the past year, this set of infographic resources will be of great help. Start using infographics...

Download the Corporate Org Chart Infographics template for PowerPoint or Google Slides to get the most out of infographics. Whether you want to organize your business budget in a table or schematically analyze your sales over the past year, this set of infographic resources will be of great help. Start...

Download the Strategy Wheel Infographics template for PowerPoint or Google Slides to get the most out of infographics. Whether you want to organize your business budget in a table or schematically analyze your sales over the past year, this set of infographic resources will be of great help. Start using...
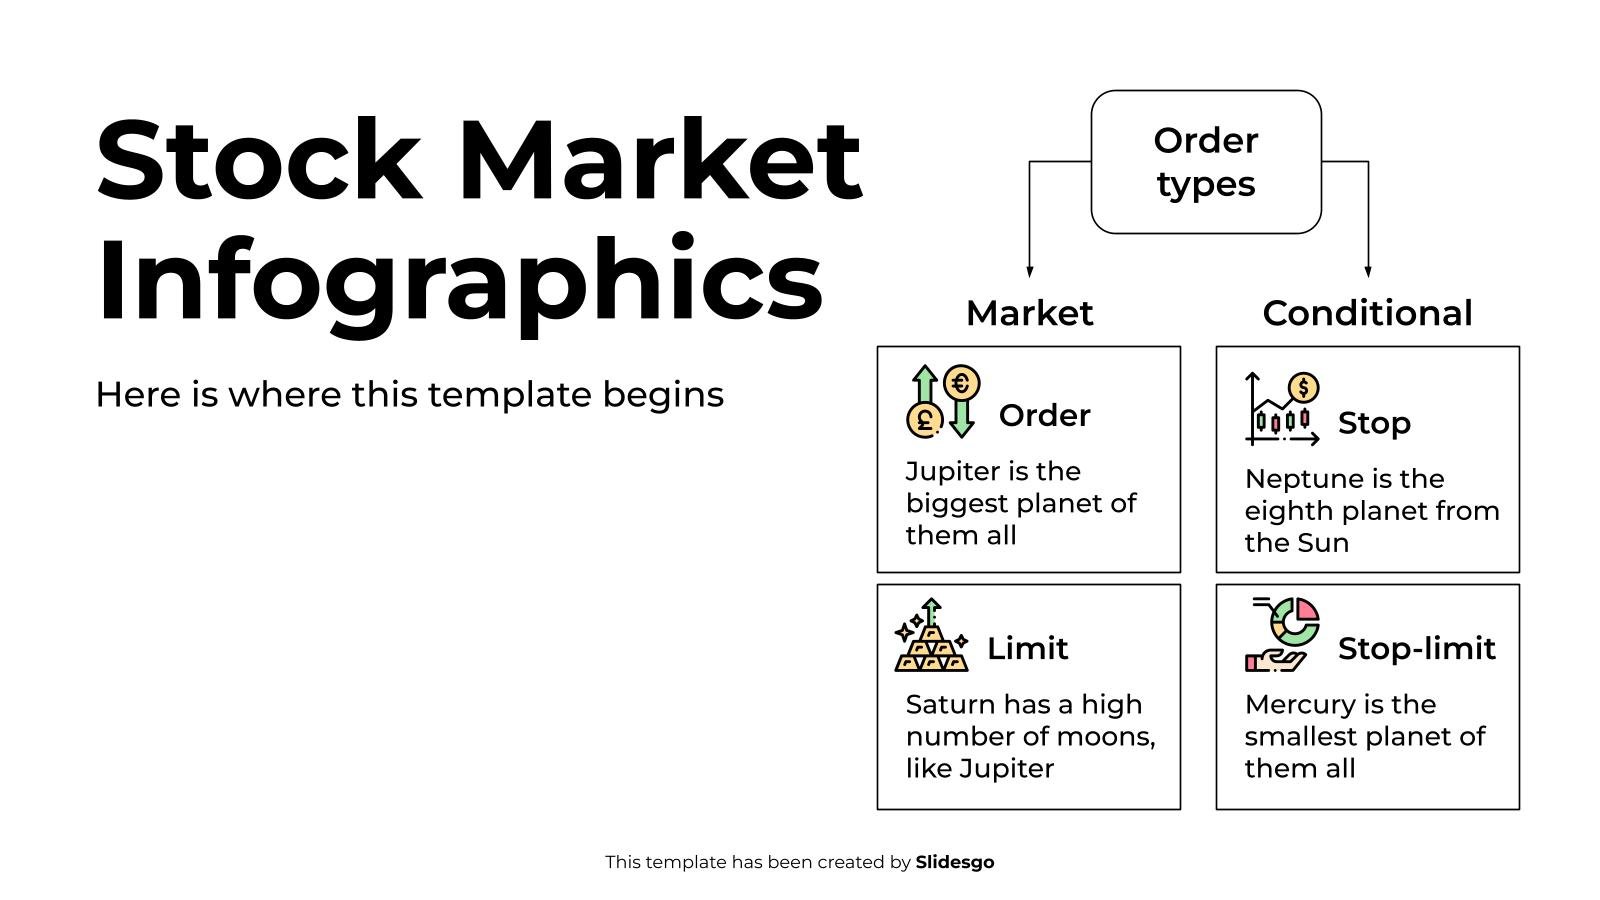
Download the Stock Market Infographics template for PowerPoint or Google Slides to get the most out of infographics. Whether you want to organize your business budget in a table or schematically analyze your sales over the past year, this set of infographic resources will be of great help. Start using...

Download the Timeline Infographics template for PowerPoint or Google Slides to get the most out of infographics. Whether you want to organize your business budget in a table or schematically analyze your sales over the past year, this set of infographic resources will be of great help. Start using infographics...
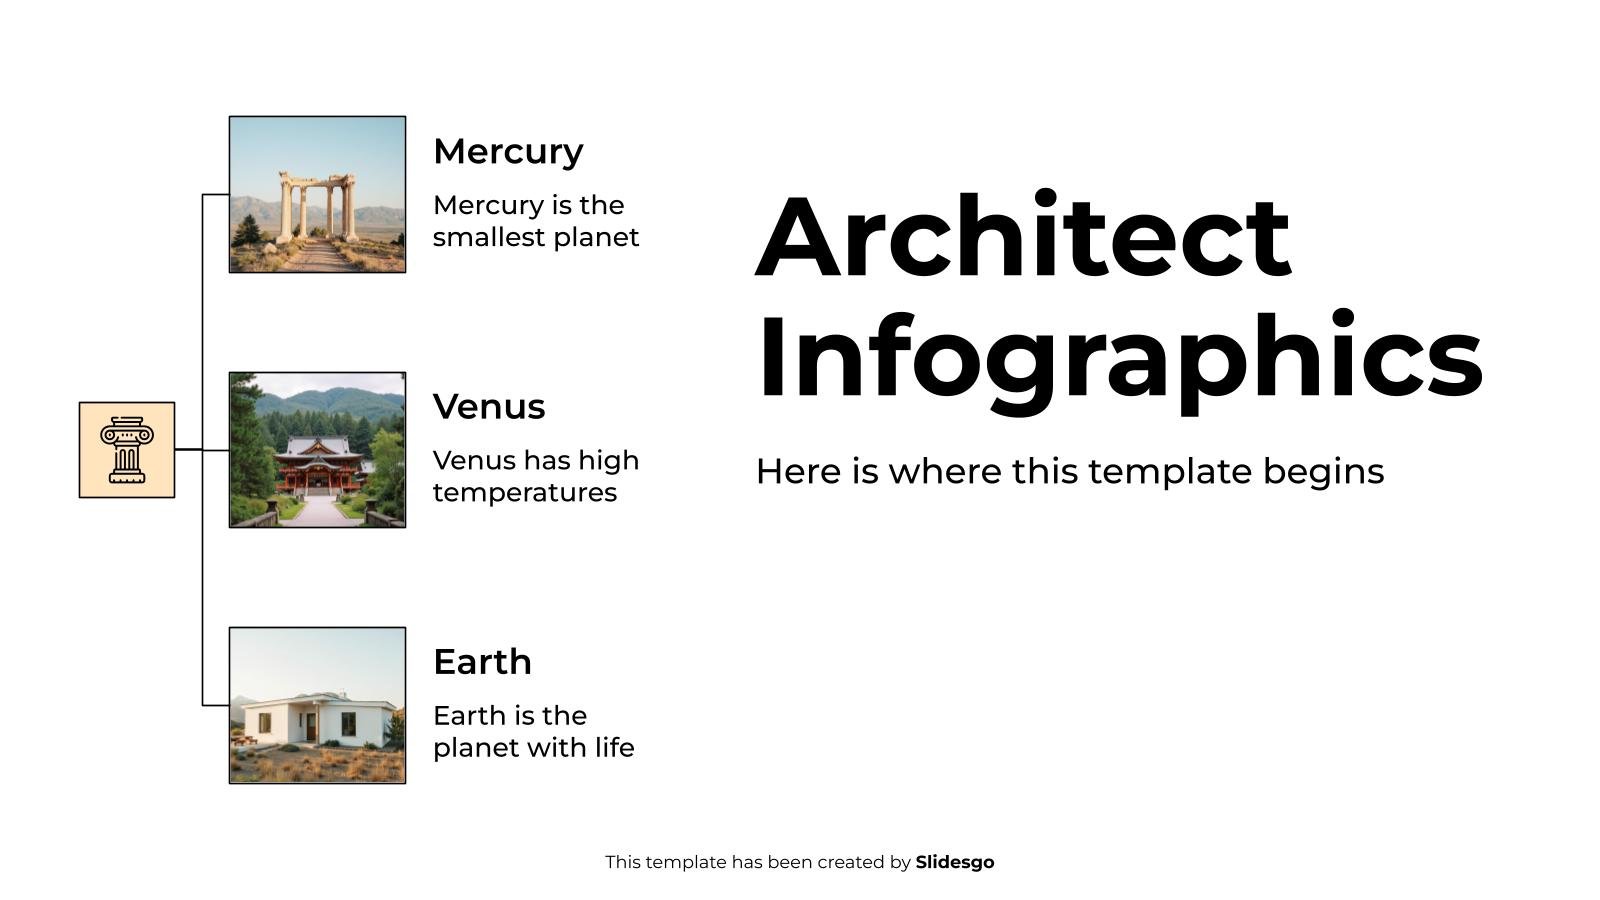
Download the Architect Infographics template for PowerPoint or Google Slides to get the most out of infographics. Whether you want to organize your business budget in a table or schematically analyze your sales over the past year, this set of infographic resources will be of great help. Start using infographics...
Download the "Arrow Infographics" template for PowerPoint or Google Slides and discover the power of infographics. An infographic resource gives you the ability to showcase your content in a more visual way, which will make it easier for your audience to understand your topic. Slidesgo infographics like this set here...

Download the Venn Diagram Infographics template for PowerPoint or Google Slides to get the most out of infographics. Whether you want to organize your business budget in a table or schematically analyze your sales over the past year, this set of infographic resources will be of great help. Start using...

How many populated continents are there in the world? Six! That is the exact number of elements you will find in these infographics. Not five, not seven. Use the different timelines and diagrams to display a process consisting of exactly six steps, or compare six pieces of data, or detail...

Download the "Elegant and Classy Style Agency Infographics" template for PowerPoint or Google Slides and discover the power of infographics. An infographic resource gives you the ability to showcase your content in a more visual way, which will make it easier for your audience to understand your topic. Slidesgo infographics...