Infographics Presentation templates - Page 10
Discover our engaging Google Slides and PowerPoint slides full of infographics to present your information or data clearly and quickly!


It seems that you like this template!

Register for free and start downloading now
Download the Movie Review App Infographics template for PowerPoint or Google Slides and discover the power of infographics. An infographic resource gives you the ability to showcase your content in a more visual way, which will make it easier for your audience to understand your topic. Slidesgo infographics like this...
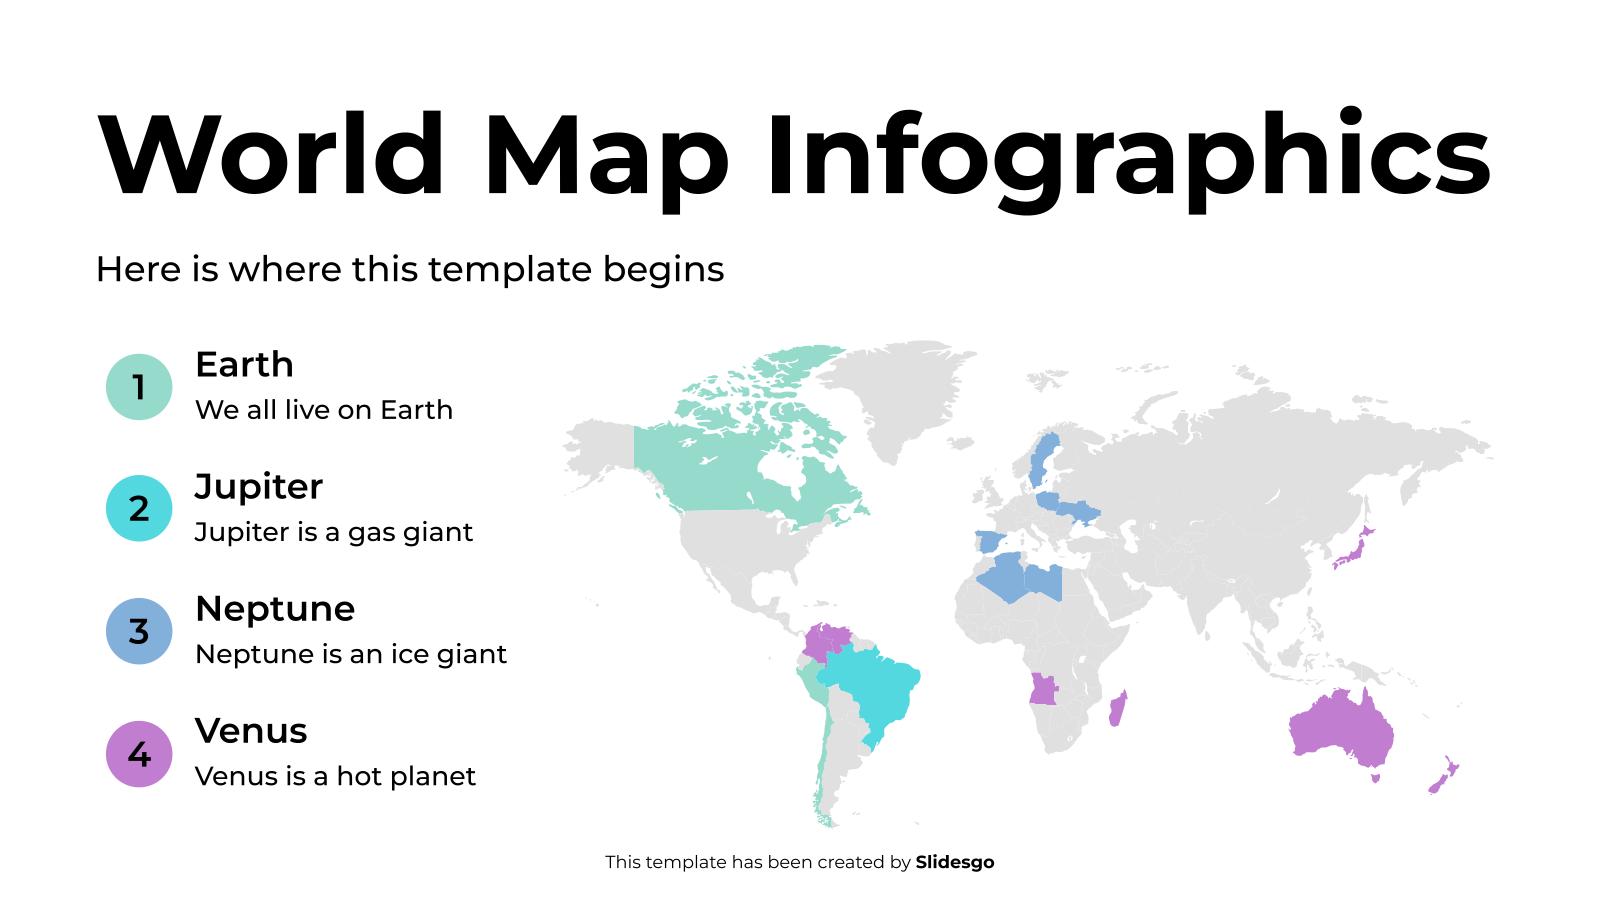
Download the World Map Infographics template for PowerPoint or Google Slides and discover this set of editable infographics for education presentations. These resources, from graphs to tables, can be combined with other presentations or used independently. The most important thing is what you will achieve: transmit information in an orderly...

Download the Agile Project Infographics template for PowerPoint or Google Slides to get the most out of infographics. Whether you want to organize your business budget in a table or schematically analyze your sales over the past year, this set of infographic resources will be of great help. Start using...

Download the Comparison Infographics template for PowerPoint or Google Slides to get the most out of infographics. Whether you want to organize your business budget in a table or schematically analyze your sales over the past year, this set of infographic resources will be of great help. Start using infographics...
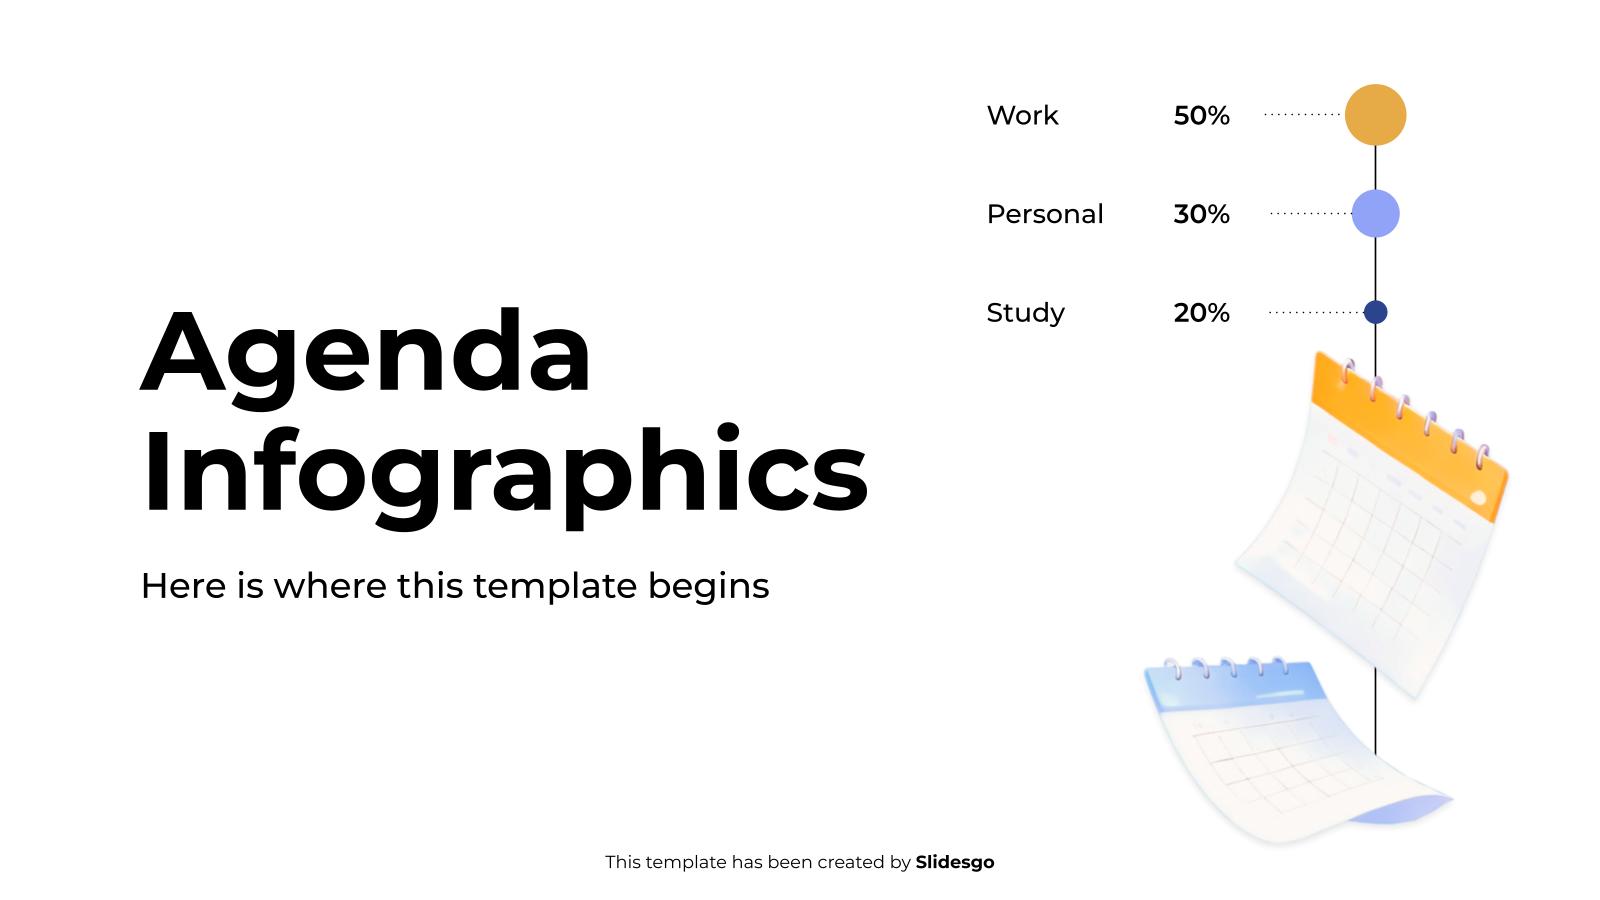
Download the Agenda Infographics template for PowerPoint or Google Slides to get the most out of infographics. Whether you want to organize your business budget in a table or schematically analyze your sales over the past year, this set of infographic resources will be of great help. Start using infographics...

Download the Project Roadmap Infographics template for PowerPoint or Google Slides to get the most out of infographics. Whether you want to organize your business budget in a table or schematically analyze your sales over the past year, this set of infographic resources will be of great help. Start using...

Understanding big blocks of information can be hard, but how about you represent it in the form of a dashboard? Make use of our designs now to do so! All our slides have been designed in a linear style, meaning the shapes have no fill color. Bar graphs, pie charts,...
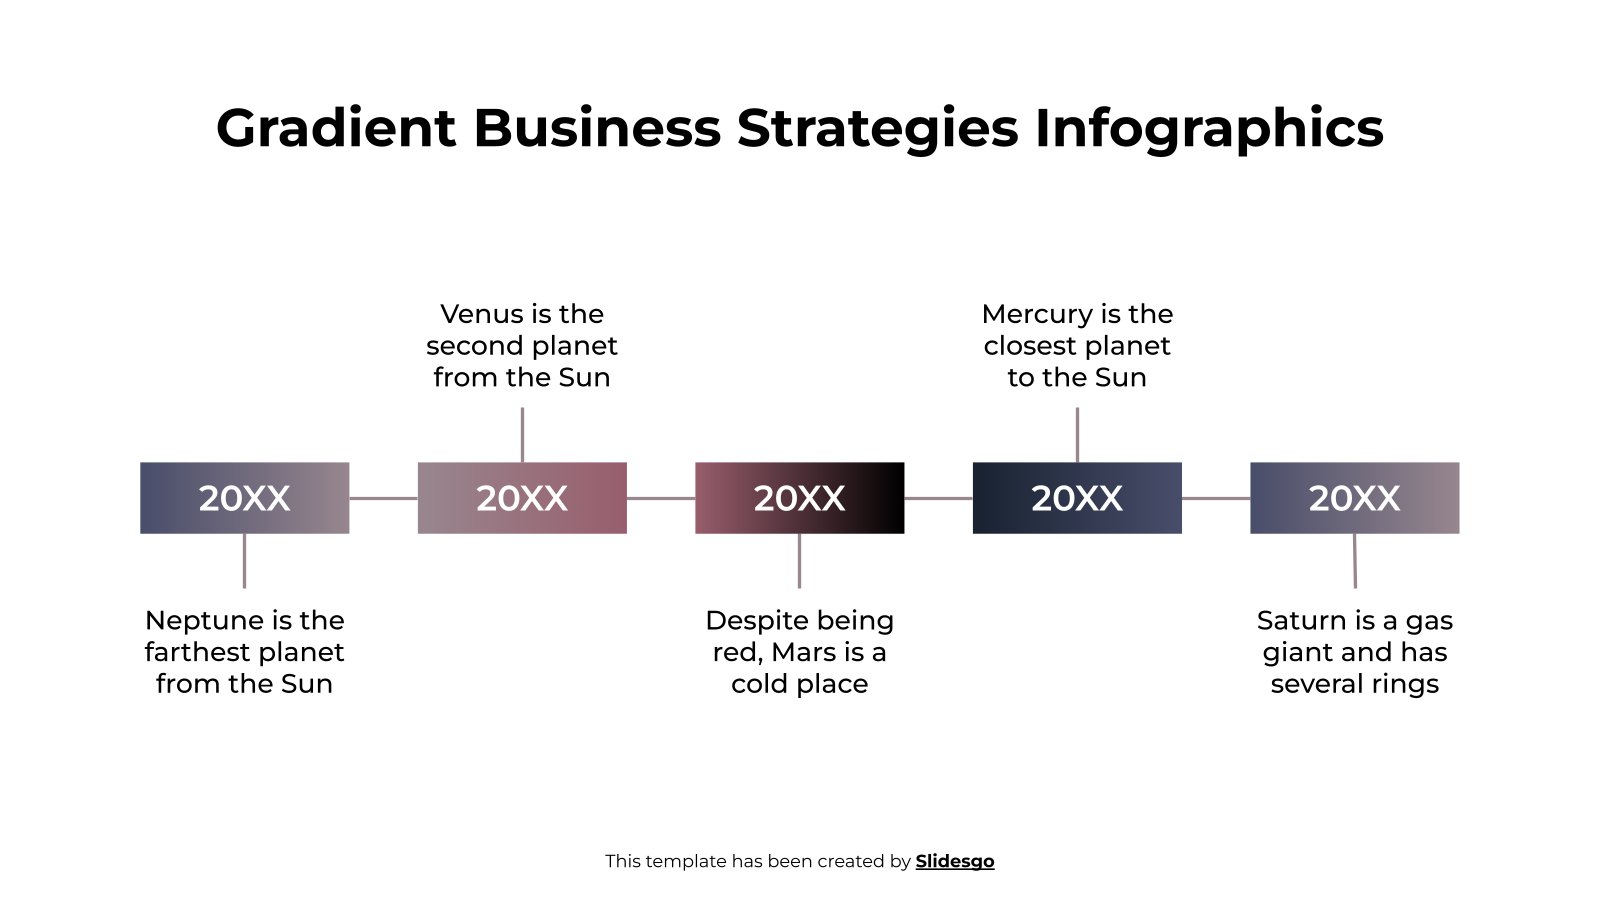
The power of visual communication is undeniable, and timeline infographics have proven to be an impactful way of presenting complex information in a simple, engaging way. With endless possibilities for customization, editable timeline infographics like this one are ideal for creative minds seeking to convey their message in a unique,...
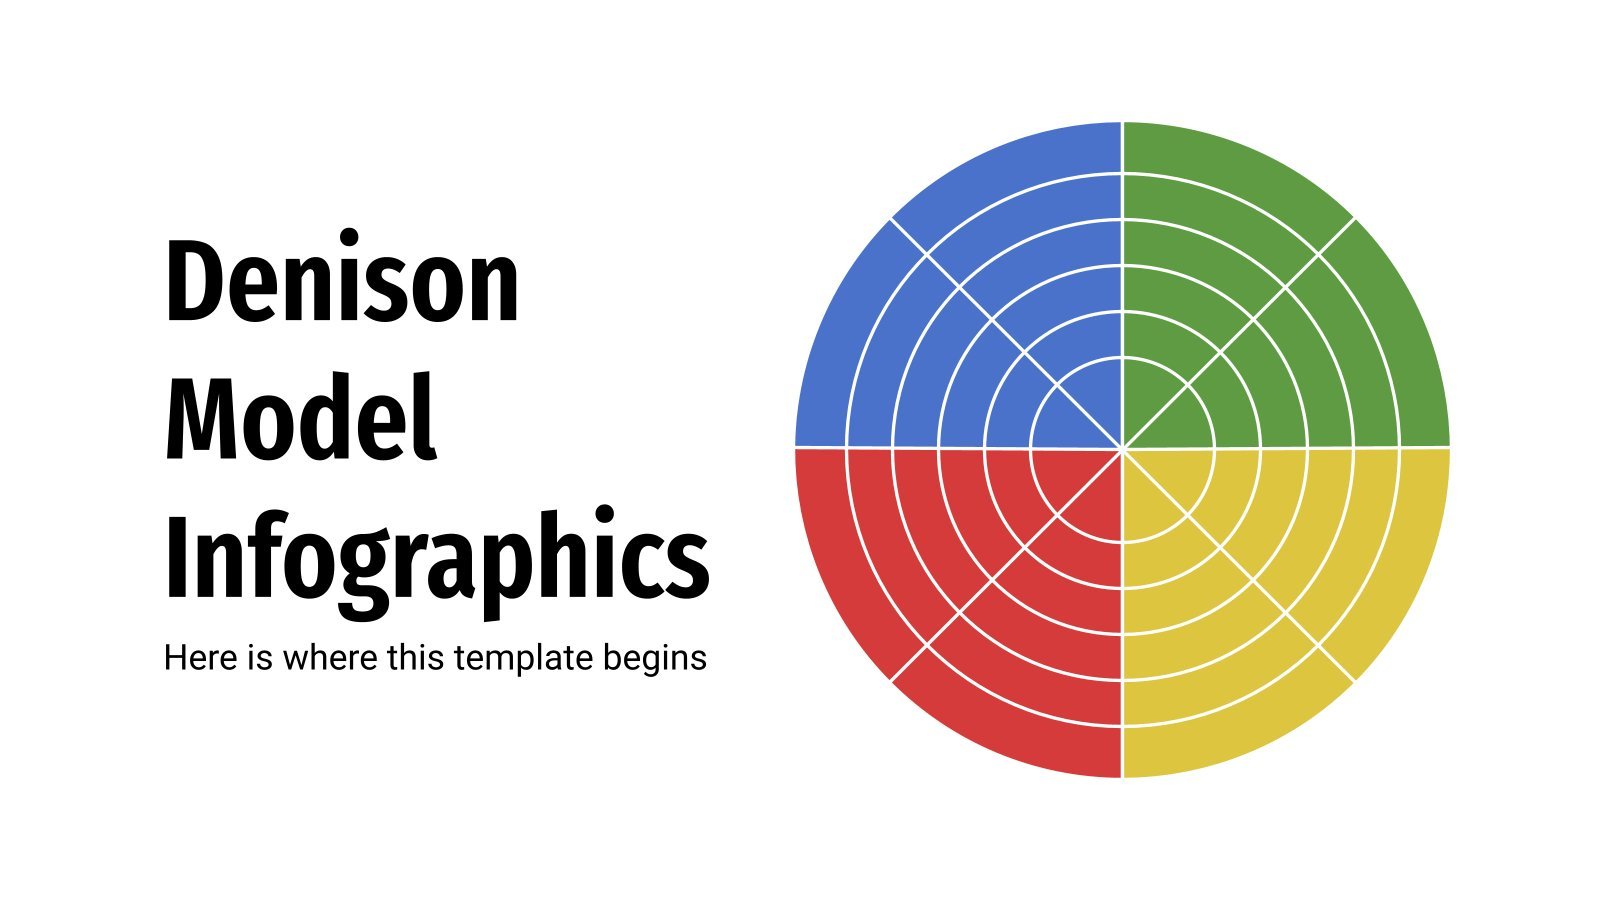
The Denison model is based on the research of Dr. Daniel Denison, who related organizational culture to certain business performance indicators. Both must be aligned to achieve business objectives. This template includes dozens of graphs and flat style infographics related to this model, which analyzes four key company factors: adaptability,...
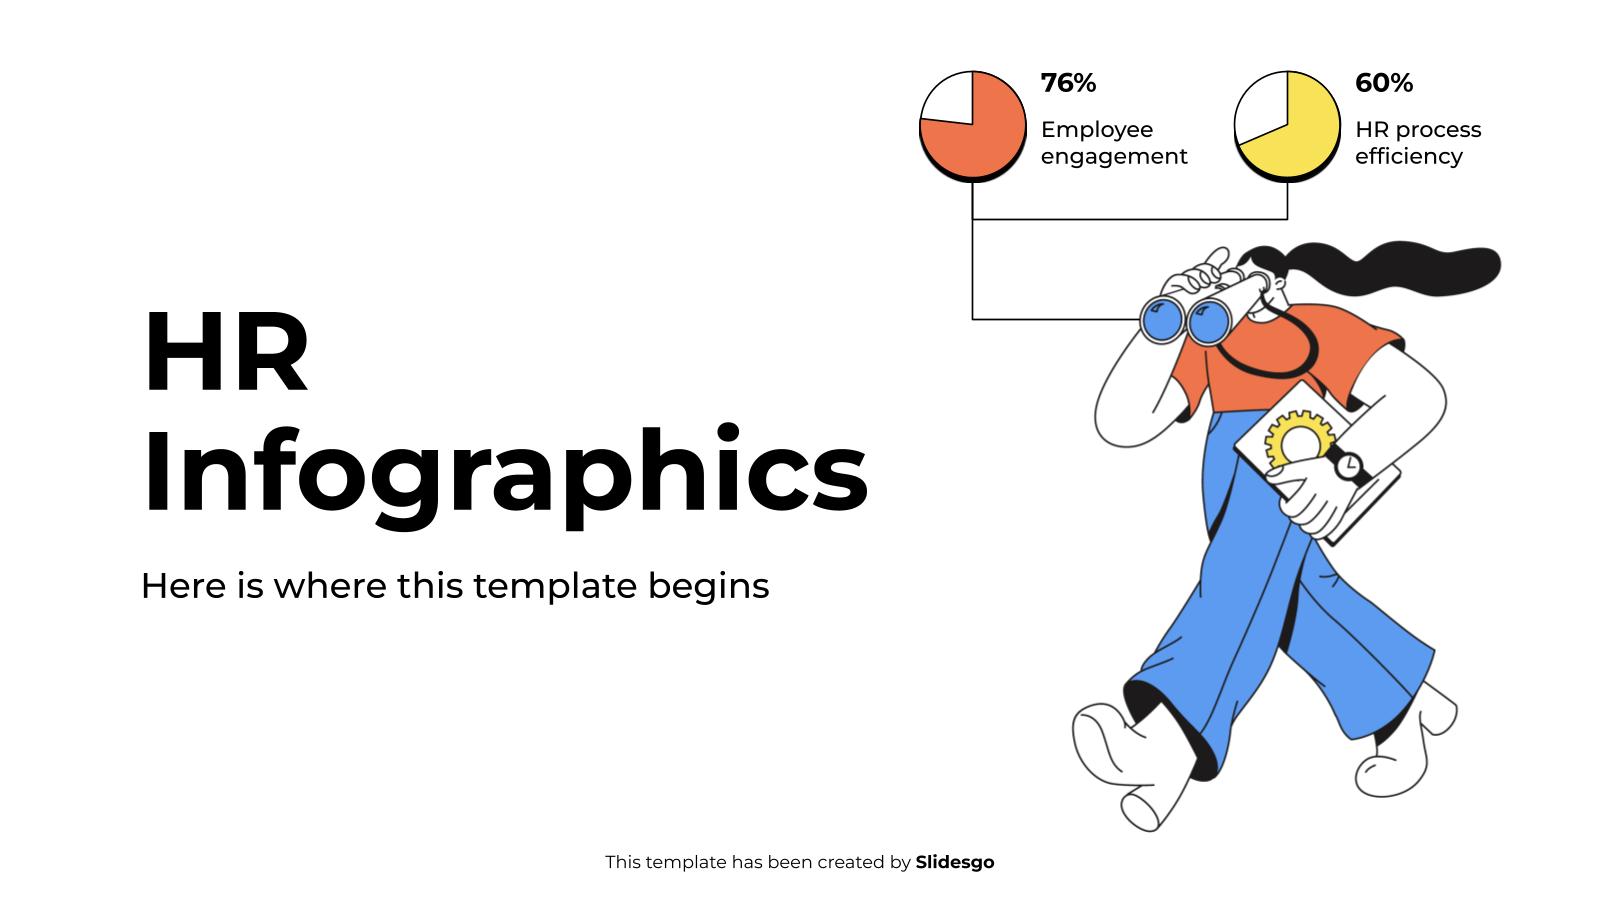
Download the HR Infographics template for PowerPoint or Google Slides to get the most out of infographics. Whether you want to organize your business budget in a table or schematically analyze your sales over the past year, this set of infographic resources will be of great help. Start using infographics...
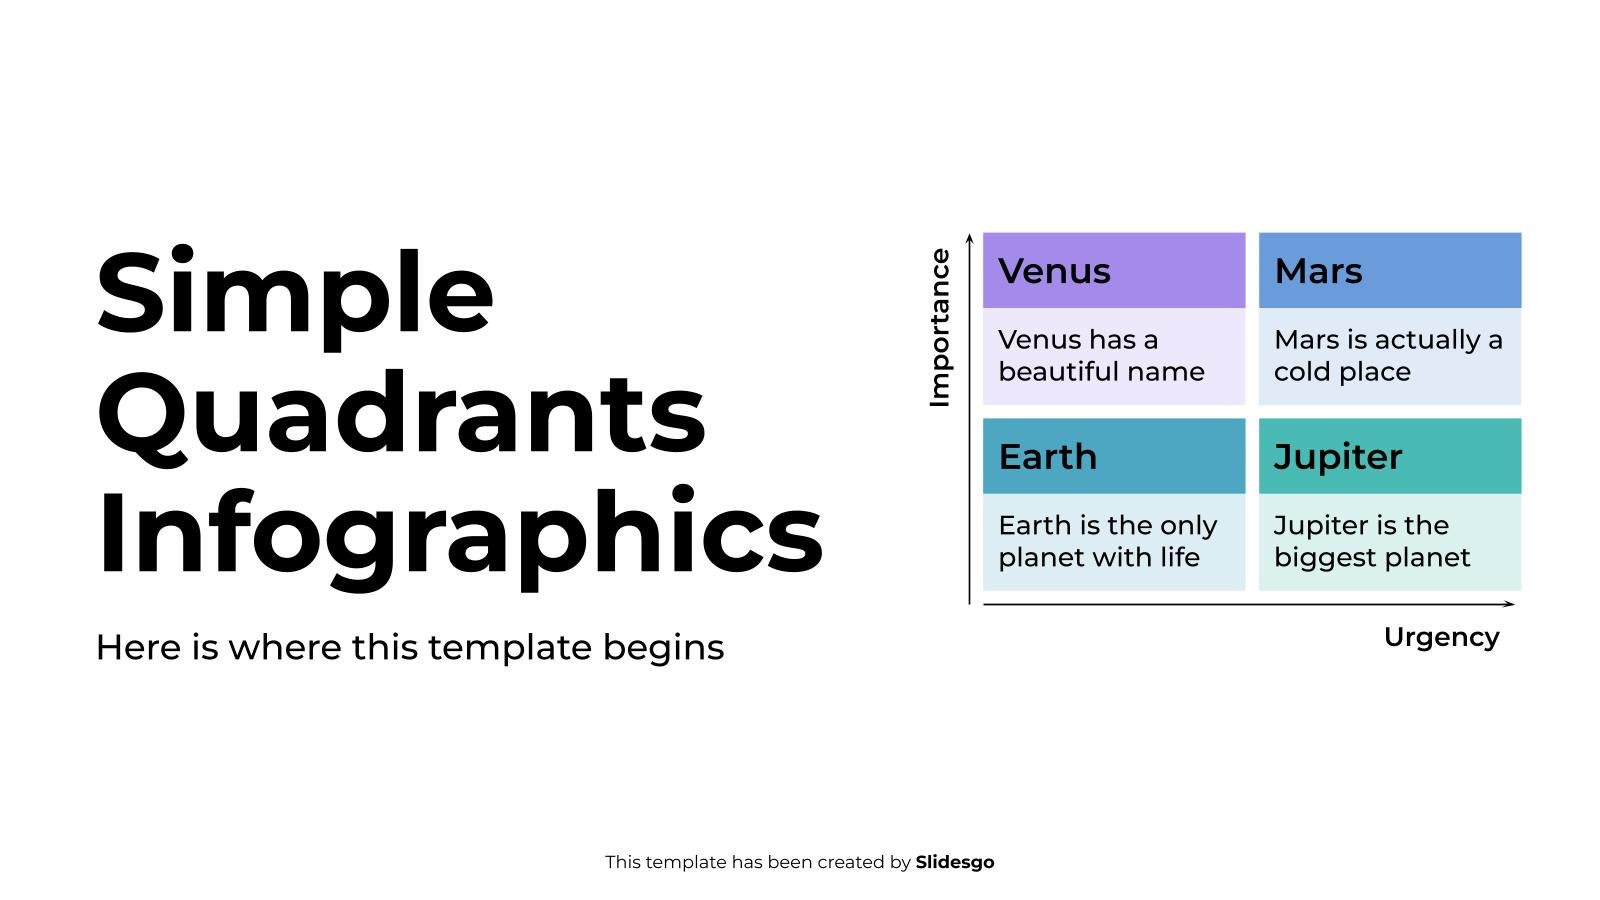
Download the Simple Quadrants Infographics template for PowerPoint or Google Slides to get the most out of infographics. Whether you want to organize your business budget in a table or schematically analyze your sales over the past year, this set of infographic resources will be of great help. Start using...
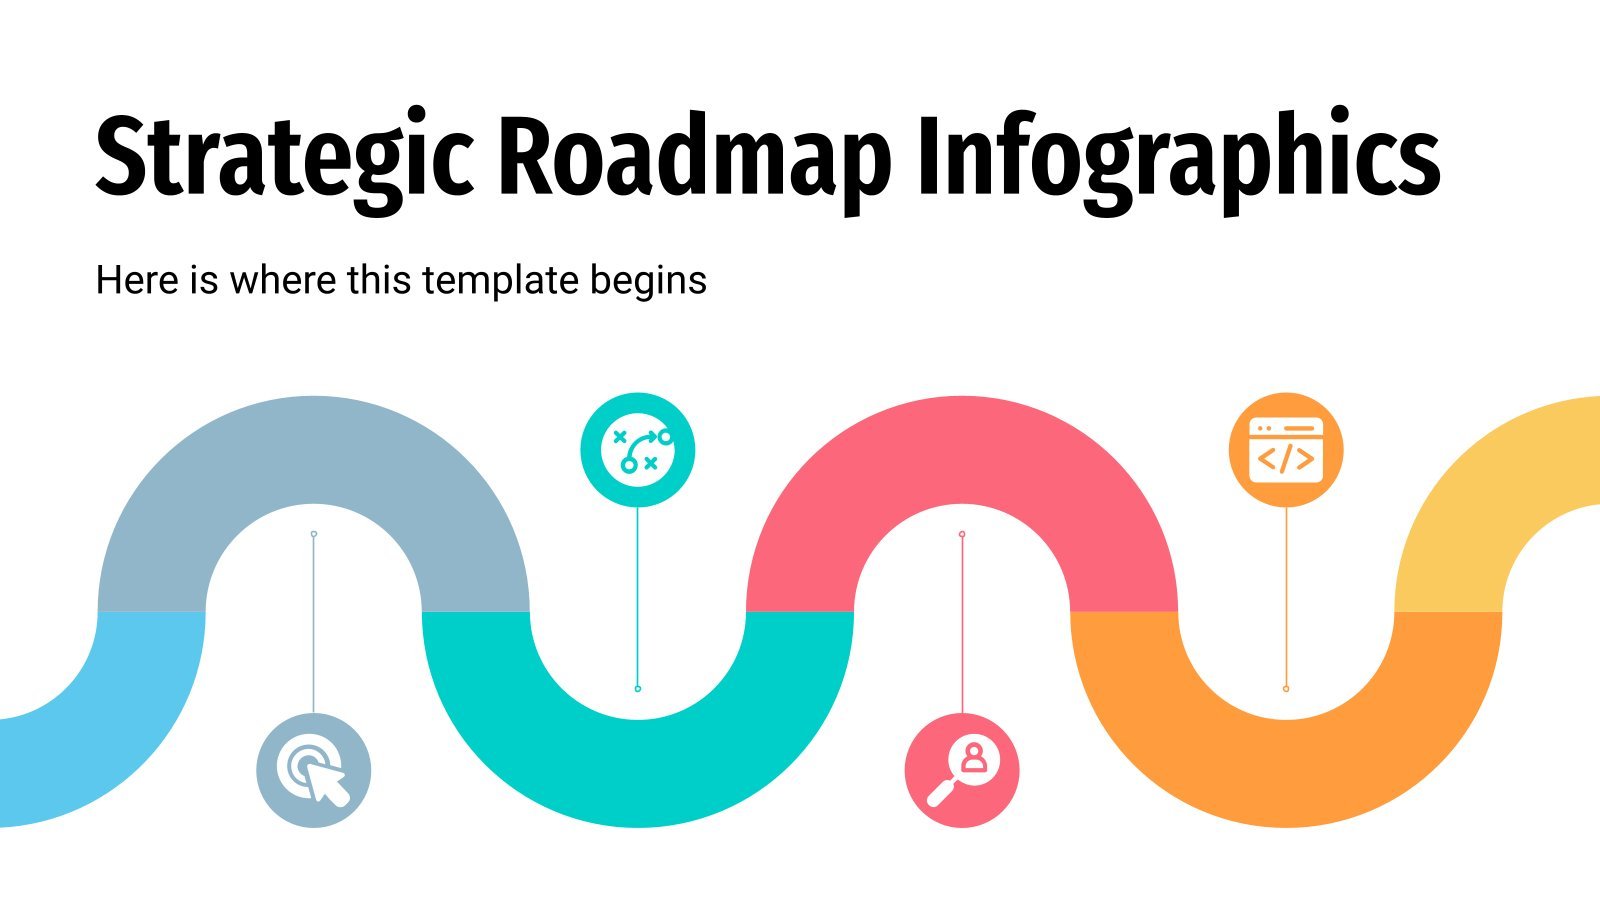
How far can your company go? We know that for you there are no limits and that your company is capable of surpassing everything it decides to do. This is great, but to organize all the goals you want to achieve, designing a strategic roadmap will be a great idea...

Download the Business Infographics template for PowerPoint or Google Slides to get the most out of infographics. Whether you want to organize your business budget in a table or schematically analyze your sales over the past year, this set of infographic resources will be of great help. Start using infographics...
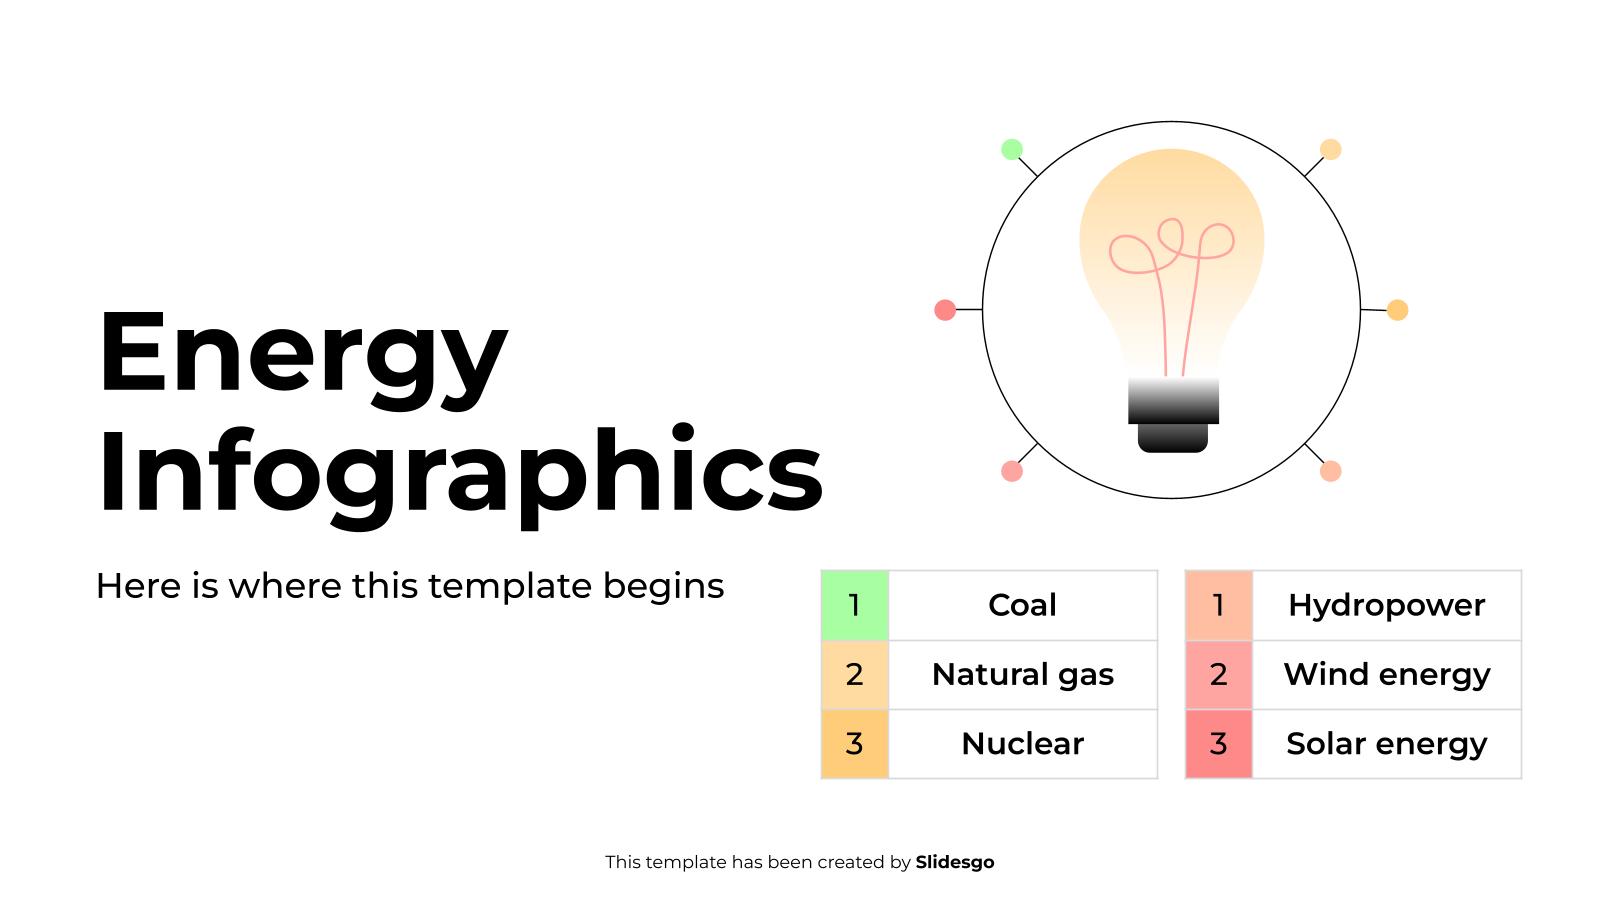
Download the Energy Infographics template for PowerPoint or Google Slides to get the most out of infographics. Whether you want to organize your business budget in a table or schematically analyze your sales over the past year, this set of infographic resources will be of great help. Start using infographics...

For a product to work 100%, you must understand 100% of the customer's needs. And not only their needs, but also their opinions, understanding who the customer is, identifying their motivations and doubts or looking for the “touchpoints” between the product and the customer. All this study and process is...

How important it is in marketing or in the world of business in general to devise and follow a good strategy to boost sales or revenue. With these infographics, you can talk about yours. We’ve got many resources and designs for you: steps, blocks, tables, comparatives… Let the team know!
At Slidesgo, we care that your company's finances go correctly and that you get the most economic benefit from everything you do. For this reason, we bring you some infographics on Return on Investment, also known as ROI. This financial indicator will measure the profitability of your project, action, or...

As a design agency, you already know about the importance of visual content! In Slidesgo we are aware of the power of visual information, that’s why we have published this set of infographics dedicated to the world of Design. In this set you will find 31 different infographics that will...