Diagram Infographics Presentation templates - Page 7
Do you have some concepts that are related to each other? It's good to put your trust in infographics, especially if you want leave your audience in awe and clapping!

It seems that you like this template!

Register for free and start downloading now
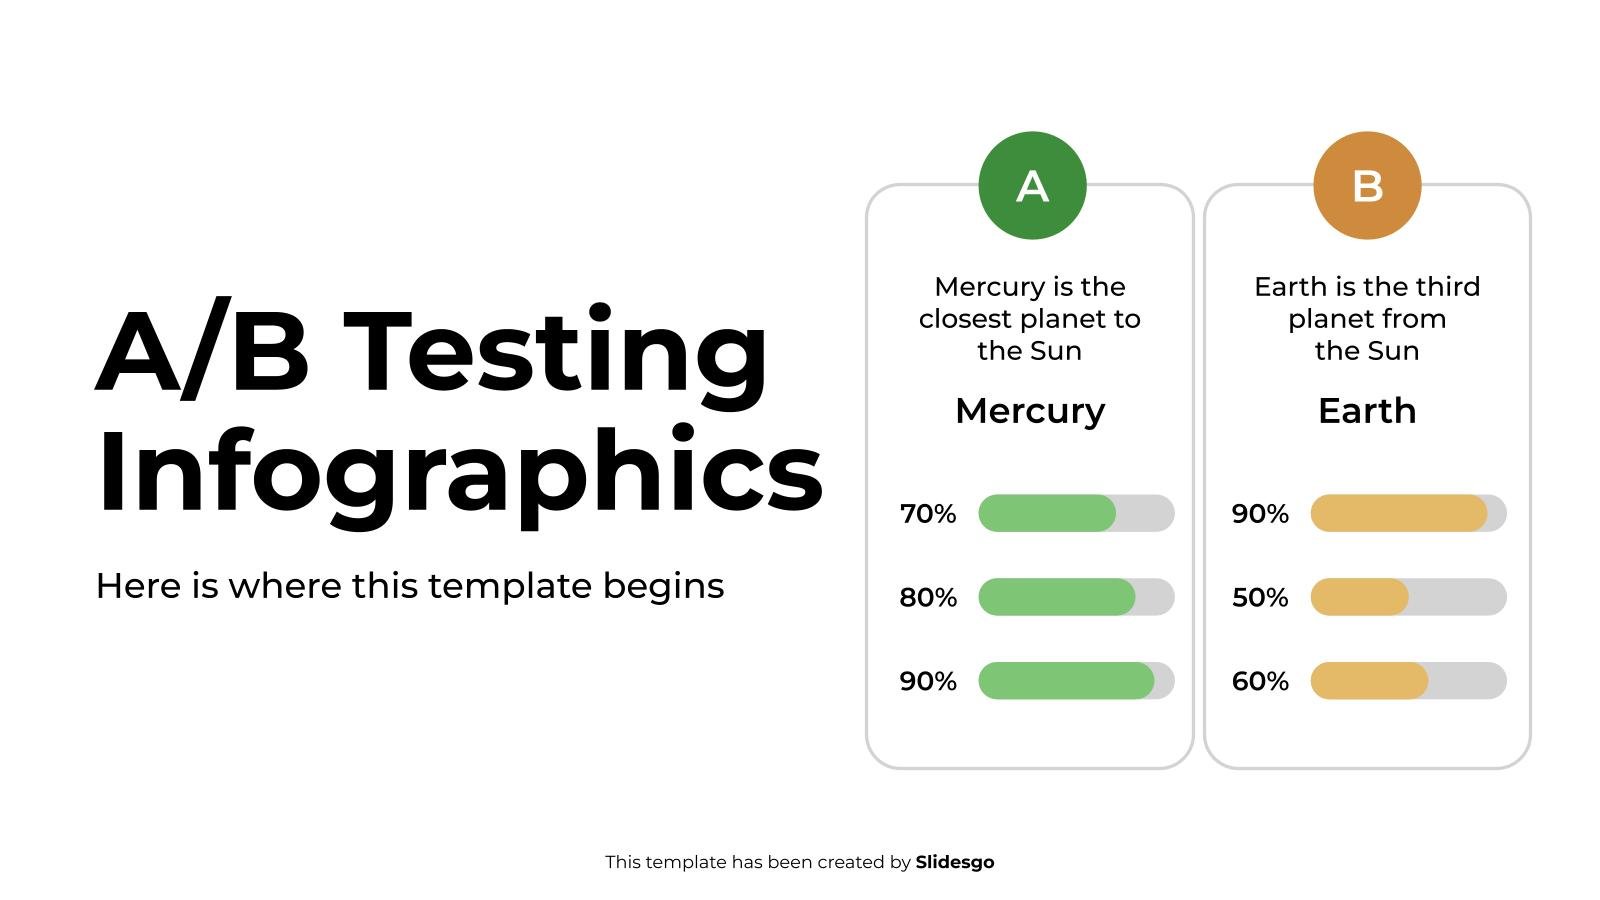
Download the A/B Testing Infographics template for PowerPoint or Google Slides to get the most out of infographics. Whether you want to organize your business budget in a table or schematically analyze your sales over the past year, this set of infographic resources will be of great help. Start using...

These Spiral Diagrams with gradients represent sequences or progressions, and we have added some text columns, icons, enumerations, colors and other resources to create hierarchies and to differentiate their 4 to 6 sections. They are great for providing business data. They appear as spiral and circle charts displaying gradients.
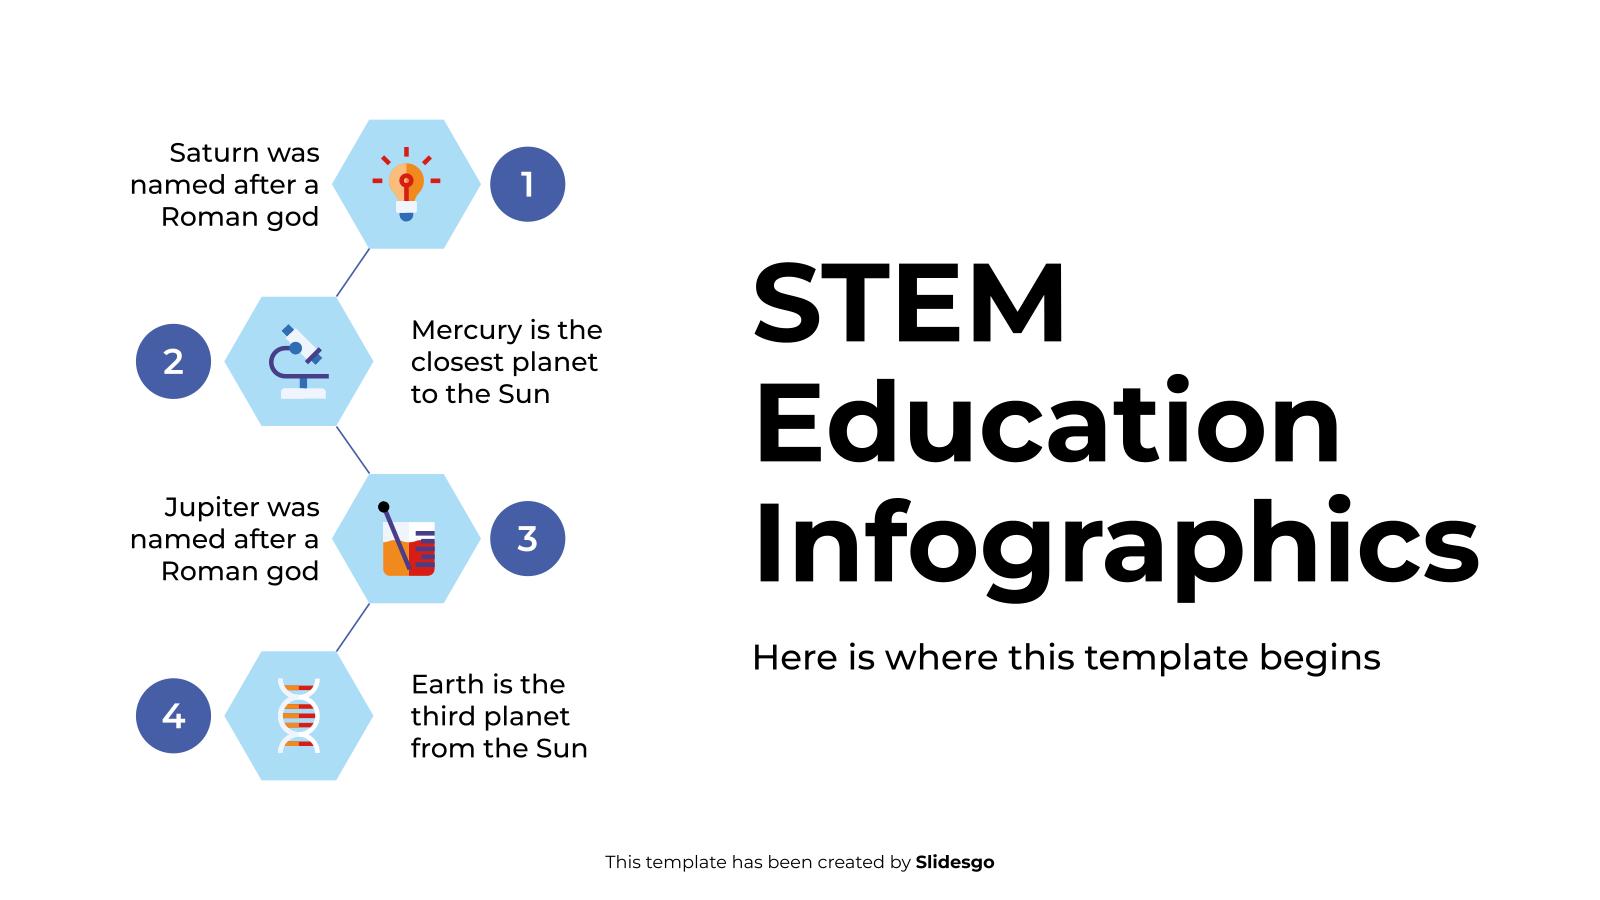
Download the STEM Education Infographics template for PowerPoint or Google Slides and discover this set of editable infographics for education presentations. These resources, from graphs to tables, can be combined with other presentations or used independently. The most important thing is what you will achieve: transmit information in an orderly...

Download the Stock Market Infographics template for PowerPoint or Google Slides to get the most out of infographics. Whether you want to organize your business budget in a table or schematically analyze your sales over the past year, this set of infographic resources will be of great help. Start using...

Download the Girl Power Campaign Infographics template for PowerPoint or Google Slides and discover the power of infographics. An infographic resource gives you the ability to showcase your content in a more visual way, which will make it easier for your audience to understand your topic. Slidesgo infographics like this...
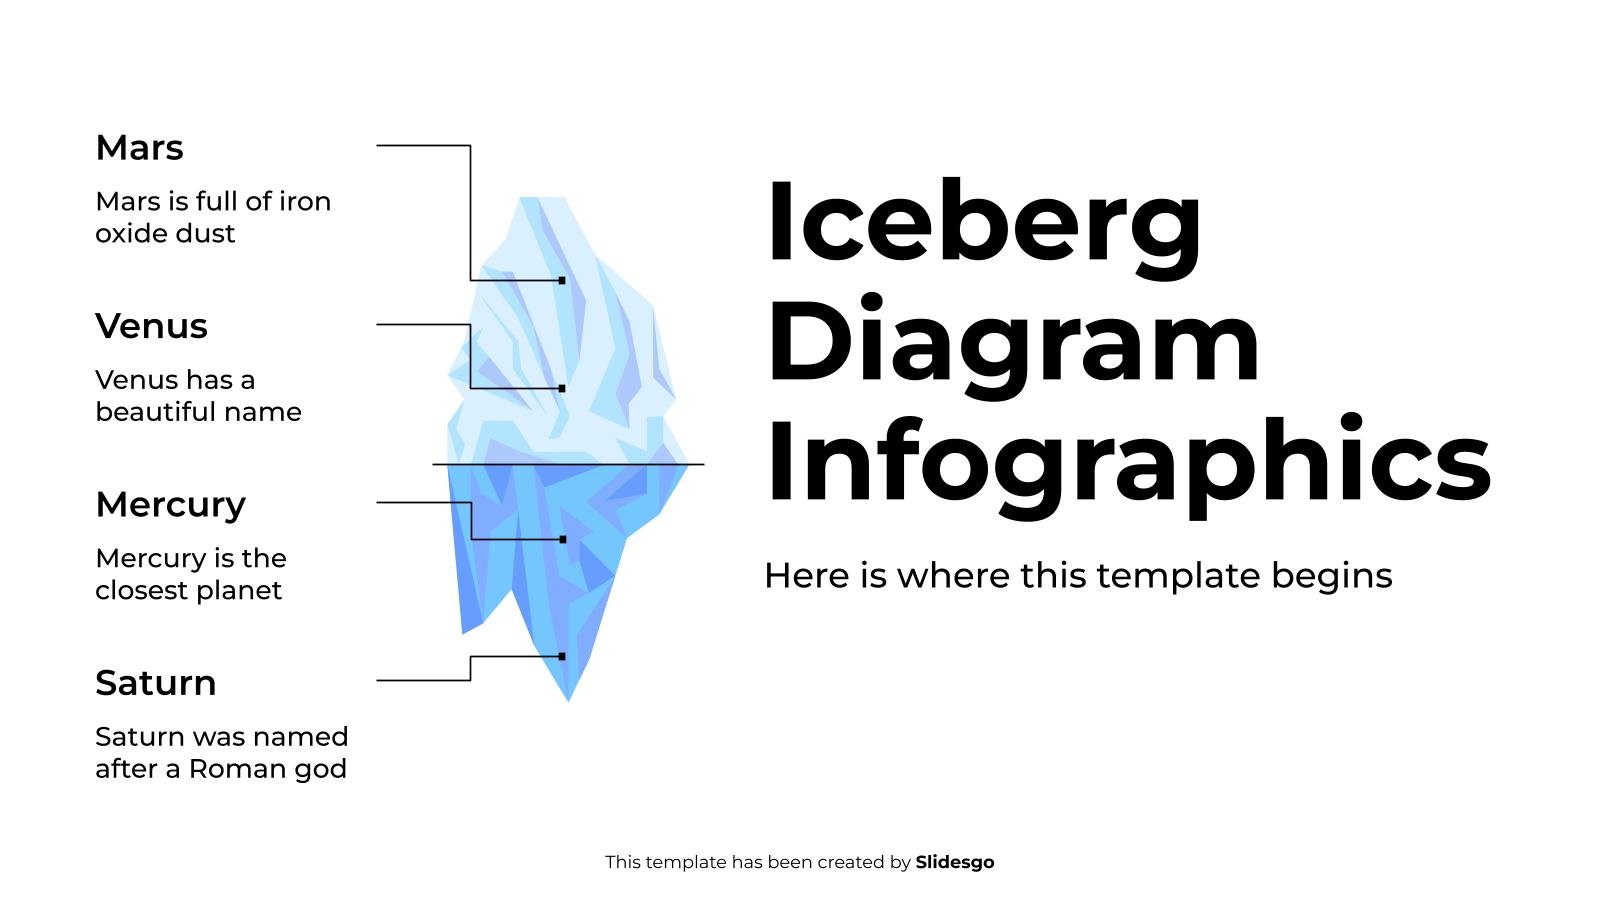
Download the Iceberg Diagram Infographics template for PowerPoint or Google Slides to get the most out of infographics. Whether you want to organize your business budget in a table or schematically analyze your sales over the past year, this set of infographic resources will be of great help. Start using...
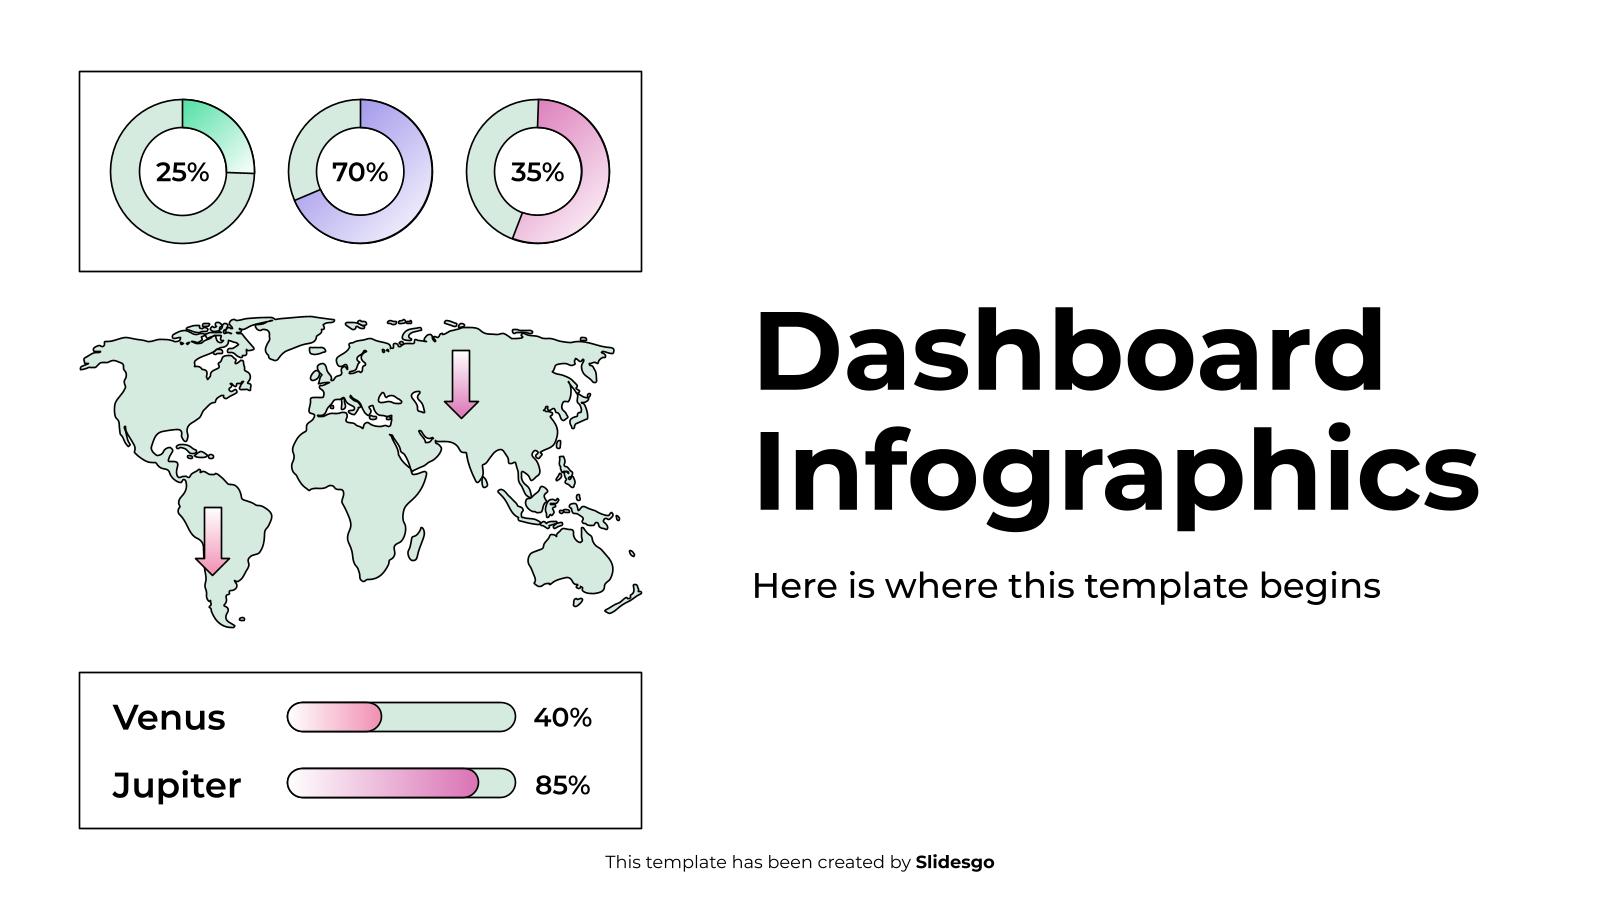
Download the Dashboard Infographics template for PowerPoint or Google Slides to get the most out of infographics. Whether you want to organize your business budget in a table or schematically analyze your sales over the past year, this set of infographic resources will be of great help. Start using infographics...
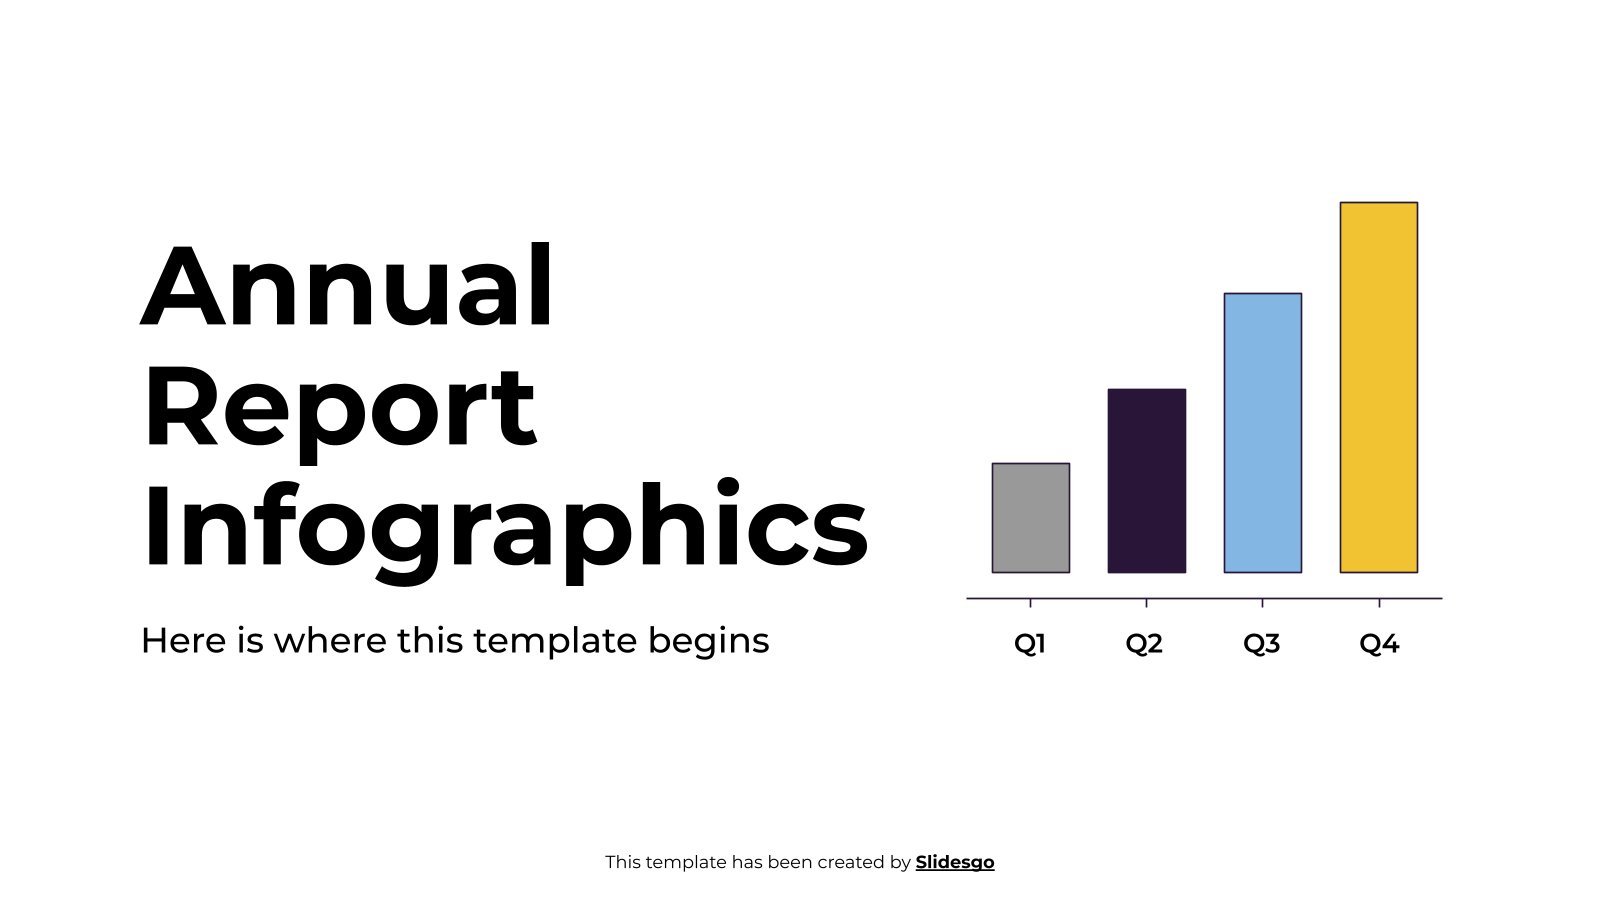
Download the "Annual Report Infographics" template for PowerPoint or Google Slides and discover the power of infographics. An infographic resource gives you the ability to showcase your content in a more visual way, which will make it easier for your audience to understand your topic. Slidesgo infographics like this set...
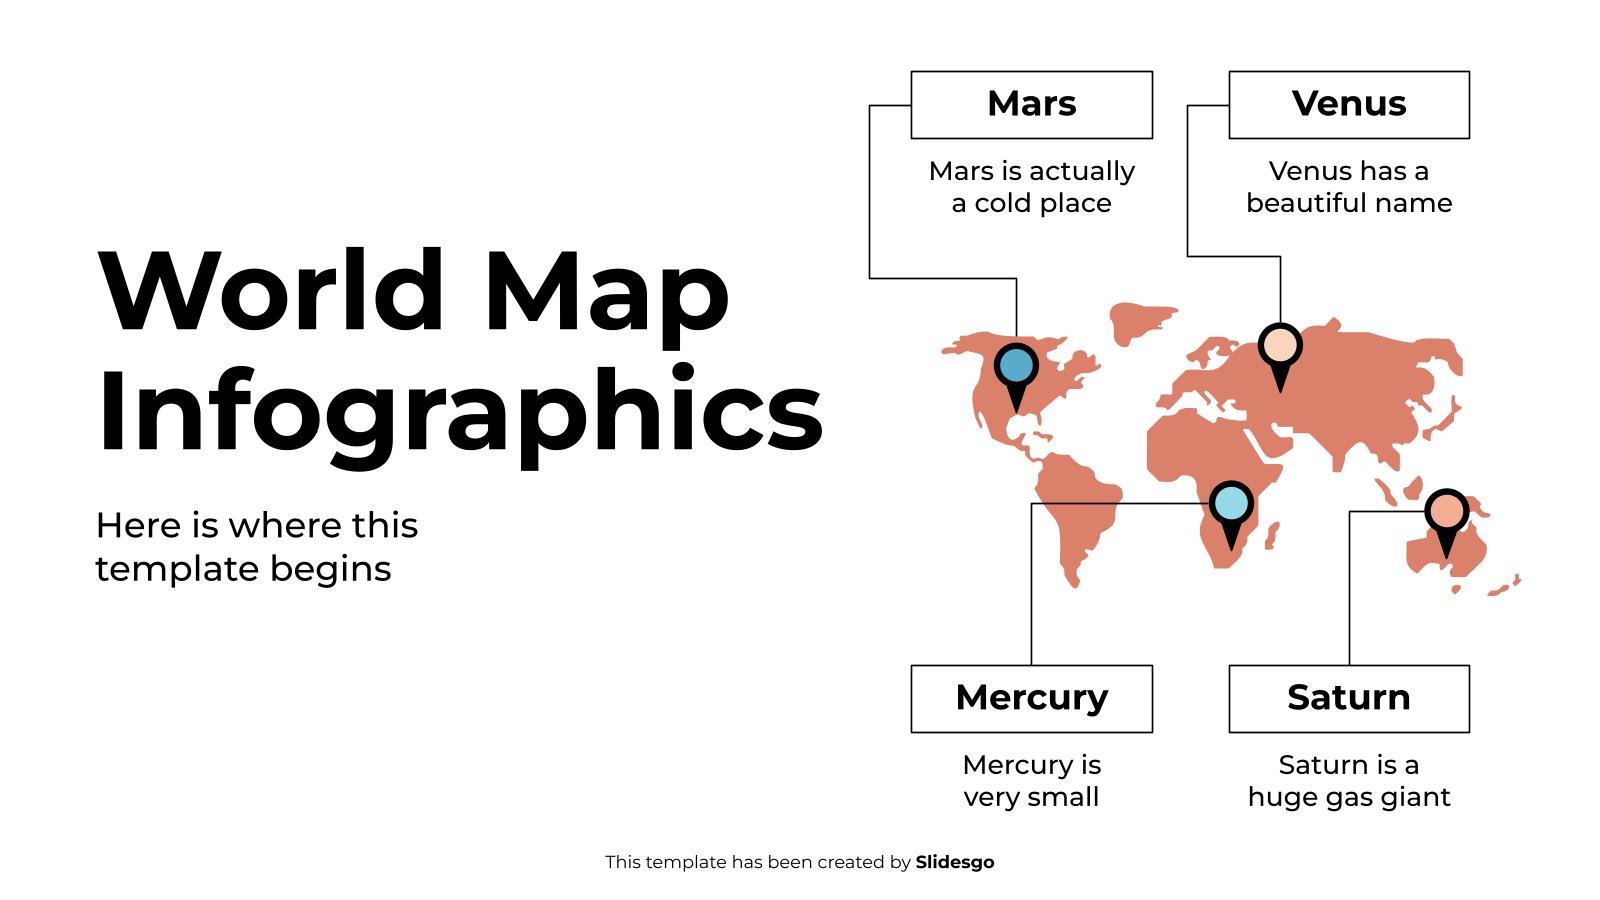
Download the World Map Infographics template for PowerPoint or Google Slides to get the most out of infographics. Whether you want to organize your business budget in a table or schematically analyze your sales over the past year, this set of infographic resources will be of great help. Start using...
Download the "Cycle Diagrams Theme for Business" presentation for PowerPoint or Google Slides. The world of business encompasses a lot of things! From reports to customer profiles, from brainstorming sessions to sales—there's always something to do or something to analyze. This customizable design, available for Google Slides and PowerPoint, is...

Download the College Lessons with Cycle Diagrams presentation for PowerPoint or Google Slides. As university curricula increasingly incorporate digital tools and platforms, this template has been designed to integrate with presentation software, online learning management systems, or referencing software, enhancing the overall efficiency and effectiveness of student work. Edit this...

If you feel that bullet points and pictures are not doing justice to your company profile, there’s no better way to highlight your achievements and metrics than by spicing up your presentation using creative and visually appealing infographics! Adding infographics to your company profile can vividly illustrate even the most...
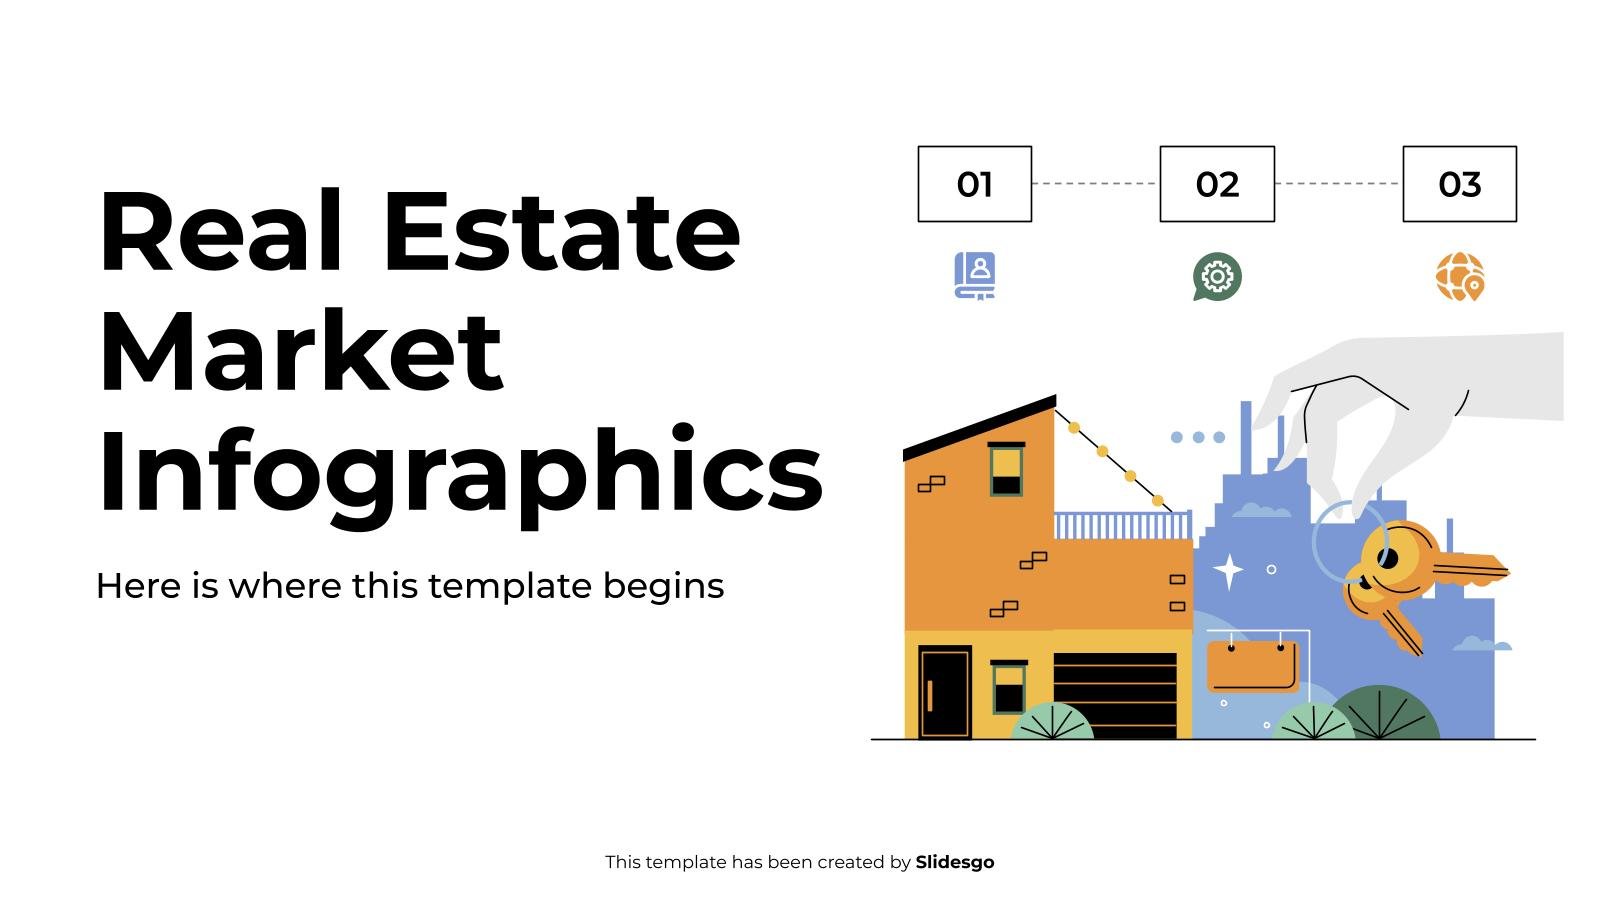
Download the Real Estate Market Infographics template for PowerPoint or Google Slides to get the most out of infographics. Whether you want to organize your business budget in a table or schematically analyze your sales over the past year, this set of infographic resources will be of great help. Start...
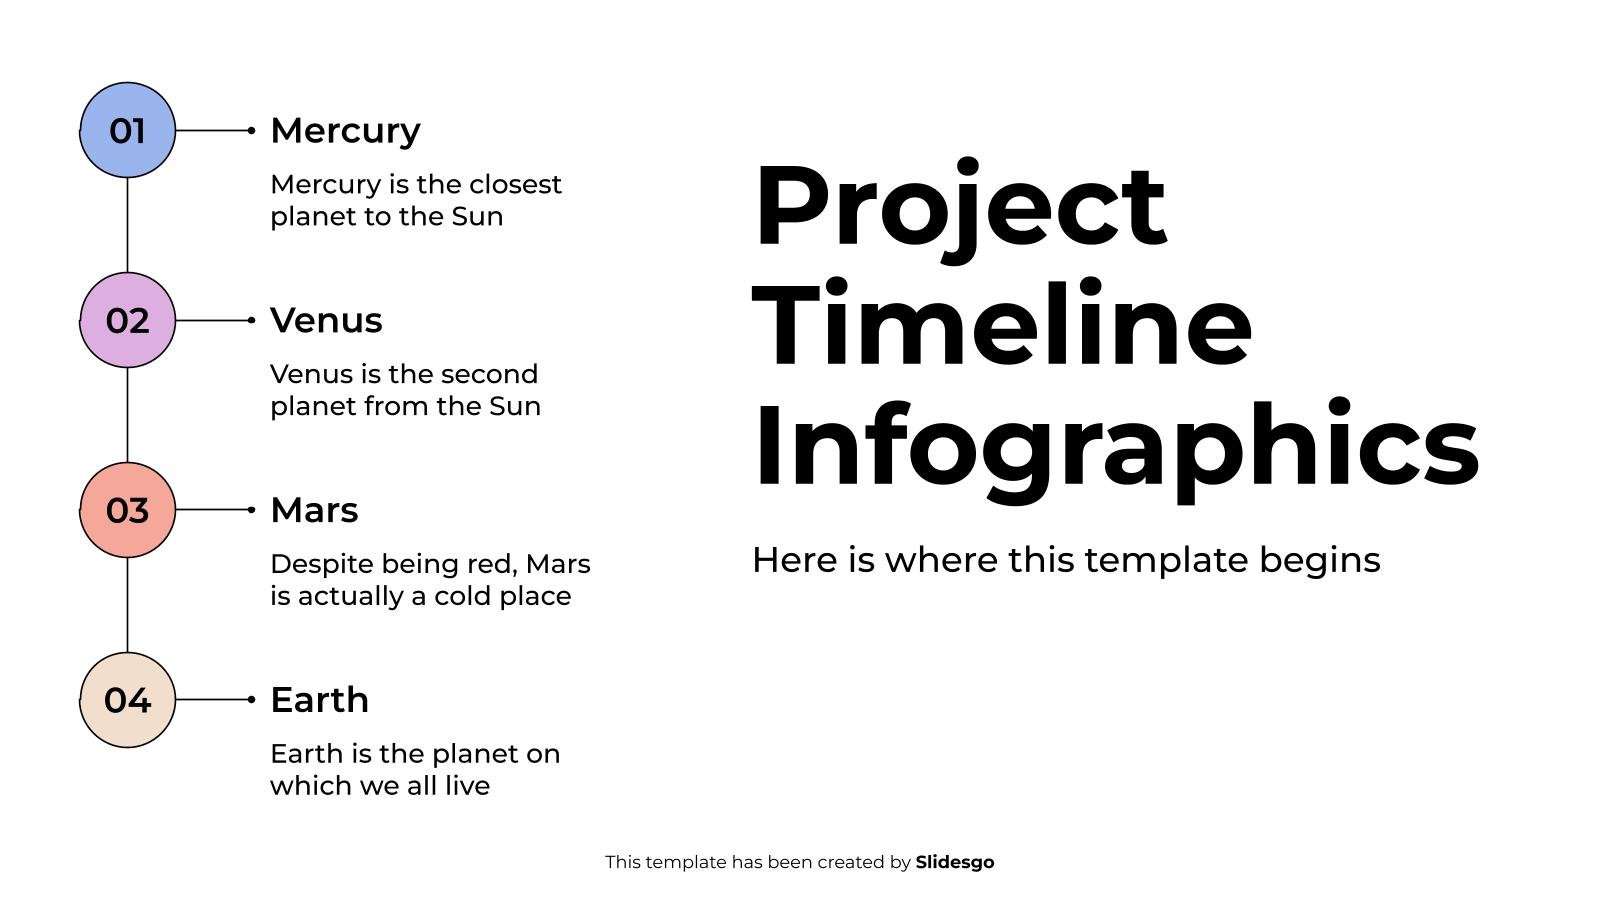
Download the Project Timeline Infographics template for PowerPoint or Google Slides to get the most out of infographics. Whether you want to organize your business budget in a table or schematically analyze your sales over the past year, this set of infographic resources will be of great help. Start using...

Download the "Data Center Business Plan Infographics" template for PowerPoint or Google Slides and discover the power of infographics. An infographic resource gives you the ability to showcase your content in a more visual way, which will make it easier for your audience to understand your topic. Slidesgo infographics like...

Brrr… cold winds, lots of rain, time to cuddle up inside with a hot chocolate or tea… or using the fall vibes to your advantage in your next marketing presentation! These infographics for Google Slides and PowerPoint bring cute stickers in the form of leaves, pumpkins and hot drinks to...

Download the Circular Diagram Infographics template for PowerPoint or Google Slides to get the most out of infographics. Whether you want to organize your business budget in a table or schematically analyze your sales over the past year, this set of infographic resources will be of great help. Start using...

Download the "Medical Infographics" template for PowerPoint or Google Slides. When it's time to make a medical-themed presentation, a concern arises. "Will I manage to convey a complicated medical concept?" Thanks to this template with infographic resources for medical presentations, that concern will cease to exist. Use your favorite infographics...