Diagram Infographics Presentation templates - Page 6
Do you have some concepts that are related to each other? It's good to put your trust in infographics, especially if you want leave your audience in awe and clapping!


It seems that you like this template!

Register for free and start downloading now
Download the Types of Business Structures Infographics template for PowerPoint or Google Slides to get the most out of infographics. Whether you want to organize your business budget in a table or schematically analyze your sales over the past year, this set of infographic resources will be of great help....

Download the "Building Blocks Diagram Consulting Toolkit" presentation for PowerPoint or Google Slides. Your business demands smart solutions, and this consulting toolkit template is just that! This versatile and ingenious toolkit will provide you with the essential tools you need to shape your strategies and make informed decisions. Whether you...
Revamp your marketing strategy with this all-encompassing collection of infographics, rounding up every strategy, move, schedule, and analysis included in your marketing plan. With this fully editable Google Slides and PowerPoint template, you now have a powerful variety of visual tools at your fingertips. With a cream color scheme and...

Download the Marketing Theme with Cycle Diagrams presentation for PowerPoint or Google Slides and take your marketing projects to the next level. This template is the perfect ally for your advertising strategies, launch campaigns or report presentations. Customize your content with ease, highlight your ideas and captivate your audience with...

Download the Monthly KPIs Overview Infographics template for PowerPoint or Google Slides to get the most out of infographics. Whether you want to organize your business budget in a table or schematically analyze your sales over the past year, this set of infographic resources will be of great help. Start...

Download the Science Process Diagrams template for PowerPoint or Google Slides to get the most out of infographics. Whether you want to organize your business budget in a table or schematically analyze your sales over the past year, this set of infographic resources will be of great help. Start using...

Parents know that when their children reach their teen age, their behavior start to change. Help everyone detect possible abnormal behavior in teenagers by giving a speech (with a presentation) on that matter. If you need to provide statistics or big blocks of data, we have some infographics that will...

If you need to represent data about education and/or school centers or subjects, and you need to do it as visually attractive as possible, our diagrams are cut out for the job. All the designs revolve around stationery, books, backpacks and other school-related objects. The graphic styles included are flat,...
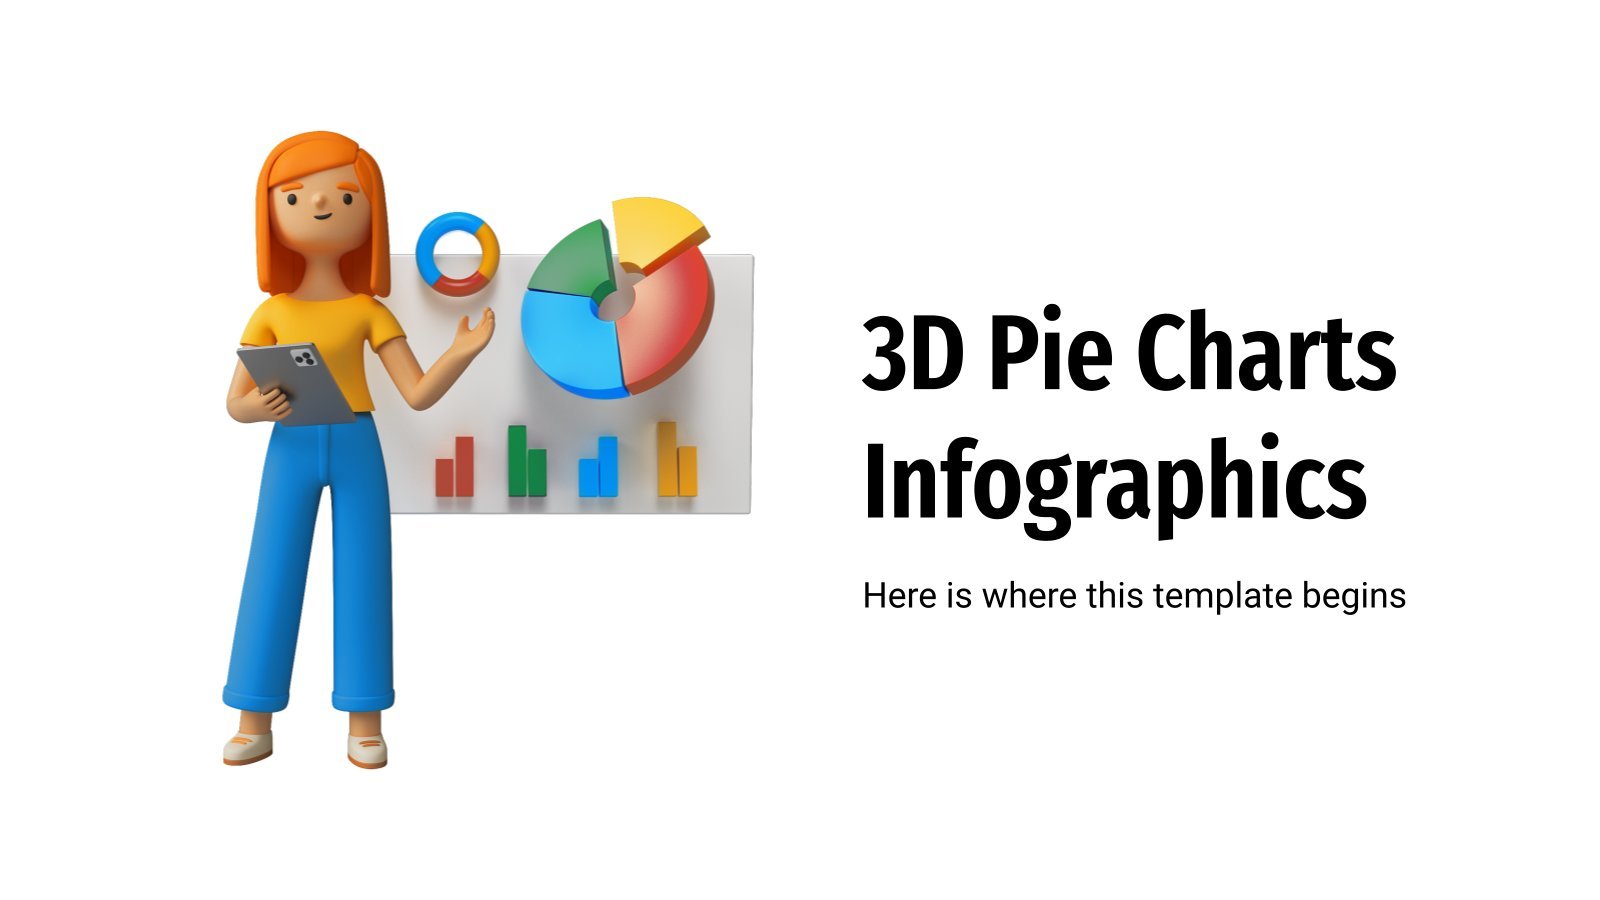
The popularity and clarity of pie charts make them the queen of all graphs! At a glance, you can see the percentage that corresponds to each slice, and if various colors are used too... the better! Slidesgo has this new template for you, which is a collection of around thirty...

Download the Cycle Diagrams Theme for Education presentation for PowerPoint or Google Slides. The education sector constantly demands dynamic and effective ways to present information. This template is created with that very purpose in mind. Offering the best resources, it allows educators or students to efficiently manage their presentations and...

Download the "Cycle Diagrams Theme for a Business Meeting" presentation for PowerPoint or Google Slides. Gone are the days of dreary, unproductive meetings. Check out this sophisticated solution that offers you an innovative approach to planning and implementing meetings! Detailed yet simplified, this template ensures everyone is on the same...

Download the "Building Blocks Diagrams for a Business Plan" presentation for PowerPoint or Google Slides. Conveying your business plan accurately and effectively is the cornerstone of any successful venture. This template allows you to pinpoint essential elements of your operation while your audience will appreciate the clear and concise presentation,...

Download the Comparison Infographics template for PowerPoint or Google Slides to get the most out of infographics. Whether you want to organize your business budget in a table or schematically analyze your sales over the past year, this set of infographic resources will be of great help. Start using infographics...
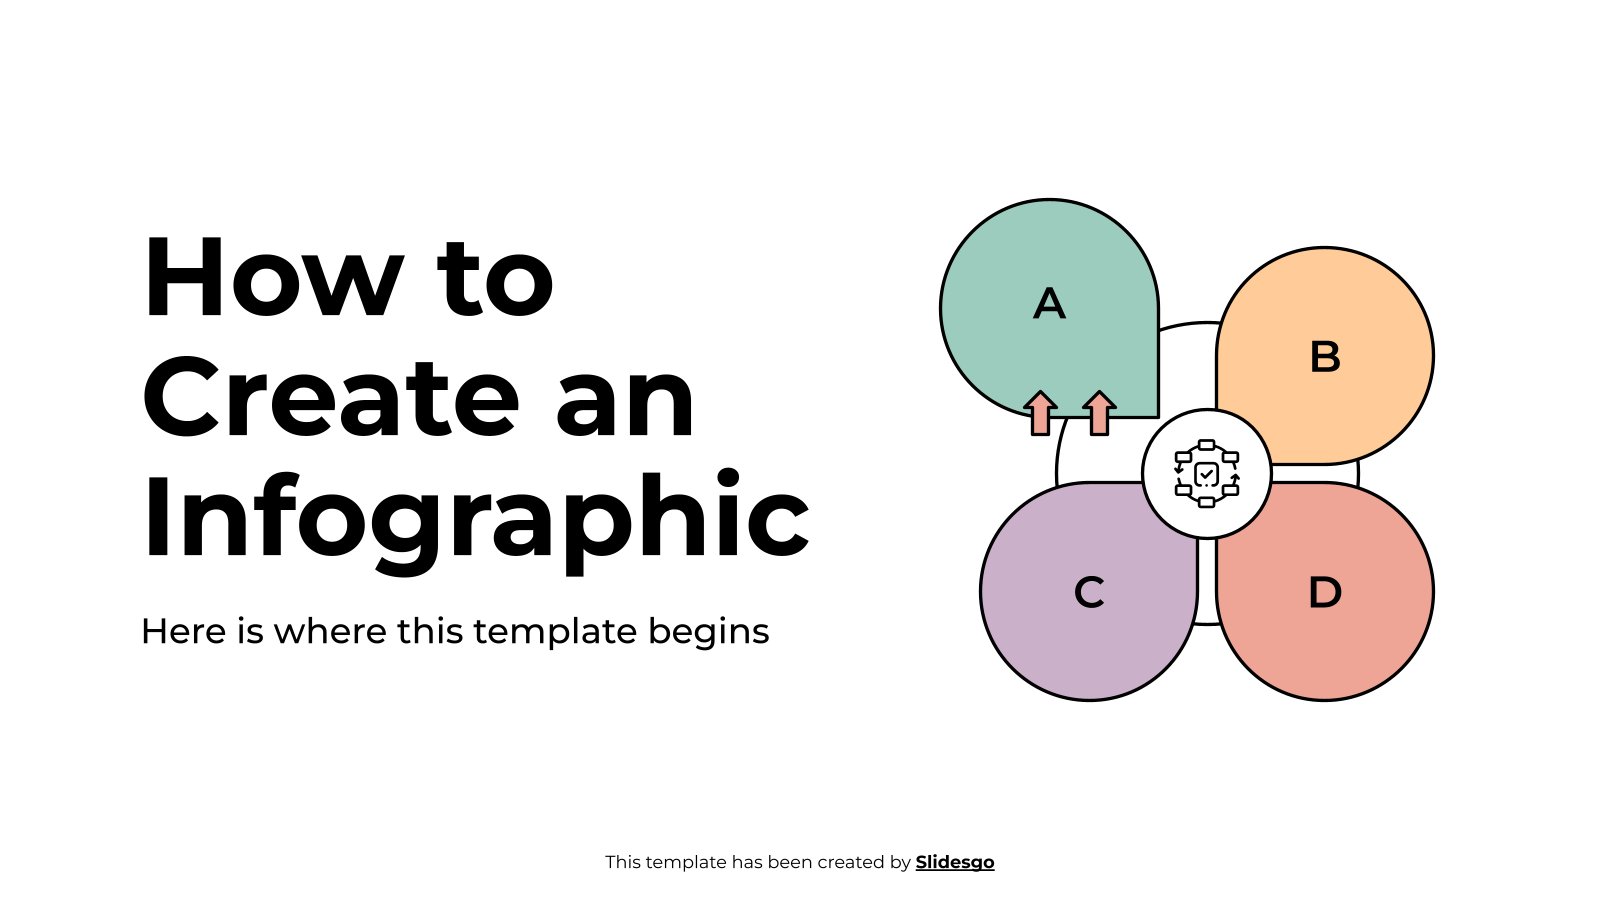
Download the How To Create An Infographic template for PowerPoint or Google Slides and discover the power of infographics. An infographic resource gives you the ability to showcase your content in a more visual way, which will make it easier for your audience to understand your topic. Slidesgo infographics like...

Download the "Art Infographics" template for PowerPoint or Google Slides and discover the power of infographics. An infographic resource gives you the ability to showcase your content in a more visual way, which will make it easier for your audience to understand your topic. Slidesgo infographics like this set here...

Are you in need of a way to visually convey a group of ideas or concepts and how they are related to each other? And perhaps the topic is yoga? Introducing our new set of infographics! We've combined both "worlds" and this is the result. Icons, imagery and illustrations of...

We can’t wait to see your reaction when you open these infographics! We’re sure between you and Slidesgo there’s a lot of chemistry, specially when we offer you so many editable resources with amazing designs. Take a look at these resources for chemists and make speaking about replacement, decomposition or...

Download the "Cycle Diagrams Theme for a Project Proposal" presentation for PowerPoint or Google Slides. A well-crafted proposal can be the key factor in determining the success of your project. It's an opportunity to showcase your ideas, objectives, and plans in a clear and concise manner, and to convince others...