Premium template
To keep enjoying the content of these slides, you must be a Premium user. Become Premium from €1.67 per month!

Premium template
To keep enjoying the content of these slides, you must be a Premium user. Become Premium from €1.67 per month!

Premium template
To keep enjoying the content of these slides, you must be a Premium user. Become Premium from €1.67 per month!

Premium template
To keep enjoying the content of these slides, you must be a Premium user. Become Premium from €1.67 per month!

Premium template
To keep enjoying the content of these slides, you must be a Premium user. Become Premium from €1.67 per month!


How to Graph and Shade Linear Inequalities Presentation
Premium template
Are linear inequalities getting you down? Turn that frown upside down with this modern and cool lesson on how to graph and shade linear inequalities. With illustrations and fun visuals, you’ll learn how to graph and shade linear inequalities in no time. Perfect for students who want to ace their math exams or teachers who want to create lesson plans in just a click. This lesson comes in different languages, so choose your favourite and let the numbers speak!
Features of this template
- Designed for High School
- 100% editable and easy to modify
- 10 different slides to impress your audience
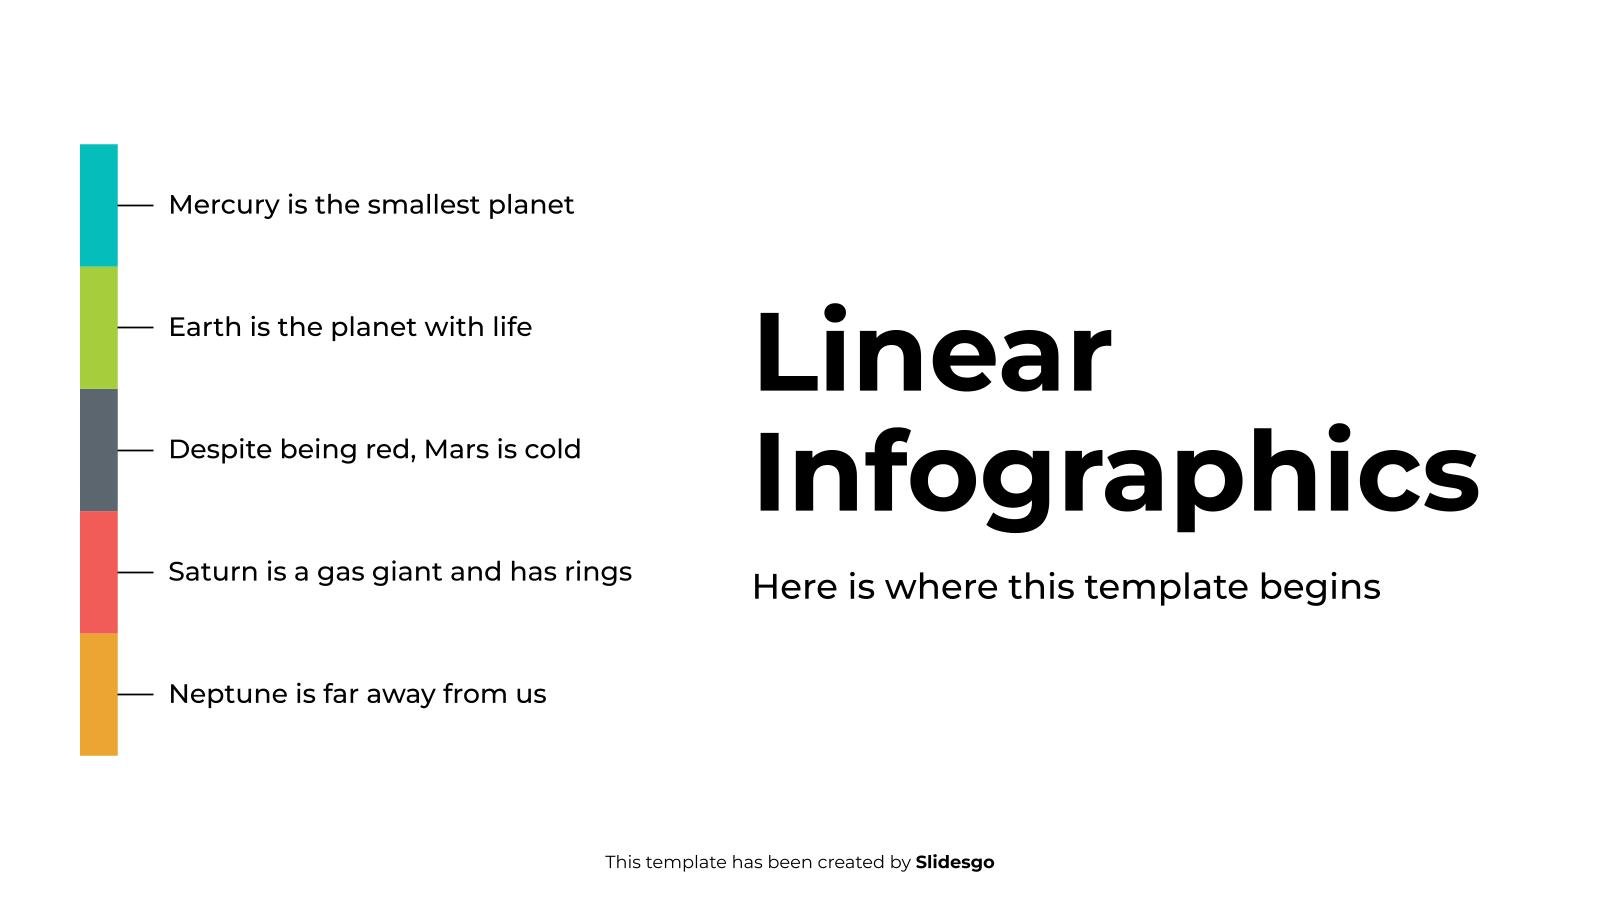
- Contains easy-to-edit graphics such as graphs, maps, tables, timelines and mockups
- Includes 500+ icons and Flaticon’s extension for customizing your slides
- Designed to be used in Google Slides, Canva, and Microsoft PowerPoint
- 16:9 widescreen format suitable for all types of screens
- Includes information about fonts, colors, and credits of the resources used
- Available in different languages
- Learn more in How to use this template?
Available languages
Available languages

Register for free and start downloading now
Related templates


Popular templates