Process Presentation templates - Page 3
Action always needs a process, whether this action is to give a language class or all the necessary steps for the creation of a vaccine. They can be easier or more difficult, faster, or longer processes. However, the process of using presentations about a process (redundancy aside) is easy and fast: choose one of our Google Slides themes or PowerPoint templates and start editing.


It seems that you like this template!

Register for free and start downloading now
What you'll find in this new template is a collection of infographics of the Six Sigma strategy, one of the best tools for process improvement. Our designs make use of gradients and come with five elements in order to represent the DMAIC methodology (Define, Measure, Analyze, Improve and Control). This...

Download the Science Process Diagrams template for PowerPoint or Google Slides and discover this set of editable infographics for education presentations. These resources, from graphs to tables, can be combined with other presentations or used independently. The most important thing is what you will achieve: transmit information in an orderly...

Does your project require a series of steps or alternating phases? Explain just that with these infographics and guide your audience so that they understand the process and how the goal is reached. You'll find mostly timelines here, with varying numbers of elements, representing each of these phases. The palette...

Download the Process Infographics template for PowerPoint or Google Slides to get the most out of infographics. Whether you want to organize your business budget in a table or schematically analyze your sales over the past year, this set of infographic resources will be of great help. Start using infographics...
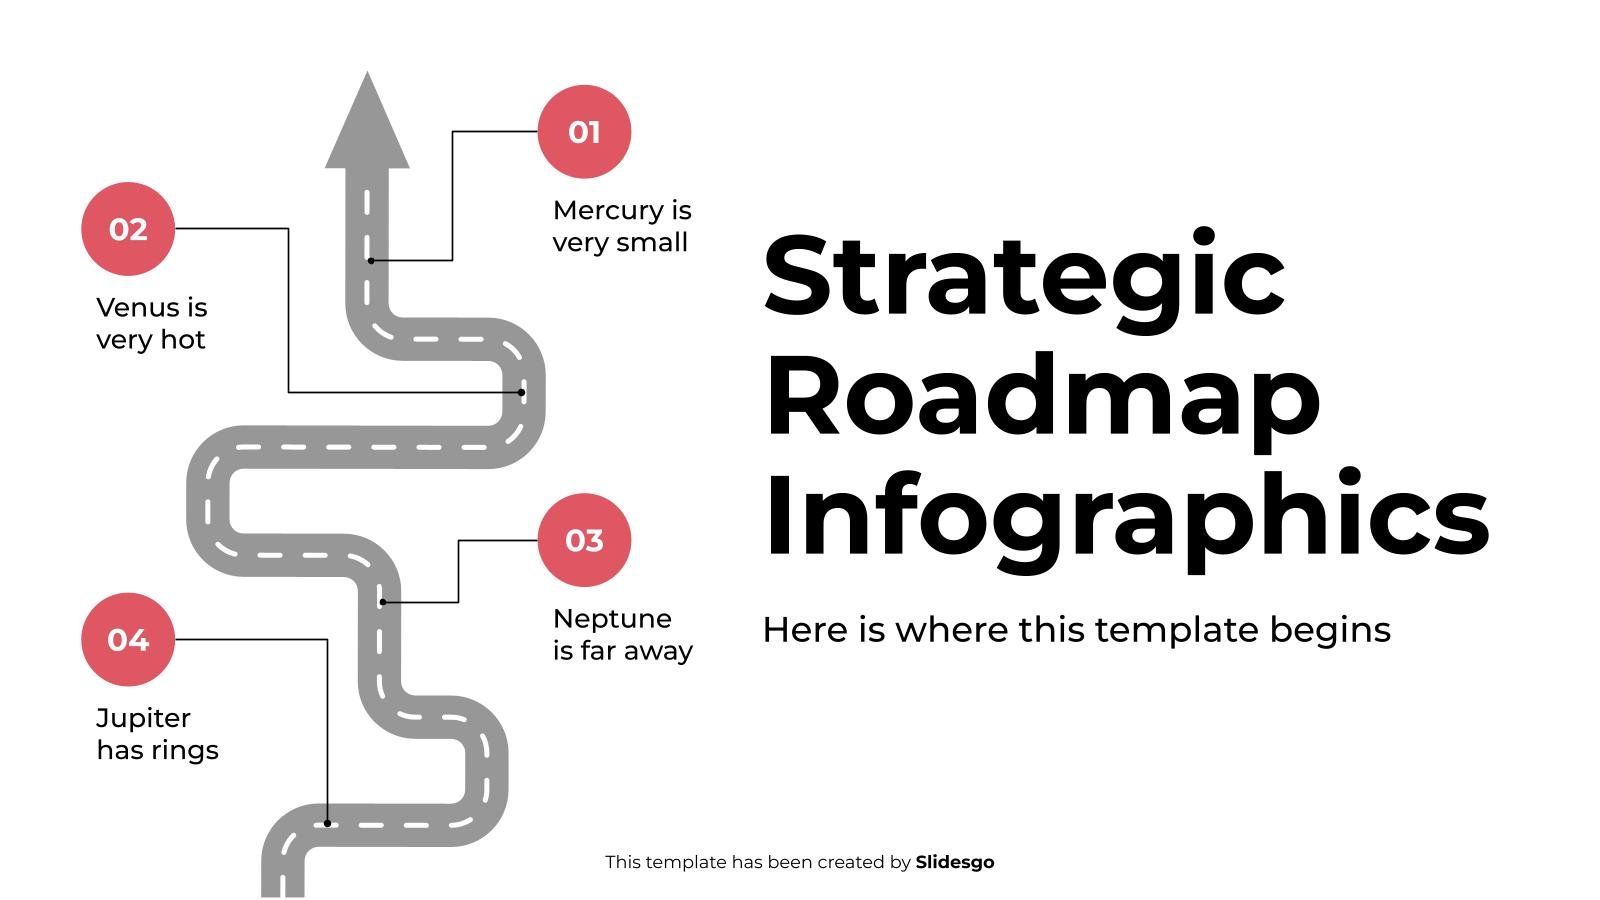
Download the Strategic Roadmap Infographics template for PowerPoint or Google Slides to get the most out of infographics. Whether you want to organize your business budget in a table or schematically analyze your sales over the past year, this set of infographic resources will be of great help. Start using...

We all love a juicy burger with fries and gravy or a 3-chocolate cake with a lot of sugar. And it's fine to enjoy these little pleasures from time to time, but we should be aware of the risks that ultra-processed foods can have on our health, to simply consume...

Download the Process Infographics template for PowerPoint or Google Slides to get the most out of infographics. Whether you want to organize your business budget in a table or schematically analyze your sales over the past year, this set of infographic resources will be of great help. Start using infographics...

Data migration is the process to transfer data from one system to another while changing the storage system where the data is located, or while making the necessary changes to the database or the application that manages it. It sounds like a complex process, but we are sure that your...

This process is simple: first you discover this amazing template with infographics, then, you click on download. Do you know what happens next? Process maps are a great way of illustrating ideas that flow, changing options or different outcomes of a situation. With a set of infographics like this one,...

Download the SCRUM Process Infographics template for PowerPoint or Google Slides to get the most out of infographics. Whether you want to organize your business budget in a table or schematically analyze your sales over the past year, this set of infographic resources will be of great help. Start using...

Do you know how the acronym RAPID is formed? It comes from "recommend", "agree", "perform", "input" and "decide". These words create RAPID, which is a decision-making model for companies. With this model you can organize the decision-making process from start to finish. So, we have designed this set of infographics...

Download the Timeline Infographics template for PowerPoint or Google Slides to get the most out of infographics. Whether you want to organize your business budget in a table or schematically analyze your sales over the past year, this set of infographic resources will be of great help. Start using infographics...
You must follow the directions, specifically the arrows, but upward arrows to success! This template contains 32 infographics, with lots and lots of arrows for all kinds of uses in your presentations. Arrange your data in chronological order or just enjoy the amazing decorative touch of the arrows. Follow the...
Download the "Arrow Infographics" template for PowerPoint or Google Slides and discover the power of infographics. An infographic resource gives you the ability to showcase your content in a more visual way, which will make it easier for your audience to understand your topic. Slidesgo infographics like this set here...

Design thinking is a way of working that sharpens creativity to come up with new ideas to solve user problems. It is inspired by the working methodology of product designers and has five main categories: empathy generation, definition, ideation, prototyping and testing. In this template you will find different types...

Has an idea went through your mind that you want to put into practice? We know you’re eager to show everyone the project that will launch you into an unstoppable success. But you must get ready for it, the speech must be perfect so that the investors are instantly convinced....

Download the Backlog Refinement Meeting presentation for PowerPoint or Google Slides. Gone are the days of dreary, unproductive meetings. Check out this sophisticated solution that offers you an innovative approach to planning and implementing meetings! Detailed yet simplified, this template ensures everyone is on the same page, contributing to a...

Download the Agile Infographics template for PowerPoint or Google Slides to get the most out of infographics. Whether you want to organize your business budget in a table or schematically analyze your sales over the past year, this set of infographic resources will be of great help. Start using infographics...