Infographics Presentation templates - Page 66
Discover our engaging Google Slides and PowerPoint slides full of infographics to present your information or data clearly and quickly!


It seems that you like this template!

Register for free and start downloading now
Download the Project Timeline Infographics template for PowerPoint or Google Slides to get the most out of infographics. Whether you want to organize your business budget in a table or schematically analyze your sales over the past year, this set of infographic resources will be of great help. Start using...

If art is taught at elementary level in your school, we had an awesome template to teach about the concepts of space, value, texture and form. It looked like a notebook, and each page was a slide with the contents of your choice. Surprise! We've created its complementary set of...
Download the "History Subject for High School in Spain: Constitution Day Infographics" template for PowerPoint or Google Slides and discover the power of infographics. An infographic resource gives you the ability to showcase your content in a more visual way, which will make it easier for your audience to understand...
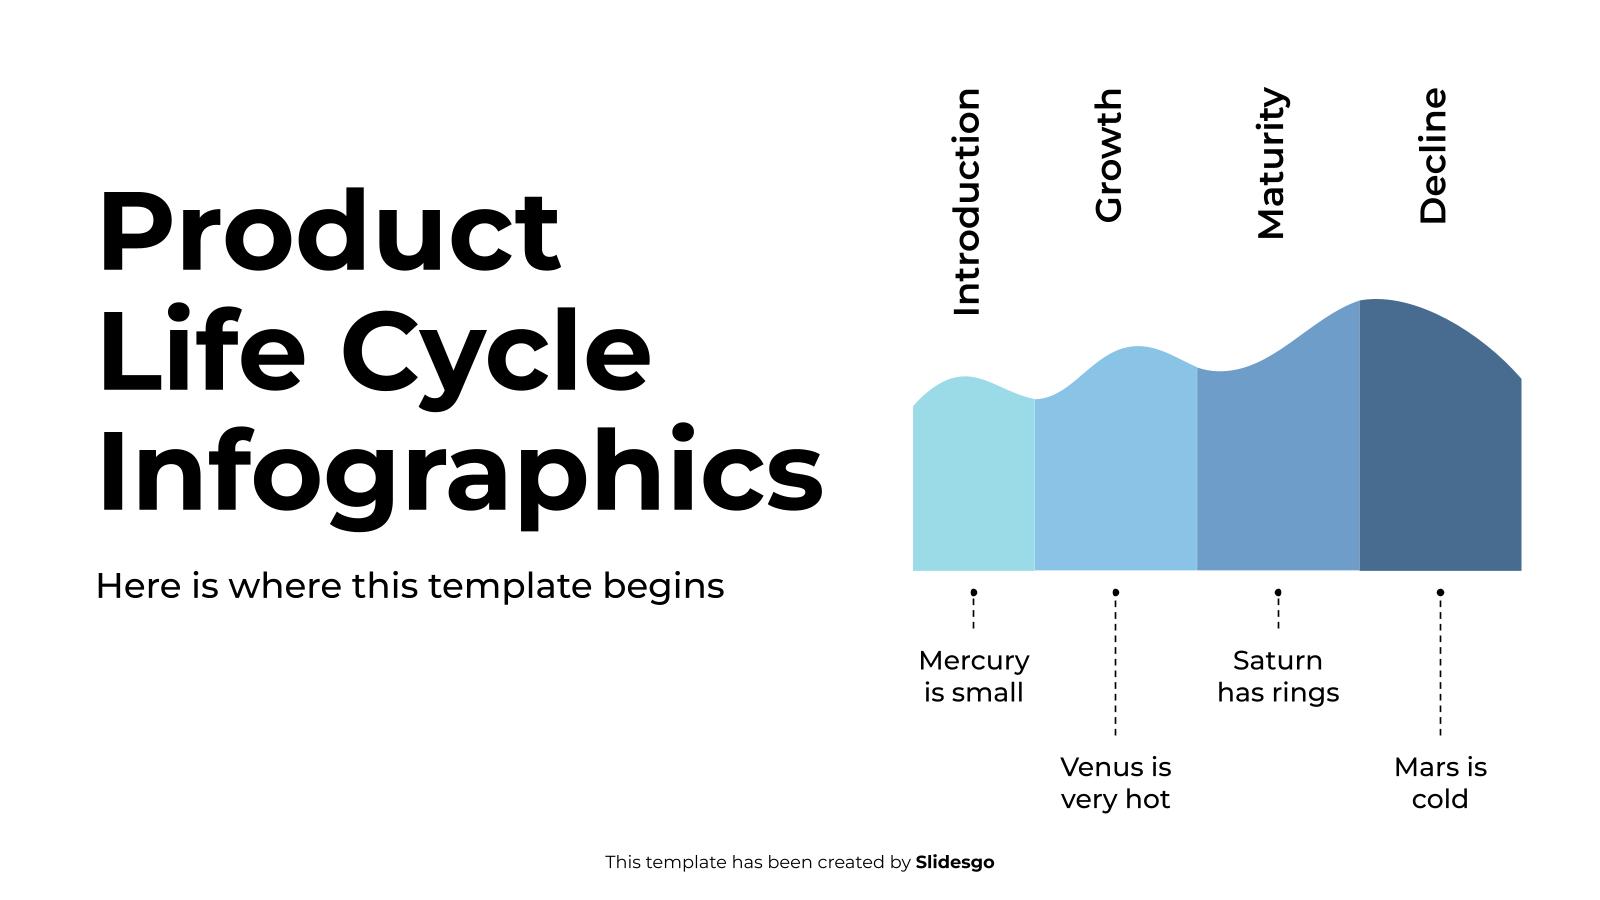
Download the Product Life Cycle Infographics template for PowerPoint or Google Slides to get the most out of infographics. Whether you want to organize your business budget in a table or schematically analyze your sales over the past year, this set of infographic resources will be of great help. Start...

World Milk Day is a celebration of the liquid gold that keeps us healthy and strong! Every year, people all over the world come together to honor the amazing benefits of milk and dairy products. Celebrate this special day by presenting it with a fun presentation for friends and family...

Sometimes a simple design is just the best! Because when it boils down to it, if you need a collection of infographics to get your point across clearly and in a visually appealing way, there’s nothing like simple black on white with bright accents to offset what’s most important. In...

The best way to teach about geography is to have the places visualized in a map. Where is Asia? What about Oceania? We thought that now that you have your lesson prepared, you will need useful infographics to clearly illustrate your points. Here you can find a set of infographics...

Download the Steps to Success Infographics template for PowerPoint or Google Slides to get the most out of infographics. Whether you want to organize your business budget in a table or schematically analyze your sales over the past year, this set of infographic resources will be of great help. Start...
Download the Causes of Global Warming Lesson for Middle School Infographics template for PowerPoint or Google Slides and discover the power of infographics. An infographic resource gives you the ability to showcase your content in a more visual way, which will make it easier for your audience to understand your...

Download the Timeline Infographics template for PowerPoint or Google Slides to get the most out of infographics. Whether you want to organize your business budget in a table or schematically analyze your sales over the past year, this set of infographic resources will be of great help. Start using infographics...

Earth is an ever-evolving field, where international politics play a critical role in shaping the world we live in. It encompasses a wide range of issues that affect countries and citizens around the globe, from trade agreements to human rights to security threats. In short, if you've decided to make...

Download the Comparison Charts Infographics template for PowerPoint or Google Slides to get the most out of infographics. Whether you want to organize your business budget in a table or schematically analyze your sales over the past year, this set of infographic resources will be of great help. Start using...

The nervous system is responsible for transmitting signals between different parts of the body, allowing us to think, feel, and move. Wow! Take your audience on an exciting journey into the science of the nervous system. These editable infographics for Google Slides & PowerPoint can be a great way of...

Download the Two Options Infographics template for PowerPoint or Google Slides to get the most out of infographics. Whether you want to organize your business budget in a table or schematically analyze your sales over the past year, this set of infographic resources will be of great help. Start using...
Download the Vision Board Workshop Infographics template for PowerPoint or Google Slides and discover the power of infographics. An infographic resource gives you the ability to showcase your content in a more visual way, which will make it easier for your audience to understand your topic. Slidesgo infographics like this...

Download the "Virtual Slides for Education Day Infographics" template for PowerPoint or Google Slides and discover the power of infographics. An infographic resource gives you the ability to showcase your content in a more visual way, which will make it easier for your audience to understand your topic. Slidesgo infographics...

To achieve something, you need to follow some steps. For example, to give a successful presentation, you need to do the following: firstly, go to the Slidesgo website; secondly, click on the template that catches your eye, which might as well be this one; thirdly, download the template to have...

Are you conducting research? Perhaps analyzing the target audience? Trying to understand new markets? Maps are the perfect choice when it comes to showing and assessing geographical data. With the help of designs like this one, editable in Google Slides and PowerPoint, you'll find the location of success in no...