Infographics Presentation templates - Page 65
Discover our engaging Google Slides and PowerPoint slides full of infographics to present your information or data clearly and quickly!


It seems that you like this template!

Register for free and start downloading now
Download the Business Infographics template for PowerPoint or Google Slides to get the most out of infographics. Whether you want to organize your business budget in a table or schematically analyze your sales over the past year, this set of infographic resources will be of great help. Start using infographics...

Download the Comparison Charts Infographics template for PowerPoint or Google Slides to get the most out of infographics. Whether you want to organize your business budget in a table or schematically analyze your sales over the past year, this set of infographic resources will be of great help. Start using...

Download the Resume for Everyone Infographics template for PowerPoint or Google Slides and discover the power of infographics. An infographic resource gives you the ability to showcase your content in a more visual way, which will make it easier for your audience to understand your topic. Slidesgo infographics like this...

Electricity? What's that? Petroleum? Why? The world moves via steam machines! If you're a fan of the steampunk genre, you might have already taken a look at our thematic templates. Good news for you today, we've got a template full of infographics with an aesthetic based on the steampunk style,...

Download the Marketing Plan Infographics template for PowerPoint or Google Slides to get the most out of infographics. Whether you want to organize your business budget in a table or schematically analyze your sales over the past year, this set of infographic resources will be of great help. Start using...

Your startup business is ready to see the world! Now it’s time to create the perfect presentation to convince everyone about your business plan. Did you know that infographics have the great ability to display information very clearly in your presentations? Maybe you’re already using the original Cool Startup Business...

Voilà, our new compound, straight from the laboratory! It's composed of two molecules of graphic design, three molecules of attention to detail and one molecule of customizability. These infographics, as you've probably guessed by now, are great for lessons on chemistry, allowing you to show concepts or explain things in...

Is that time of year when stores hurry up and offer big sales in order to kickstart the Christmas shopping season? We're talking about Black Friday! Not yet? Then you still have time to download our "Black Friday Creative Campaign" template to prepare for the occasion. But that's not all,...

Download the Sustainability Infographics template for PowerPoint or Google Slides to get the most out of infographics. Whether you want to organize your business budget in a table or schematically analyze your sales over the past year, this set of infographic resources will be of great help. Start using infographics...

Download the Business Model Infographics template for PowerPoint or Google Slides to get the most out of infographics. Whether you want to organize your business budget in a table or schematically analyze your sales over the past year, this set of infographic resources will be of great help. Start using...
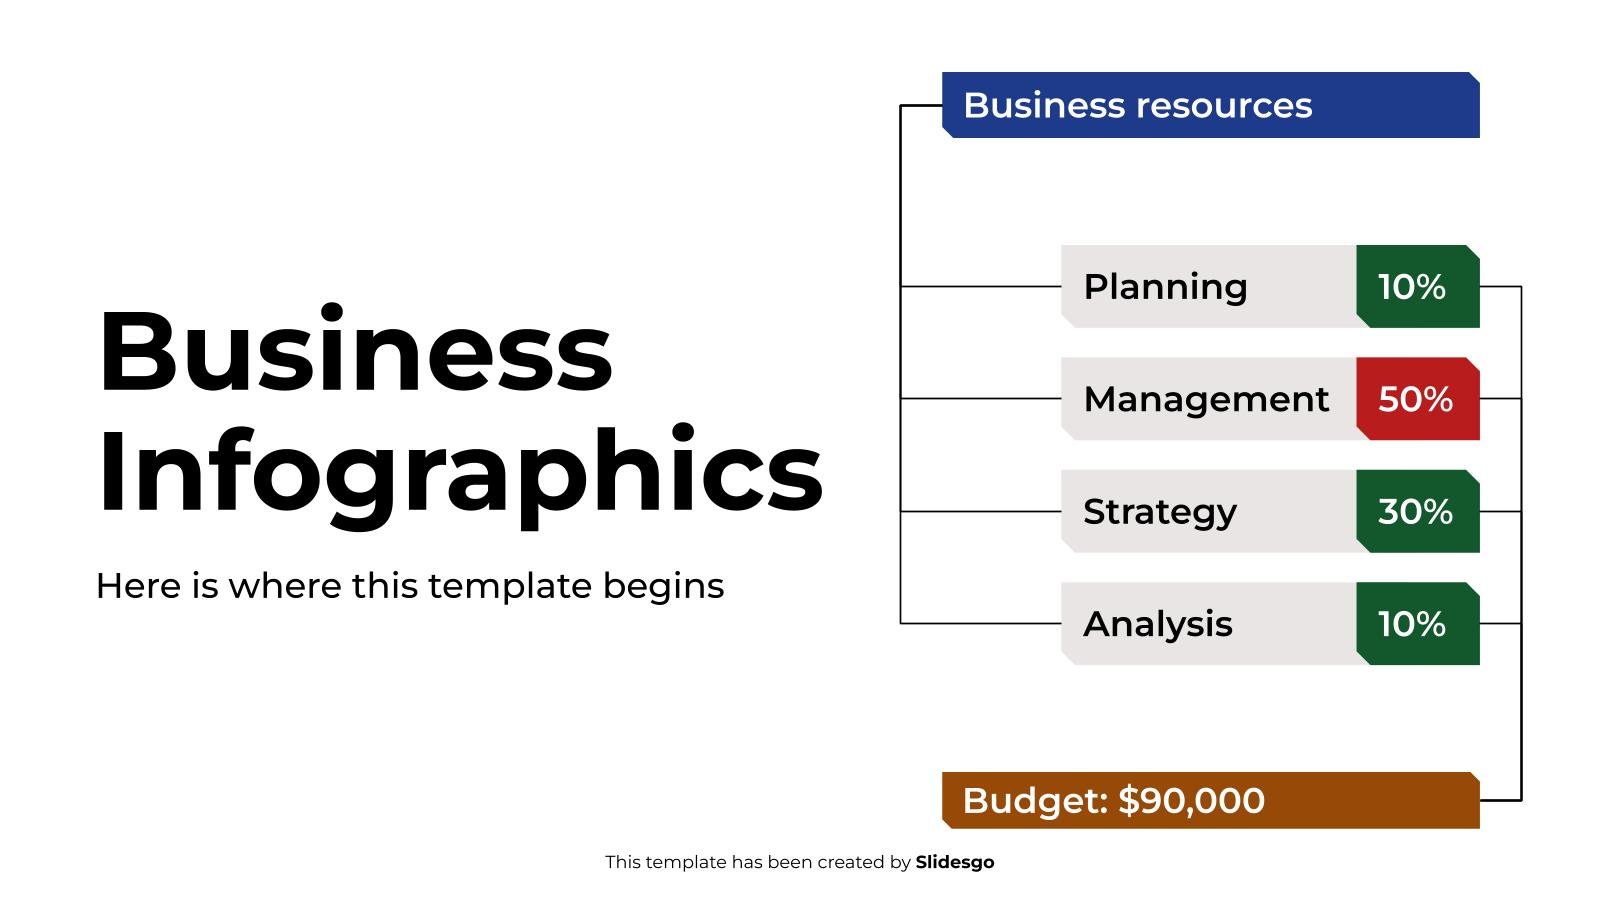
Download the Business Infographics template for PowerPoint or Google Slides to get the most out of infographics. Whether you want to organize your business budget in a table or schematically analyze your sales over the past year, this set of infographic resources will be of great help. Start using infographics...

Enjoying electricity and natural gas? For the most part, supplying those is the job of energy companies. In the past, you had a successful meeting—it couldn't have been otherwise because you used our template called "Energy Company Meeting". Remember that design, more focused on ecological messages? Now we have some...

We propose you a challenge: to get the code out of our website. Well, better not, you're a real hacker! Joking aside, we have something for you. If you teach programming workshops and use our designs, this set of infographics can help you organize your data. You'll find graphs, tables...

After having explored the limits of the galaxy with the "Space Exploration Mission Pitch Deck" presentation, it's time to continue traveling on this space journey — now with a set of infographics complementary to the template! Put on your space suit and get ready to visit all the planets (resources)...

During the period between 1820 and 1850 in United States history, rapid changes took place as the nation moved away from its agrarian roots and embraced the Industrial Revolution. Culturally speaking, literature began to move beyond merely reciting tales into exploring themes of identity and morality. It was a time...

Download the Strategic Product Roadmap Infographics template for PowerPoint or Google Slides and discover the power of infographics. An infographic resource gives you the ability to showcase your content in a more visual way, which will make it easier for your audience to understand your topic. Slidesgo infographics like this...

This new set of editable infographics is especially useful for medical students. Why? They've been designed so that you can teach about different illnesses and data related to them, with the aim to train health professionals. In a hand-drawn style, each slide is like the interface of a computer (there's...

Remember one of our templates that was very useful for talking about healthcare centers in a calm and approachable way? Guess what: we've created a set of infographics that go perfectly with it! That means a lot of different graphs and diagrams with many medical-themed icons. Some of the decorative...