Infographics Presentation templates - Page 44
Discover our engaging Google Slides and PowerPoint slides full of infographics to present your information or data clearly and quickly!


It seems that you like this template!

Register for free and start downloading now
With all the information available in the field of medicine and huge amounts of work, perhaps you need a little help when it comes to keeping things organized. This set of infographics is to be used as extra resources for planners, which means you'll find calendars, notes, timetables, and more....

Download the Infographics For Students template for PowerPoint or Google Slides and discover the power of infographics. An infographic resource gives you the ability to showcase your content in a more visual way, which will make it easier for your audience to understand your topic. Slidesgo infographics like this set...

It's so cool to see your own pet respond to your own commands. "Roll over, gimme the paw, bark!", what a wonderful sight! Our newest set of infographics contains icons and illustrations revolving around pets and their owners. These elements are a part of the different designs that we offer...

Download the Golfer's Day Infographics template for PowerPoint or Google Slides and discover the power of infographics. An infographic resource gives you the ability to showcase your content in a more visual way, which will make it easier for your audience to understand your topic. Slidesgo infographics like this set...

Download the Cause And Effect Infographics template for PowerPoint or Google Slides and discover the power of infographics. An infographic resource gives you the ability to showcase your content in a more visual way, which will make it easier for your audience to understand your topic. Slidesgo infographics like this...

Do you know the most powerful businesswomen in the world? A great idea to talk about them would be to make a Google Slides and PowerPoint presentation, and an even better idea would be to use this series of infographics that we have designed at Slidesgo to complement presentations on...

In education there are lots of different methodologies, and most likely you haven't heard of some of them. For example, what is flipped classroom? If your next presentation is about this topic, add these customizable infographics, graphs, tables and diagrams to your slides and complete your data with these visual...

Brainstorming is a technique in which you and your team try to come up with new ideas to solve a problem and it’s a great way of fostering creativity and teamwork. With this set of infographics, you can represent visually the ideas that your team comes up with and organize...

Download the Finance Infographics template for PowerPoint or Google Slides and discover the power of infographics. An infographic resource gives you the ability to showcase your content in a more visual way, which will make it easier for your audience to understand your topic. Slidesgo infographics like this set here...

It is said that you should compare with yourself only, but in the business world, since competition is so fierce, taking a look at the best practices from other companies makes sense. That's called "benchmarking", and with this template you can add some infographics on this topic to your presentation....

The brand of a company goes beyond a simple name. The brand is the sign of identity, what makes you special and differentiates you from other companies. Branding is the marketing technique that builds this brand, defines it and establishes all the necessary planning for the marketing of the company's...

The pen has been such an important invention that, for example, in Argentina, ballpoint pens are called "birome", which comes from a trademark that combines the names of its inventor and its commercial partner. The infographics included in this template have been created in a doodle style, as if everything...

Download the American Football Infographics template for PowerPoint or Google Slides and discover the power of infographics. An infographic resource gives you the ability to showcase your content in a more visual way, which will make it easier for your audience to understand your topic. Slidesgo infographics like this set...
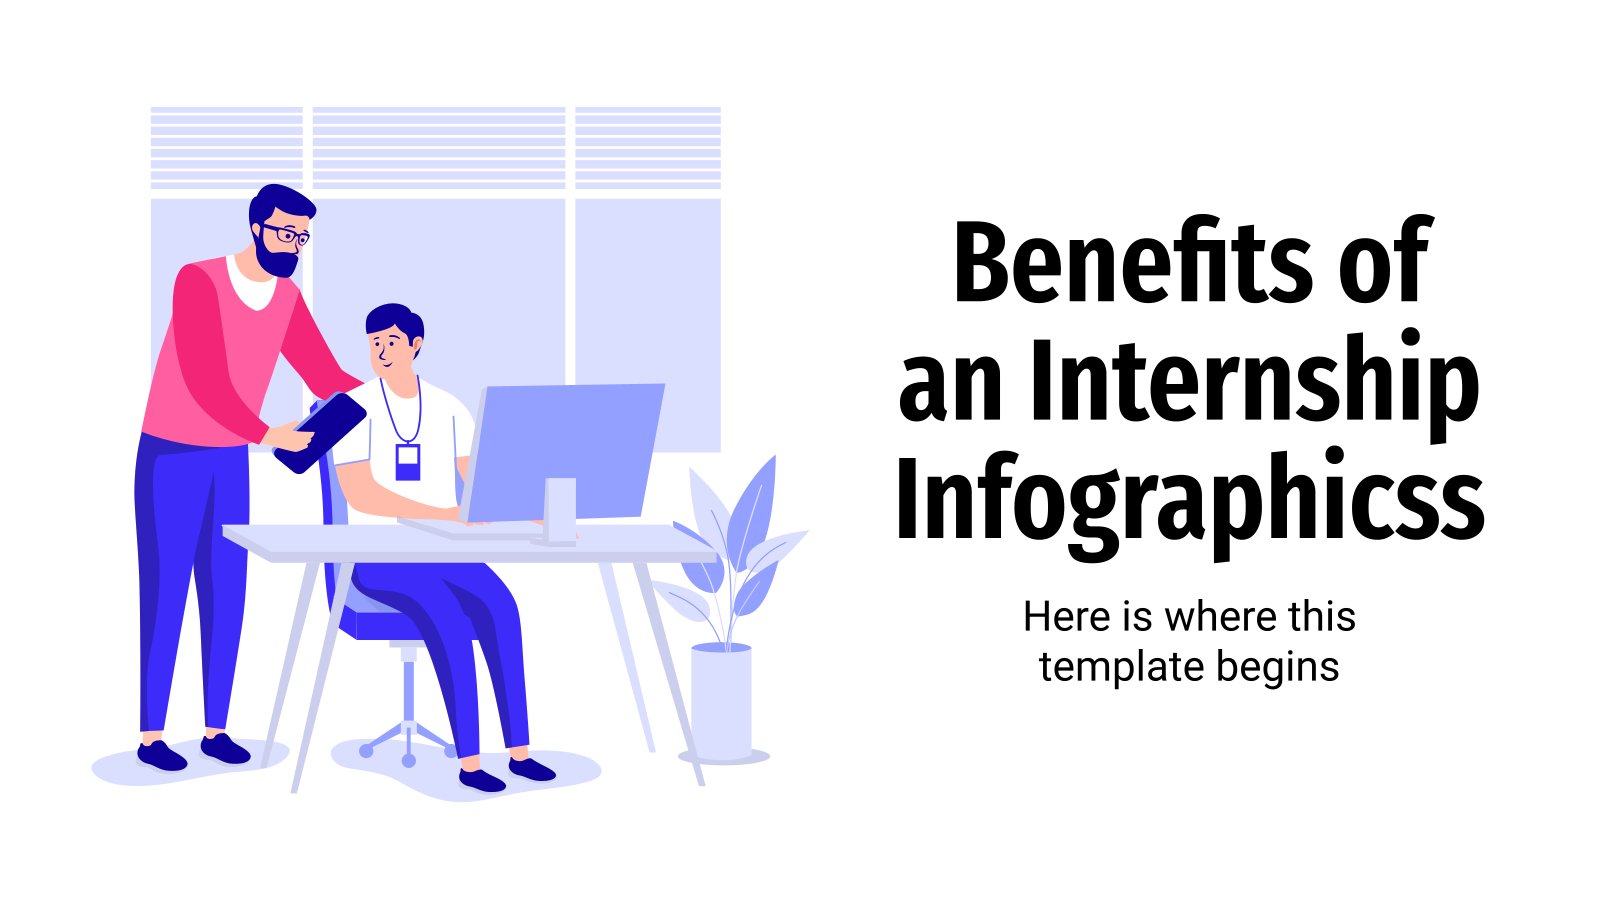
Some last-year college students or graduates opt for an internship program so that they can gain experience and work in a real environment prior to starting their careers. What are the benefits of such programs? You can tell us with these editable infographics! The variety of designs is big, and...
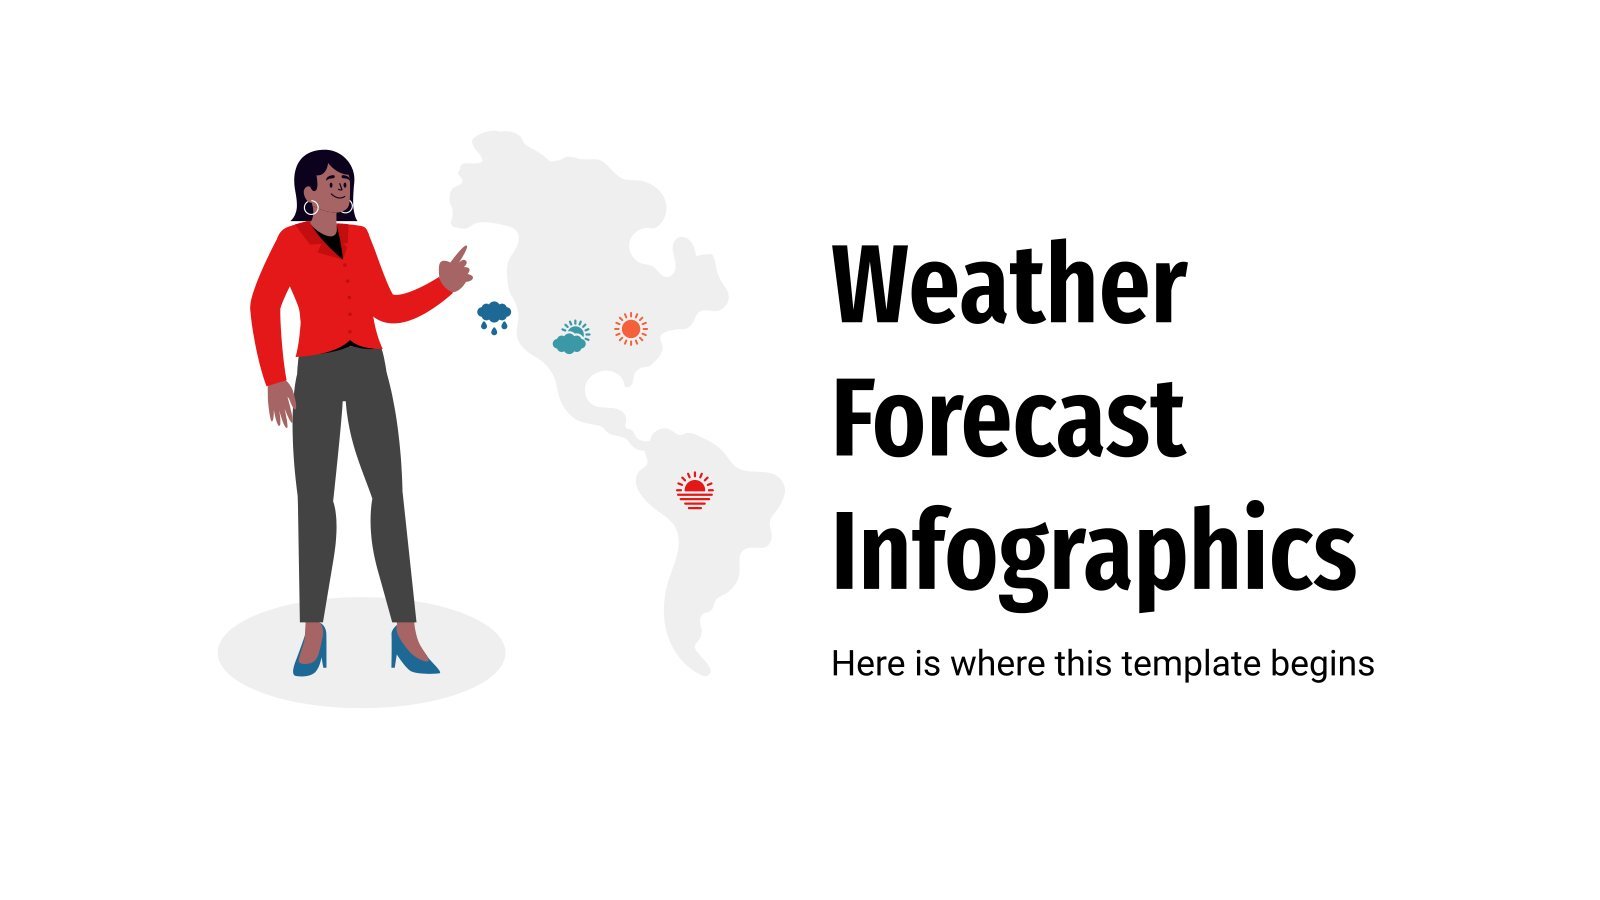
"The weather will be sunny in the south coast, with temperatures up to 30 degrees". The forecast seems good, with 0% chance of rain and 100% of success with your presentations! How come? We've released a new set of infographics that contains a lot designs related to the weather forecast....

Download the Law Infographics template for PowerPoint or Google Slides and discover the power of infographics. An infographic resource gives you the ability to showcase your content in a more visual way, which will make it easier for your audience to understand your topic. Slidesgo infographics like this set here...

Do you know what leptospirosis is? This disease caused by a bacteria can show through different symptoms: headaches, muscle pain, fever, shivering, meningitis… The bacteria that causes it can be found in rivers, ponds and soil, so it is often transmitted by swimming or being in contact with infected animals....

Medical advances on pregnancy just keep growing! Although we know a lot about obstetrics nowadays, there is always a lot to discover, and there is nothing clearer than an infographic to illustrate medical concepts! If you found our Pregnancy Breakthrough template useful, these infographics that complement that presentation will make...