Infographics Presentation templates - Page 40
Discover our engaging Google Slides and PowerPoint slides full of infographics to present your information or data clearly and quickly!

It seems that you like this template!
Register for free and start downloading now
When in class, you must follow some rules to make sure your teachers can carry on with their lessons properly and you learn in the best environment. Ask for permission if you want to go to the toilet, don't talk when your teacher is talking, don't eat in class, always...
If you're feeling a bit dehydrated, don't worry! These infographics are going to help you! Staying hydrated is an essential part of leading an active and healthy life — yet it's something so many of us overlook. By the time we feel thirsty, our body has already lost water and...
Download the "AI Tech Company Infographics" template for PowerPoint or Google Slides to get the most out of infographics. Whether you want to organize your business budget in a table or schematically analyze your sales over the past year, this set of infographic resources will be of great help. Start...
Slidesgo's weather broadcast begins! This typical winter Tuesday we will have a great variety of charts to use in presentations about the weather in the north of the country, while in the south, due to winter precipitations, it will rain large amounts of graphs to express data such as temperature...
Every year, the film industry produces lots of blockbusters that generate immense revenue. But that means there's a lot of marketing behind, since otherwise how can people know what movies are being premiered? Shed some light on this topic by giving an interesting speech! If you're going to use a...
Download the "Architect Infographics" template for PowerPoint or Google Slides and discover the power of infographics. An infographic resource gives you the ability to showcase your content in a more visual way, which will make it easier for your audience to understand your topic. Slidesgo infographics like this set here...
Are you familiar with persuasive advertising techniques? If you work in the marketing world, techniques such as bandwagon or snob appeals, will be concepts that are part of your vocabulary as a marketer. And to add you to organize persuasion techniques in advertising, we have designed this set of infographics...
Download the Old Buddies The Meeting Infographics template for PowerPoint or Google Slides and discover the power of infographics. An infographic resource gives you the ability to showcase your content in a more visual way, which will make it easier for your audience to understand your topic. Slidesgo infographics like...
Download the "3D Infographics" template for PowerPoint or Google Slides and discover the power of infographics. An infographic resource gives you the ability to showcase your content in a more visual way, which will make it easier for your audience to understand your topic. Slidesgo infographics like this set here...
Download the "Animal Infographics" template for PowerPoint or Google Slides and discover the power of infographics. An infographic resource gives you the ability to showcase your content in a more visual way, which will make it easier for your audience to understand your topic. Slidesgo infographics like this set here...
We’ve come up with the perfect way to depict a comparison between items: scales! All our infographics revolve around the idea of balance. We’ve added a lot of flat designs, but there are also a couple of unique choices, such as doodle and isometric, just to have more variety.
These new infographics allow you to make your own avatar by dragging "cut-out" pieces to a character. We wanted to be original with our designs and we've included thirty different ones, each with its own set of accessories, hairstyles and other elements. This funny template is offered in flat, semi-flat...
Download the "Art Infographics" template for PowerPoint or Google Slides and discover the power of infographics. An infographic resource gives you the ability to showcase your content in a more visual way, which will make it easier for your audience to understand your topic. Slidesgo infographics like this set here...
Would you be able to name all the colors of the rainbow? We have this set of infographics, completely editable and fitting for presentations where you want to talk about this meteorogical phenomenon. The illustrations included are quite cute and friendly, so you can use the contents for kids too....
Download the "How To Create An Infographic" template for PowerPoint or Google Slides and discover the power of infographics. An infographic resource gives you the ability to showcase your content in a more visual way, which will make it easier for your audience to understand your topic. Slidesgo infographics like...
Download the "By The Numbers Infographics" template for PowerPoint or Google Slides and discover the power of infographics. An infographic resource gives you the ability to showcase your content in a more visual way, which will make it easier for your audience to understand your topic. Slidesgo infographics like this...
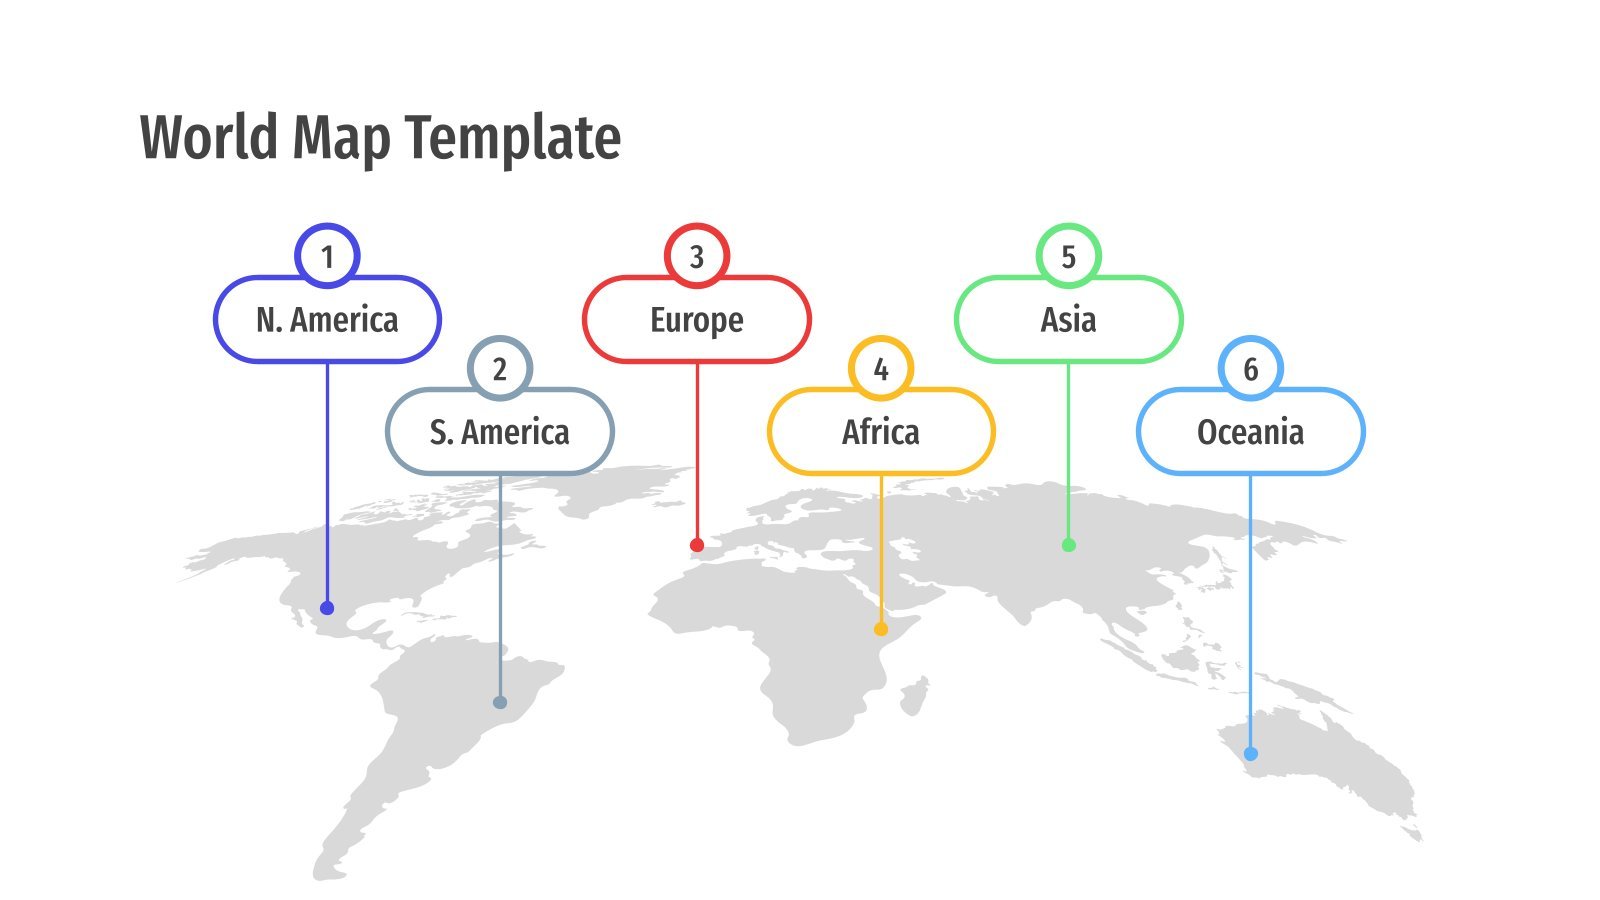
Infographic maps are very useful: if you want to present demographic data, information about the incidence of a disease or talk about the different teaching methodologies in the World, these infographics are for you. Have a look and download them now!
If you love music and, more specifically, the piano, take a look at this infographic template. It is entirely inspired by the keys of this musical instrument, so it is ideal for teaching piano playing, although it can also be adapted to other themes. It has different types of layouts,...


