Infographics Presentation templates - Page 11
Discover our engaging Google Slides and PowerPoint slides full of infographics to present your information or data clearly and quickly!


It seems that you like this template!

Register for free and start downloading now
How important it is in marketing or in the world of business in general to devise and follow a good strategy to boost sales or revenue. With these infographics, you can talk about yours. We’ve got many resources and designs for you: steps, blocks, tables, comparatives… Let the team know!

Download the "Cycle Diagrams Theme for a Pitch Deck" presentation for PowerPoint or Google Slides. Whether you're an entrepreneur looking for funding or a sales professional trying to close a deal, a great pitch deck can be the difference-maker that sets you apart from the competition. Let your talent shine...

Download the Gardening in the Greenhouse for Kids Infographics template for PowerPoint or Google Slides and discover the power of infographics. An infographic resource gives you the ability to showcase your content in a more visual way, which will make it easier for your audience to understand your topic. Slidesgo...

Don’t be scared if you open this pack of infographics and you don’t understand anything: it’s because they’re in German! We have made them completely editable so that you can adapt them to your preferred language, so don’t worry. These infographics about mind maps will let you present trains of...

As a design agency, you already know about the importance of visual content! In Slidesgo we are aware of the power of visual information, that’s why we have published this set of infographics dedicated to the world of Design. In this set you will find 31 different infographics that will...

For a product to work 100%, you must understand 100% of the customer's needs. And not only their needs, but also their opinions, understanding who the customer is, identifying their motivations and doubts or looking for the “touchpoints” between the product and the customer. All this study and process is...

Download the "Cool and Slick Infographics" template for PowerPoint or Google Slides and discover the power of infographics. An infographic resource gives you the ability to showcase your content in a more visual way, which will make it easier for your audience to understand your topic. Slidesgo infographics like this...
Download the "Icons Infographics" template for PowerPoint or Google Slides and discover the power of infographics. An infographic resource gives you the ability to showcase your content in a more visual way, which will make it easier for your audience to understand your topic. Slidesgo infographics like this set here...

Download the Investors Social Media Infographics template for PowerPoint or Google Slides and discover the power of infographics. An infographic resource gives you the ability to showcase your content in a more visual way, which will make it easier for your audience to understand your topic. Slidesgo infographics like this...
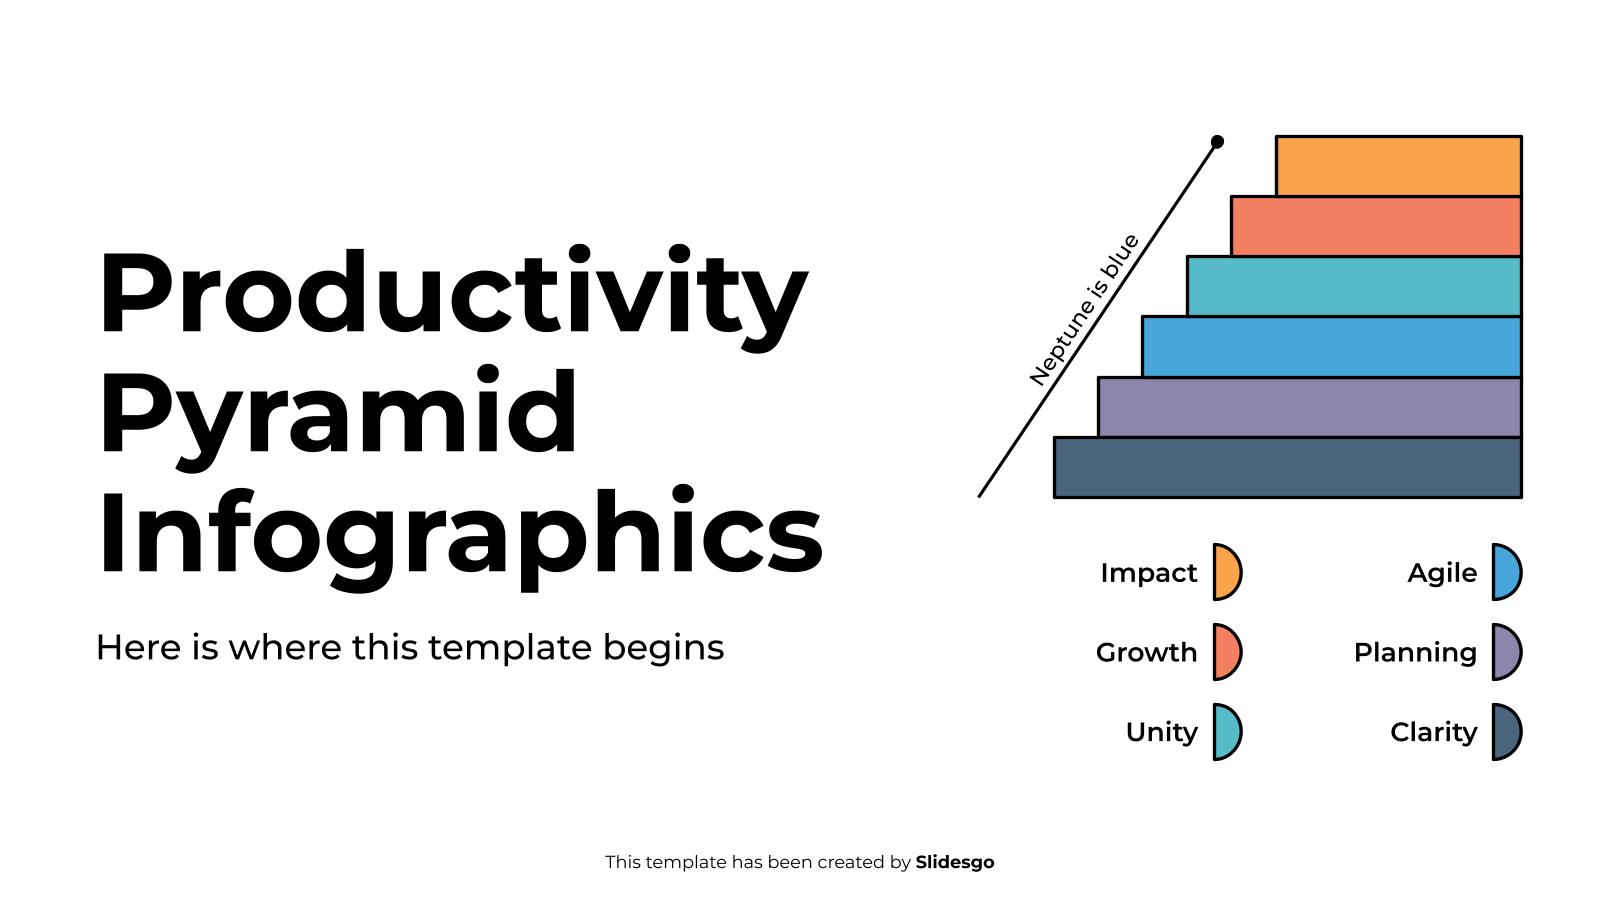
Download the Productivity Pyramid Infographics template for PowerPoint or Google Slides to get the most out of infographics. Whether you want to organize your business budget in a table or schematically analyze your sales over the past year, this set of infographic resources will be of great help. Start using...
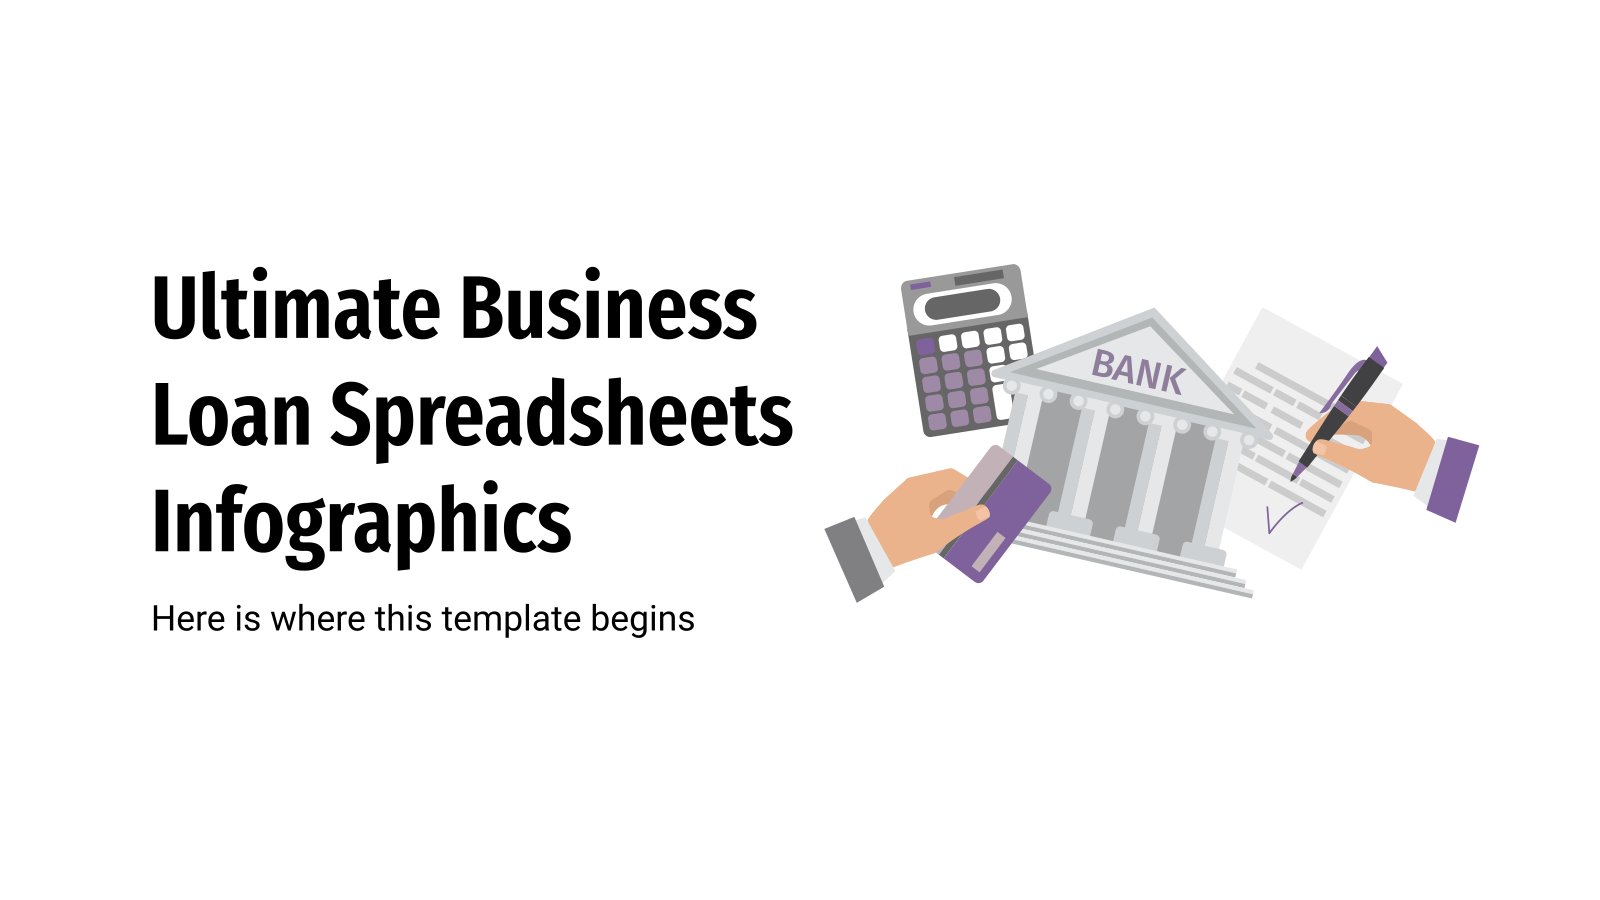
For those who never remember how much they owe the bank after "borrowing $200 for a hotel" when playing Monopoly (not allowed as per the official rules, but hey), here's the solution. Infographics in the form of spreadsheets and tables. All of them related to loans and payments. Some of...

What has 2021 left us? Did the economy go up or did it worsen? Did global warming affect temperatures in your country? These infographics are absolutely multi-purpose, as their variety is suitable for a lot of different topics. Are you looking for circular graphs? Or timelines? Maybe a map of...

We know that planning the strategy for the spring sales of your self-care products is not an easy task, that's why we wanted to give you a hand by creating this complete and elegant template that contains over 30 different infographics that you can customize with your figures, information and...

Download the Buyer Journey Infographics template for PowerPoint or Google Slides to get the most out of infographics. Whether you want to organize your business budget in a table or schematically analyze your sales over the past year, this set of infographic resources will be of great help. Start using...

Download the Pricing Table Infographics template for PowerPoint or Google Slides to get the most out of infographics. Whether you want to organize your business budget in a table or schematically analyze your sales over the past year, this set of infographic resources will be of great help. Start using...
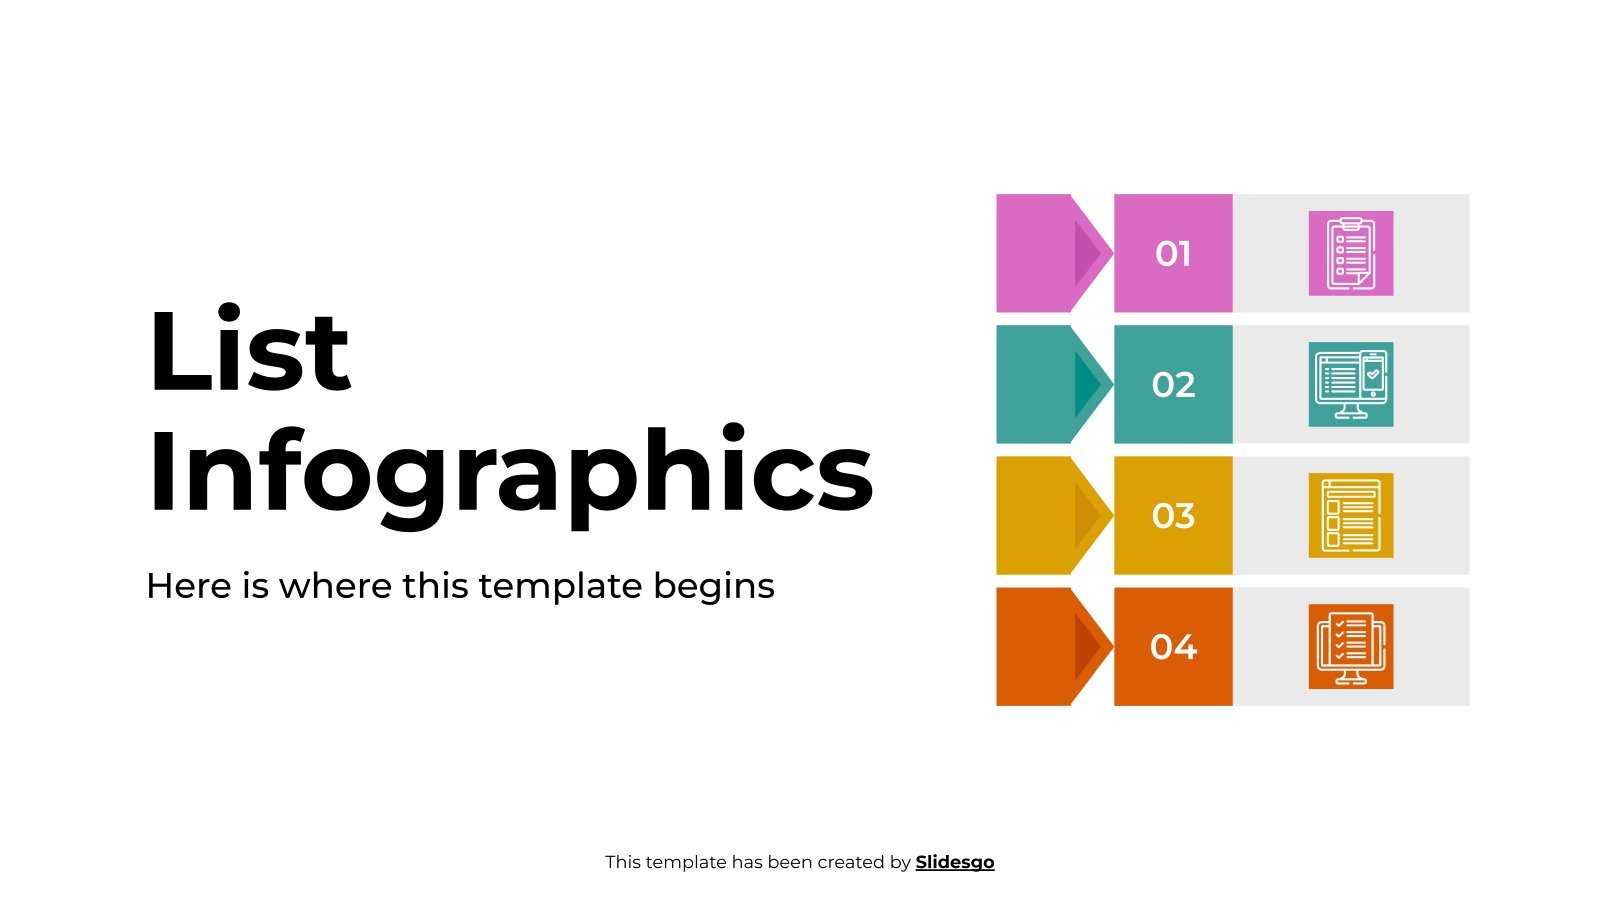
Download the "List Infographics" template for PowerPoint or Google Slides and discover the power of infographics. An infographic resource gives you the ability to showcase your content in a more visual way, which will make it easier for your audience to understand your topic. Slidesgo infographics like this set here...

Looking for a fancy way to show how a project is performing? Our dashboard infographics convey so much information at a glance they could be used independently too! The visuals are very powerful due to the gradients and the wide array of different charts, graphs and other resources for tracking...

Download the Agile Infographics template for PowerPoint or Google Slides to get the most out of infographics. Whether you want to organize your business budget in a table or schematically analyze your sales over the past year, this set of infographic resources will be of great help. Start using infographics...