Infographics Presentation templates - Page 12
Discover our engaging Google Slides and PowerPoint slides full of infographics to present your information or data clearly and quickly!


It seems that you like this template!

Register for free and start downloading now
If you need to present your data in a visual way and to compare different items, banner infographics are simply perfect for you. They include steps, processes, blocks, tables, price tables or comparisons, so they are multi-purpose. There are four sections per slide.

Download the "Agriculture Infographics" template for PowerPoint or Google Slides and discover the power of infographics. An infographic resource gives you the ability to showcase your content in a more visual way, which will make it easier for your audience to understand your topic. Slidesgo infographics like this set here...
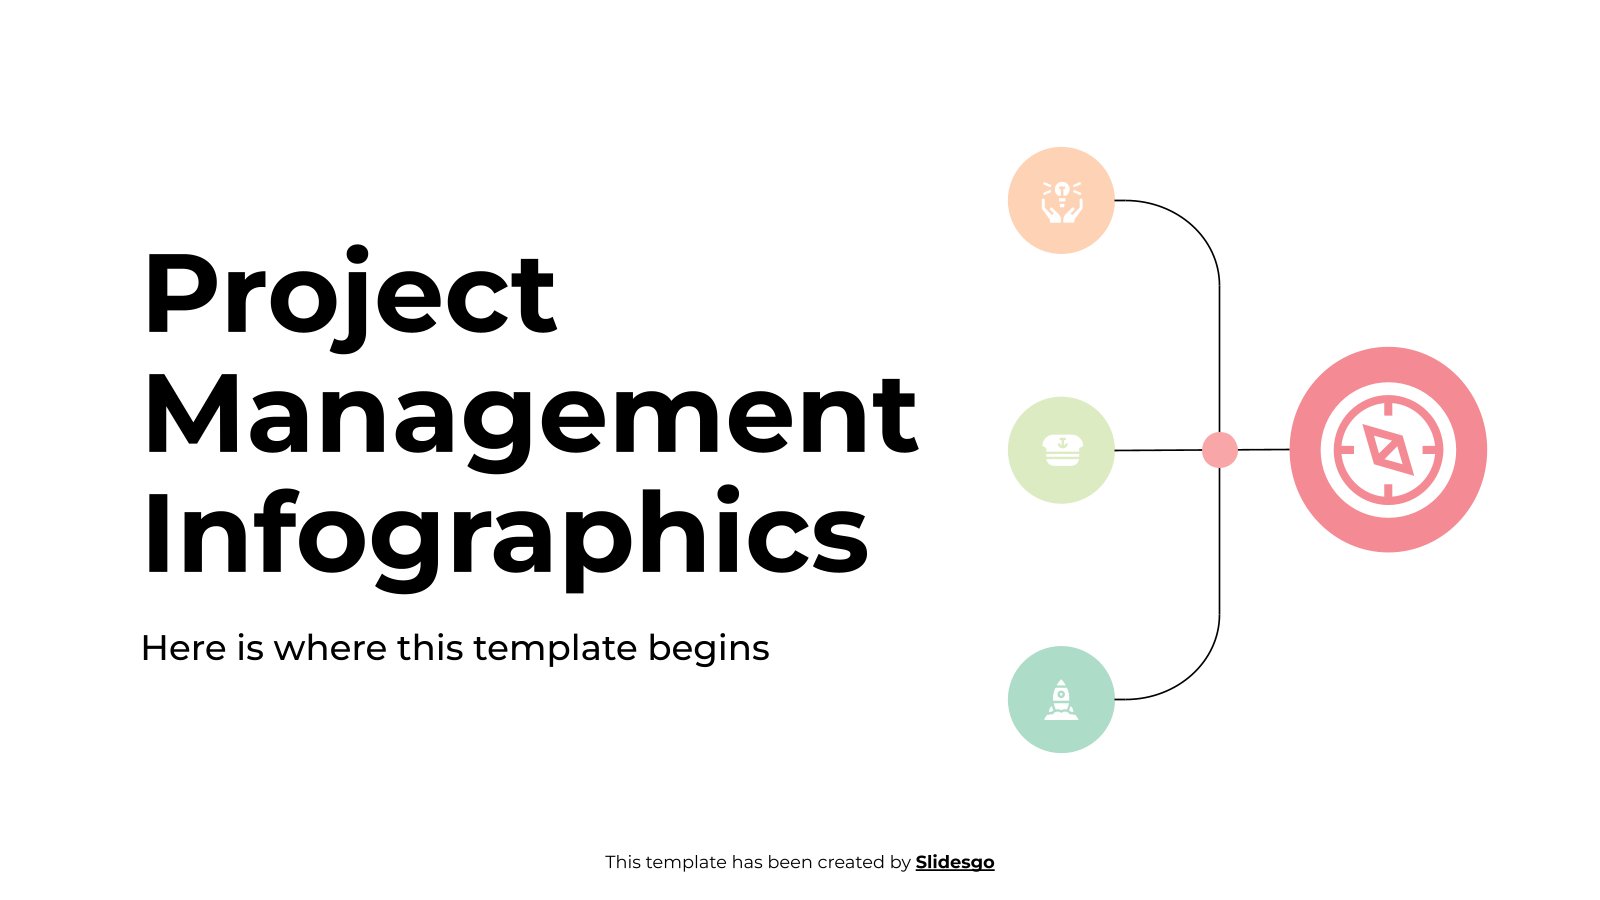
Download the "Project Management Infographics" template for PowerPoint or Google Slides to get the most out of infographics. Whether you want to organize your business budget in a table or schematically analyze your sales over the past year, this set of infographic resources will be of great help. Start using...

With flowcharts you can represent a process and all the decision-making involved. These ones are designed using the doodle graphic style, giving your slideshow a more casual touch. All the colors, arrows and shapes included are editable, so adapt it to your own needs and start visualizing the results!
Download the "Arrow Infographics" template for PowerPoint or Google Slides and discover the power of infographics. An infographic resource gives you the ability to showcase your content in a more visual way, which will make it easier for your audience to understand your topic. Slidesgo infographics like this set here...

How many populated continents are there in the world? Six! That is the exact number of elements you will find in these infographics. Not five, not seven. Use the different timelines and diagrams to display a process consisting of exactly six steps, or compare six pieces of data, or detail...
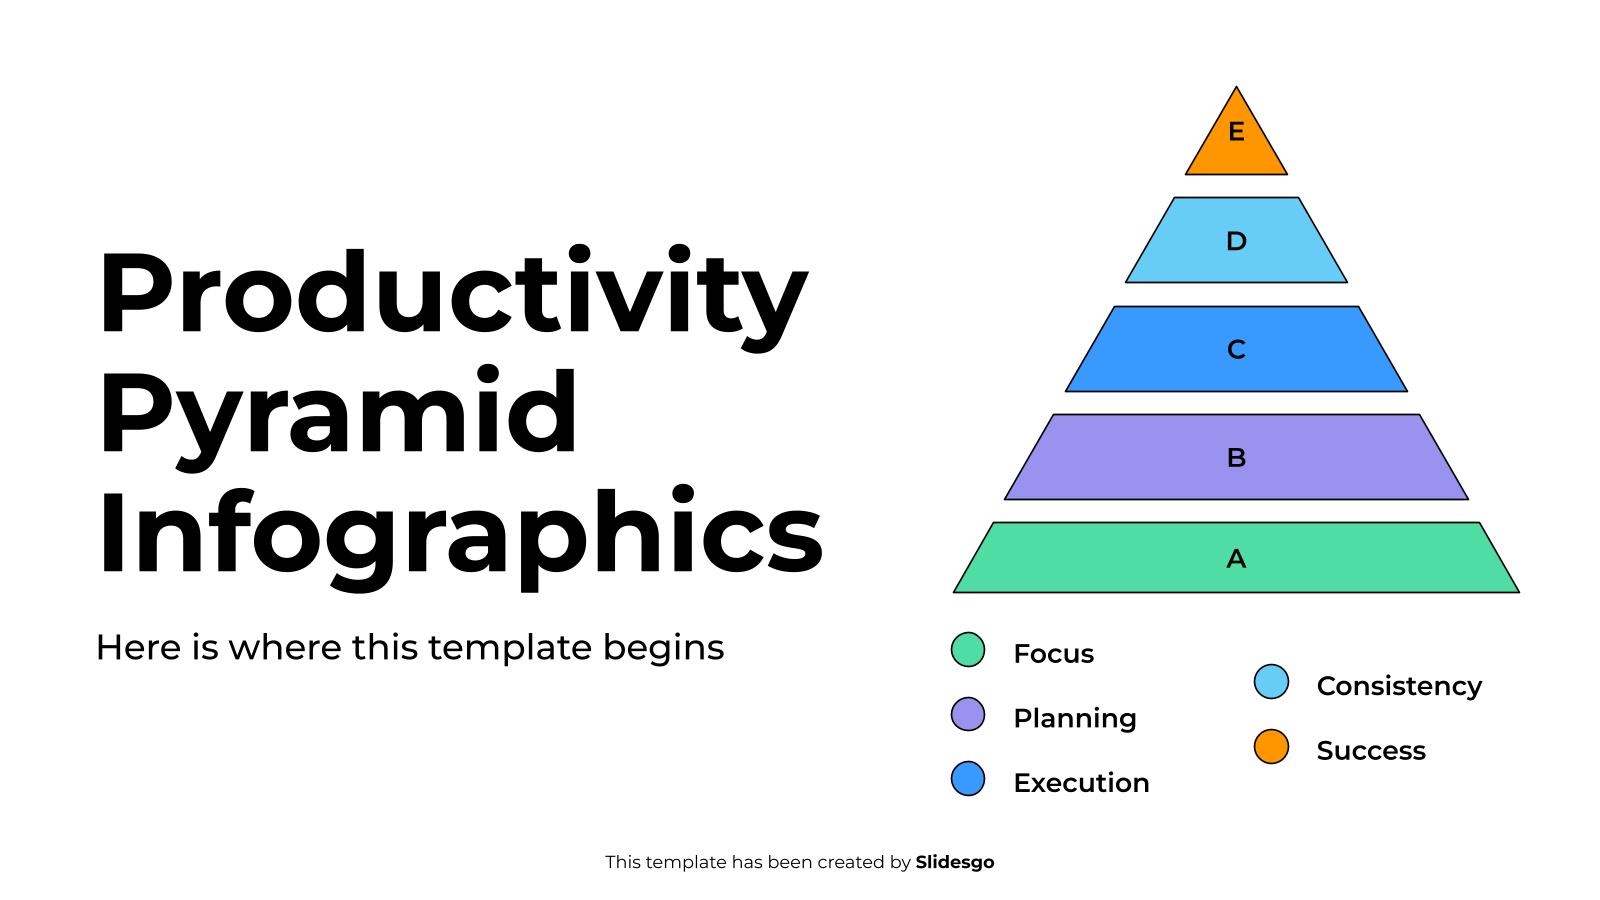
Download the Productivity Pyramid Infographics template for PowerPoint or Google Slides to get the most out of infographics. Whether you want to organize your business budget in a table or schematically analyze your sales over the past year, this set of infographic resources will be of great help. Start using...
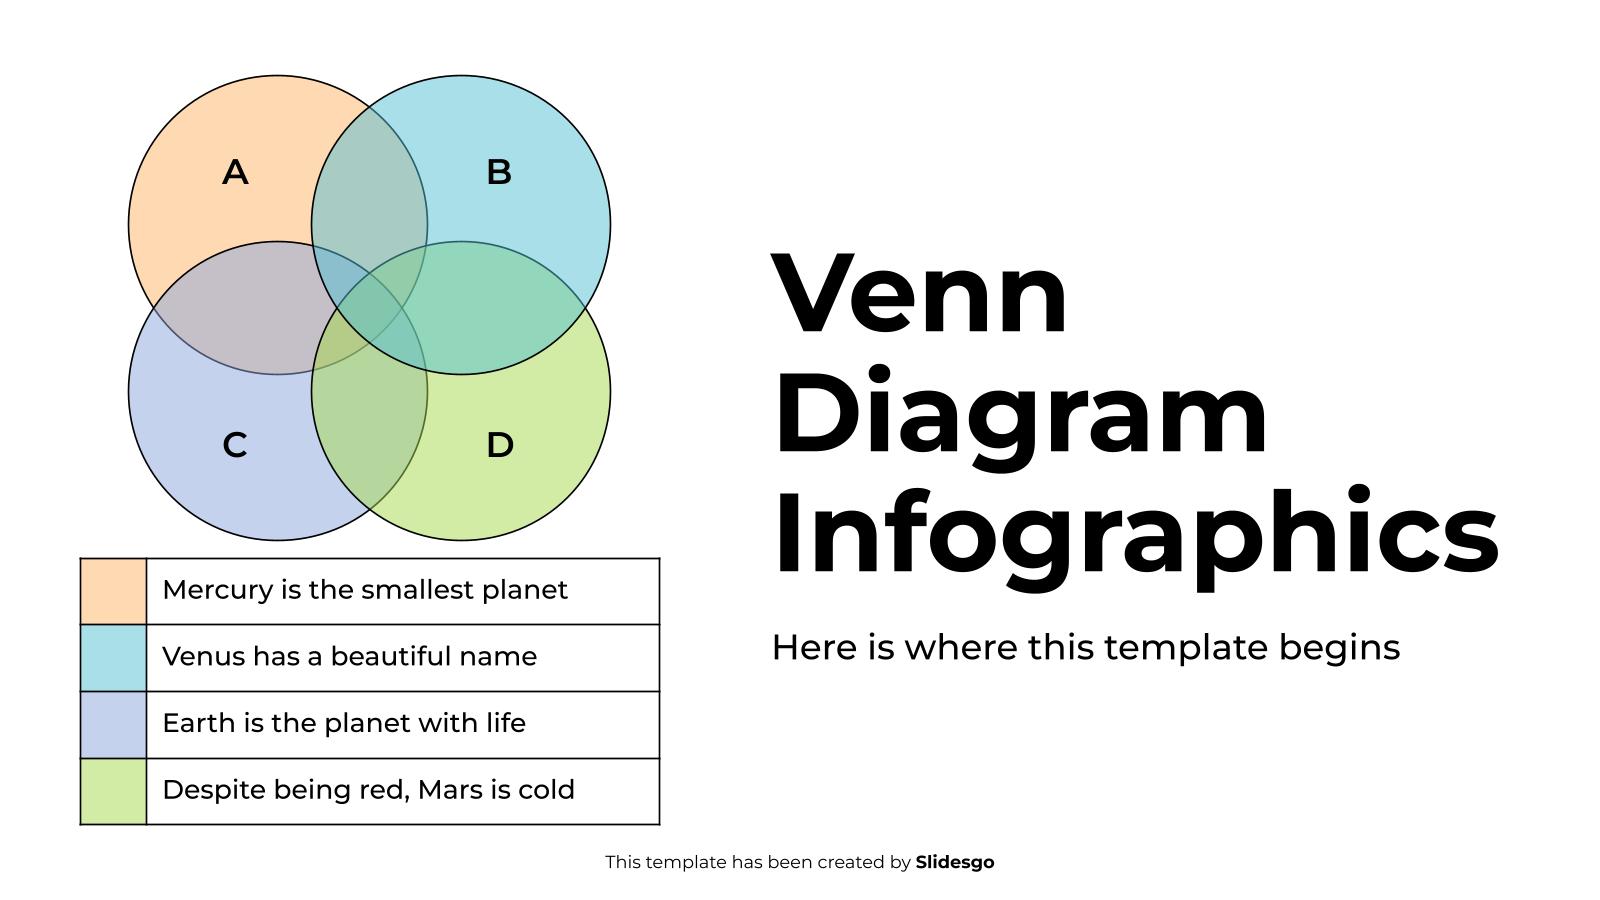
Download the Venn Diagram Infographics template for PowerPoint or Google Slides to get the most out of infographics. Whether you want to organize your business budget in a table or schematically analyze your sales over the past year, this set of infographic resources will be of great help. Start using...

Download the "AI Tech Infographics" template for PowerPoint or Google Slides to get the most out of infographics. Whether you want to organize your business budget in a table or schematically analyze your sales over the past year, this set of infographic resources will be of great help. Start using...
You must follow the directions, specifically the arrows, but upward arrows to success! This template contains 32 infographics, with lots and lots of arrows for all kinds of uses in your presentations. Arrange your data in chronological order or just enjoy the amazing decorative touch of the arrows. Follow the...

Download the "Business Plan Infographics" template for PowerPoint or Google Slides to get the most out of infographics. Whether you want to organize your business budget in a table or schematically analyze your sales over the past year, this set of infographic resources will be of great help. Start using...

Today we're expanding our catalog of infographics with this new addition: strategy maps! Lay out the goals that your company wants to achieve in these diagrams, complete with different colors, arrows and text boxes. You can make them even more visually appealing if you use the icons included!

Download the Sales Funnel Growth template for PowerPoint or Google Slides to get the most out of infographics. Whether you want to organize your business budget in a table or schematically analyze your sales over the past year, this set of infographic resources will be of great help. Start using...

Download the Diagram Infographics template for PowerPoint or Google Slides to get the most out of infographics. Whether you want to organize your business budget in a table or schematically analyze your sales over the past year, this set of infographic resources will be of great help. Start using infographics...

Download the "How To Make An Infographic" template for PowerPoint or Google Slides and discover the power of infographics. An infographic resource gives you the ability to showcase your content in a more visual way, which will make it easier for your audience to understand your topic. Slidesgo infographics like...
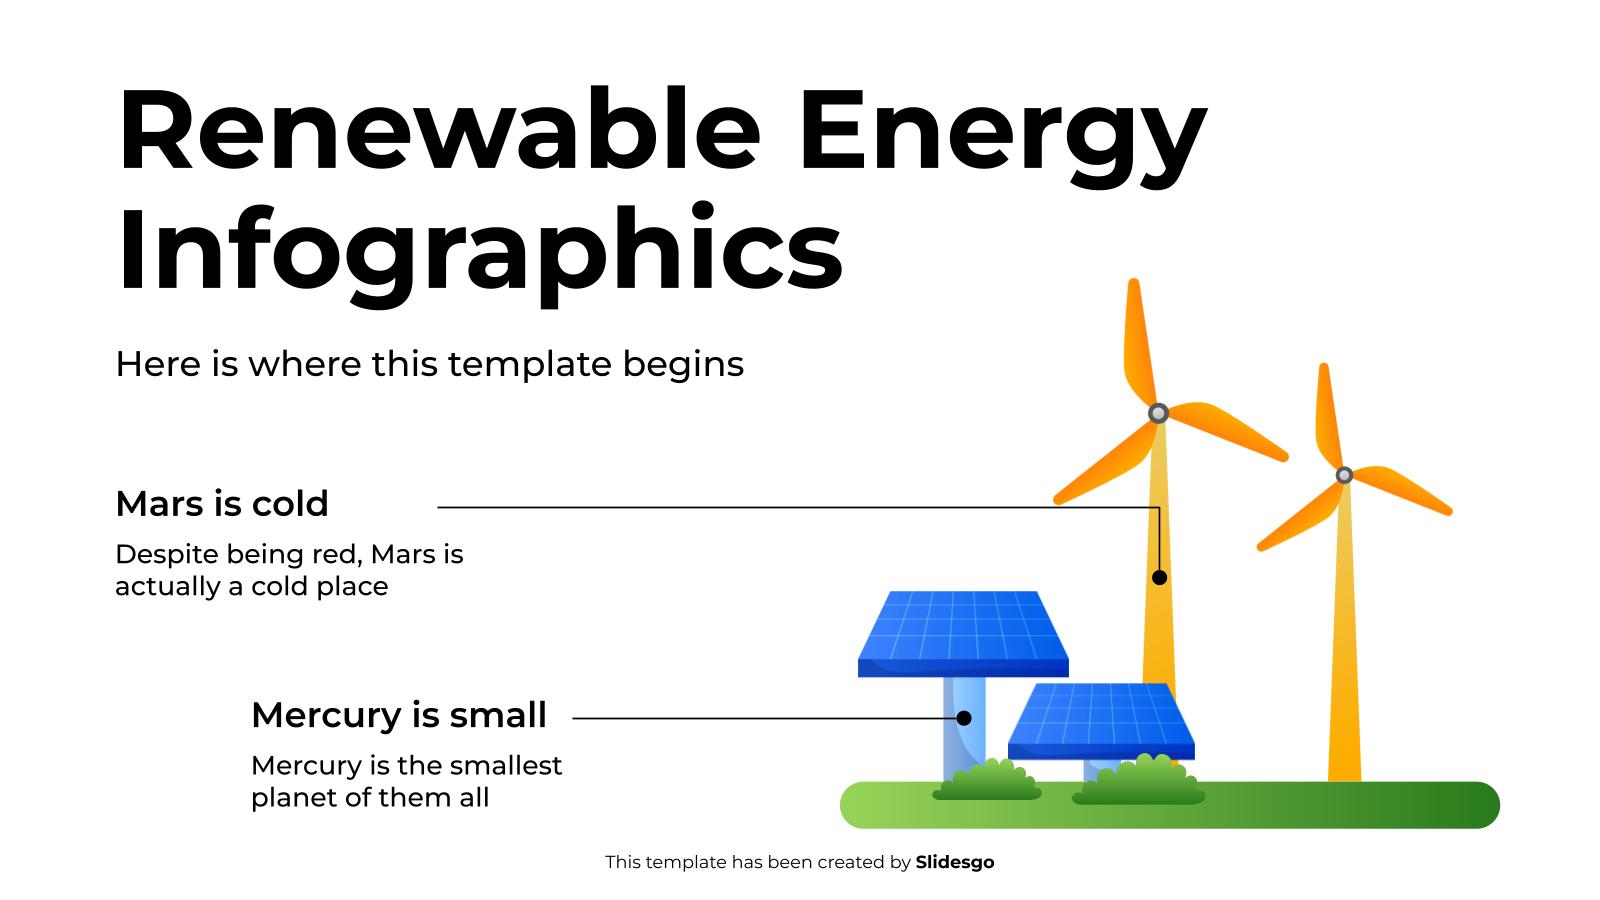
Download the Renewable Energy Infographics template for PowerPoint or Google Slides to get the most out of infographics. Whether you want to organize your business budget in a table or schematically analyze your sales over the past year, this set of infographic resources will be of great help. Start using...

Download the "Blackboard Infographics" template for PowerPoint or Google Slides and discover the power of infographics. An infographic resource gives you the ability to showcase your content in a more visual way, which will make it easier for your audience to understand your topic. Slidesgo infographics like this set here...

Become the productive person you always wanted to be with this set of planner infographics! Their versatile design allows you to plan days, weeks and even months in advance, and since they’re really easy to use you can paste them in your presentations, print them or use them as wallpapers...