Flat Infographics Presentation templates - Page 5
The flat graphic style is appealing, quite colorful and helps simplify your data in a visual manner. Adapt these infographics for your presentations and let the bright tones do the work!

It seems that you like this template!

Register for free and start downloading now
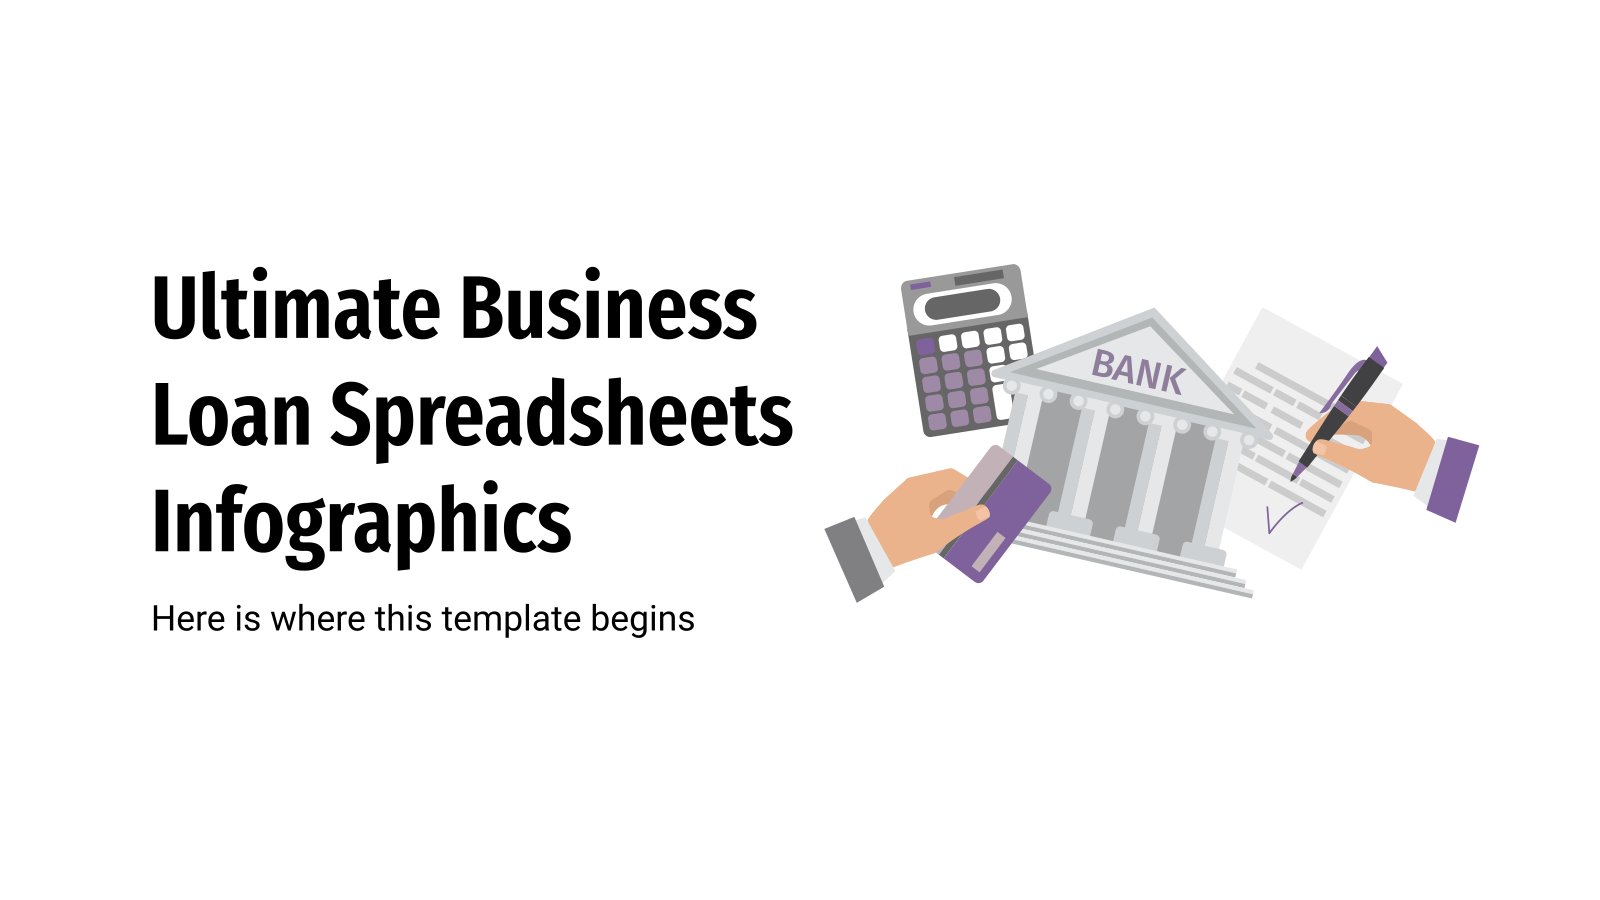
For those who never remember how much they owe the bank after "borrowing $200 for a hotel" when playing Monopoly (not allowed as per the official rules, but hey), here's the solution. Infographics in the form of spreadsheets and tables. All of them related to loans and payments. Some of...

Biodata is, to put it simply, information about life, work experience and education of a certain person. Do you think that this can be useful for recruiting processes or when choosing who to order a commission? These infographics are, firstly, totally customizable, and secondly, ideal for showing profiles with biodata....

Communication is inherent to humans, but also one of the most difficult skills to master. Do you think you are an active listener? It's more than just "paying attention and showing the other person that you're listening". If you're an expert on this matter, and should you need a presentation...
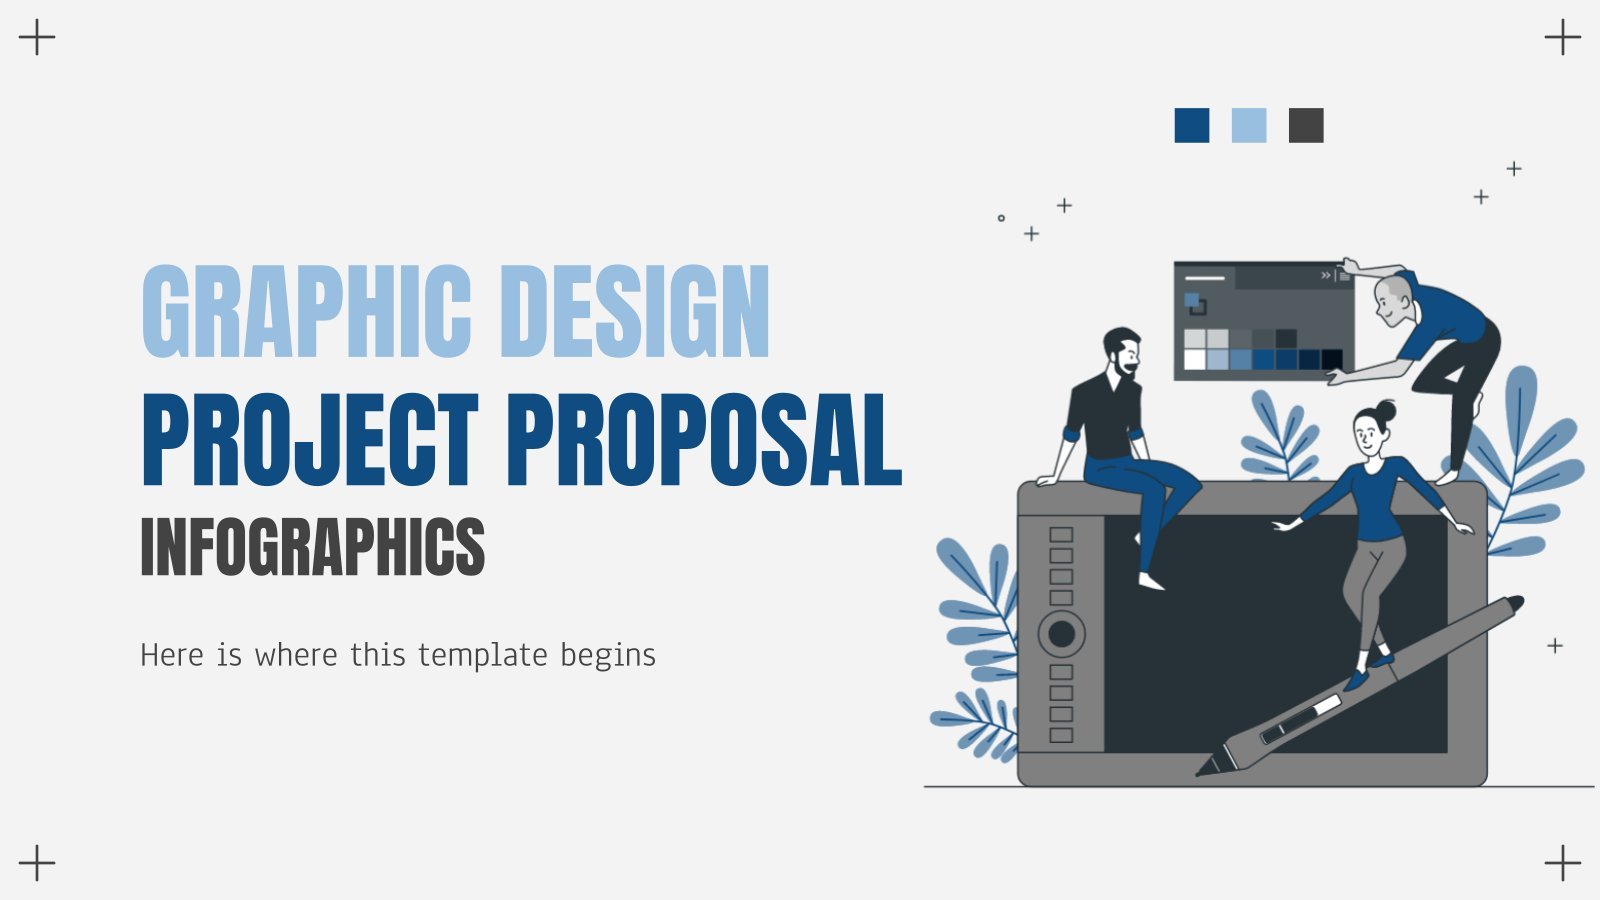
Download the Graphic Design Project Proposal Infographics template for PowerPoint or Google Slides and discover the power of infographics. An infographic resource gives you the ability to showcase your content in a more visual way, which will make it easier for your audience to understand your topic. Slidesgo infographics like...

Do you know how the acronym RAPID is formed? It comes from "recommend", "agree", "perform", "input" and "decide". These words create RAPID, which is a decision-making model for companies. With this model you can organize the decision-making process from start to finish. So, we have designed this set of infographics...

Parents know that when their children reach their teen age, their behavior start to change. Help everyone detect possible abnormal behavior in teenagers by giving a speech (with a presentation) on that matter. If you need to provide statistics or big blocks of data, we have some infographics that will...
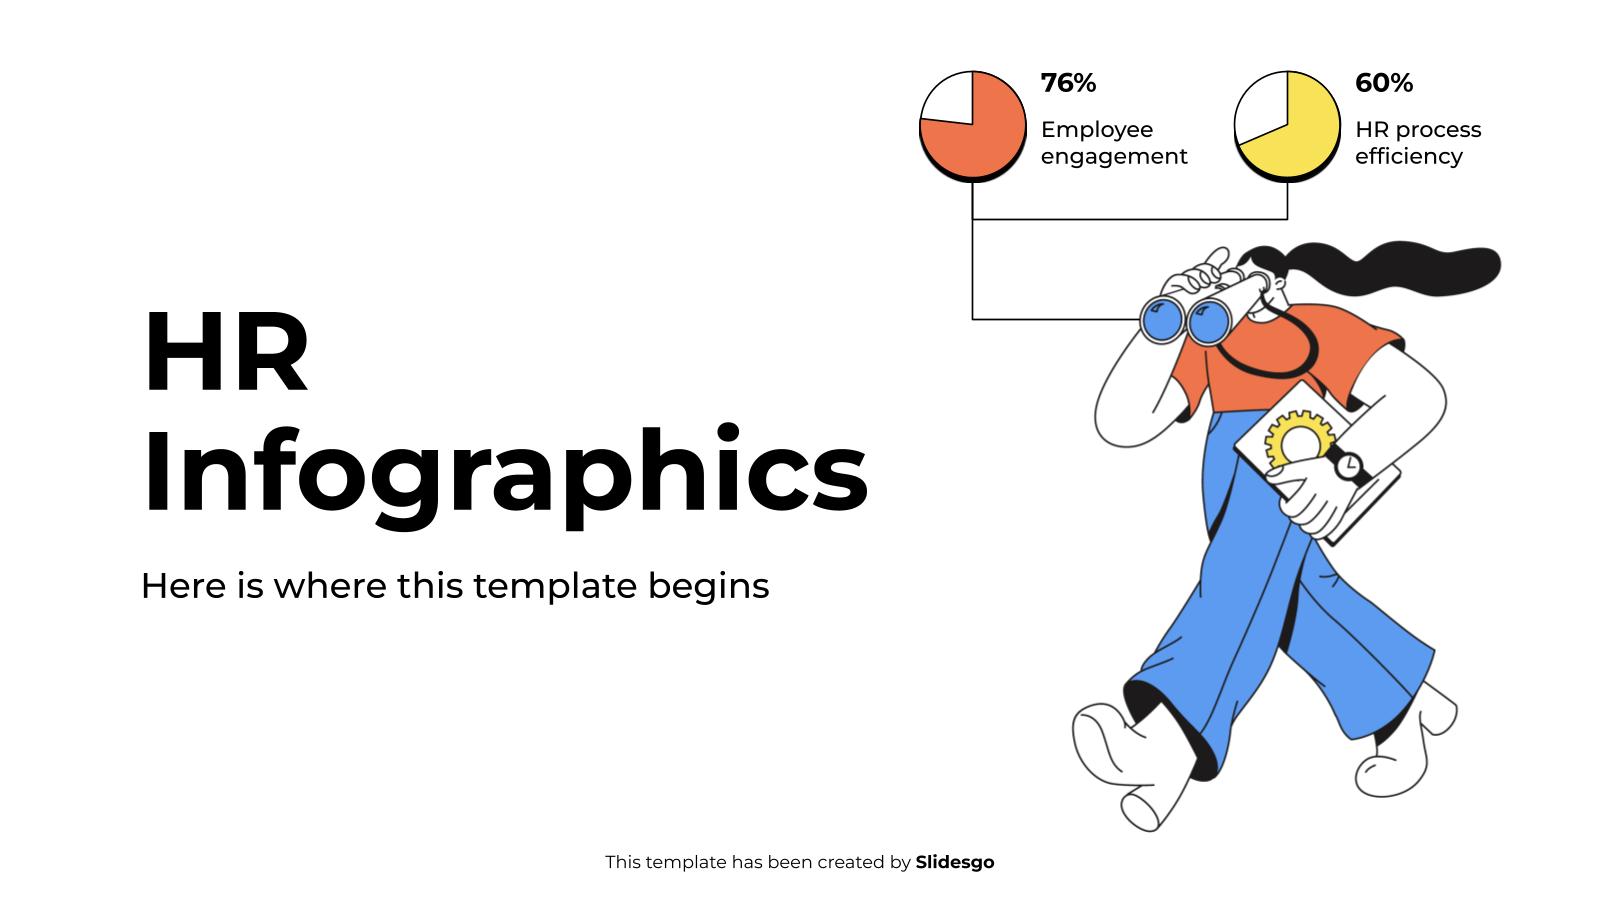
Download the HR Infographics template for PowerPoint or Google Slides to get the most out of infographics. Whether you want to organize your business budget in a table or schematically analyze your sales over the past year, this set of infographic resources will be of great help. Start using infographics...
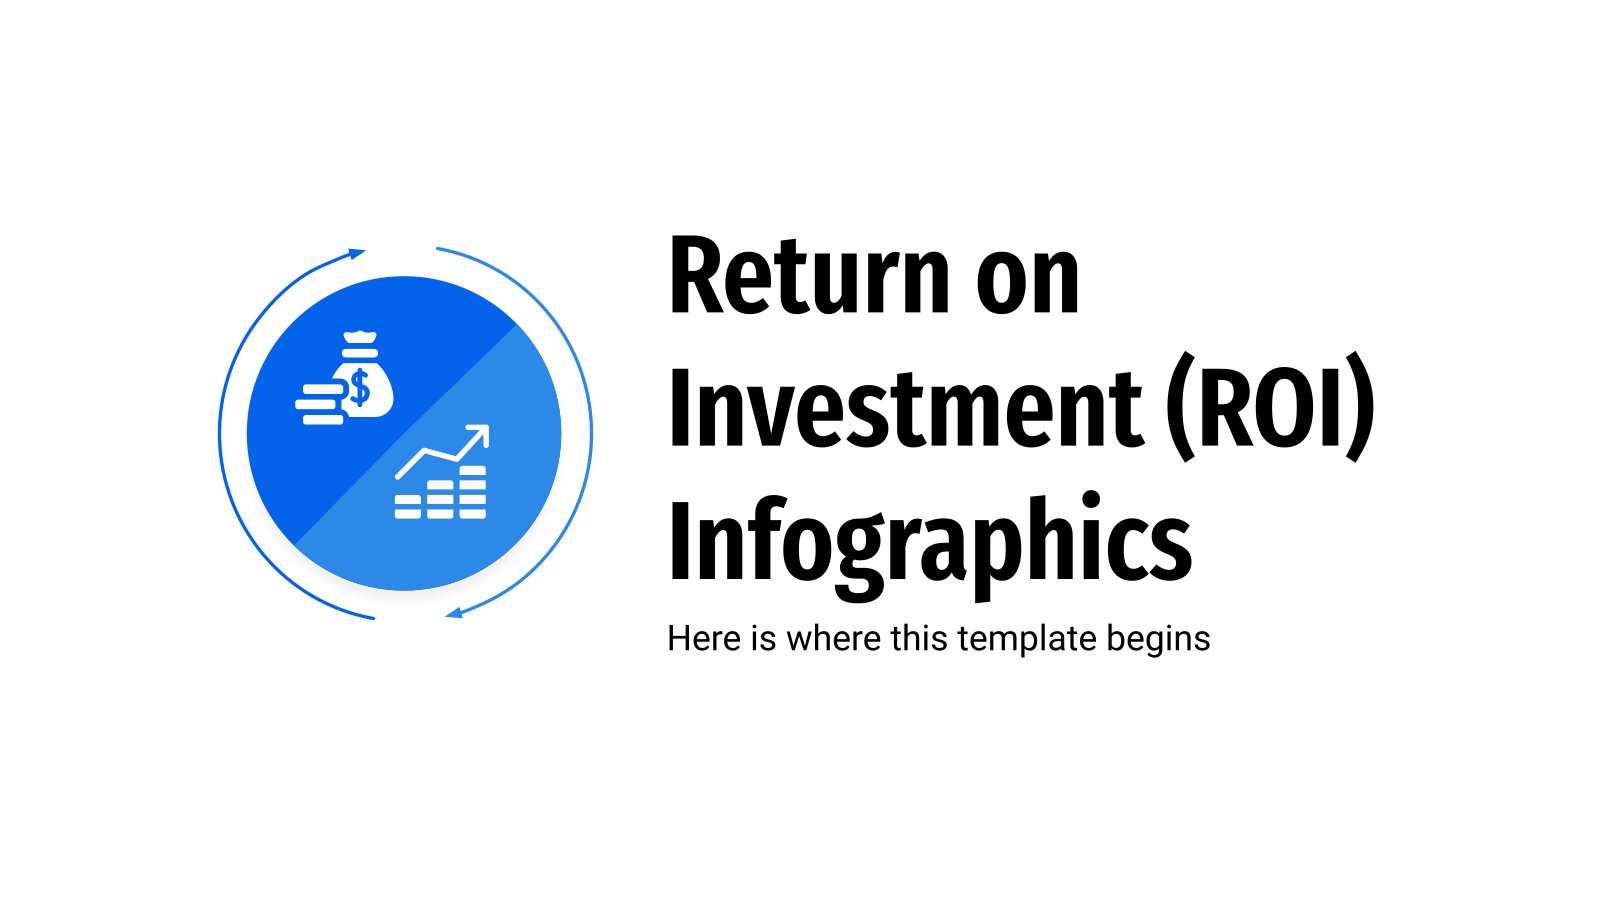
At Slidesgo, we care that your company's finances go correctly and that you get the most economic benefit from everything you do. For this reason, we bring you some infographics on Return on Investment, also known as ROI. This financial indicator will measure the profitability of your project, action, or...

Download the "How To Make An Infographic" template for PowerPoint or Google Slides and discover the power of infographics. An infographic resource gives you the ability to showcase your content in a more visual way, which will make it easier for your audience to understand your topic. Slidesgo infographics like...

Those involved in the medical industry will probably know how important medical transplants are, as thanks to them countless lives have been saved. It's vital to have a clear and informative understanding of this topic, so we've decided to create a series of editable infographic designs for all kinds of...
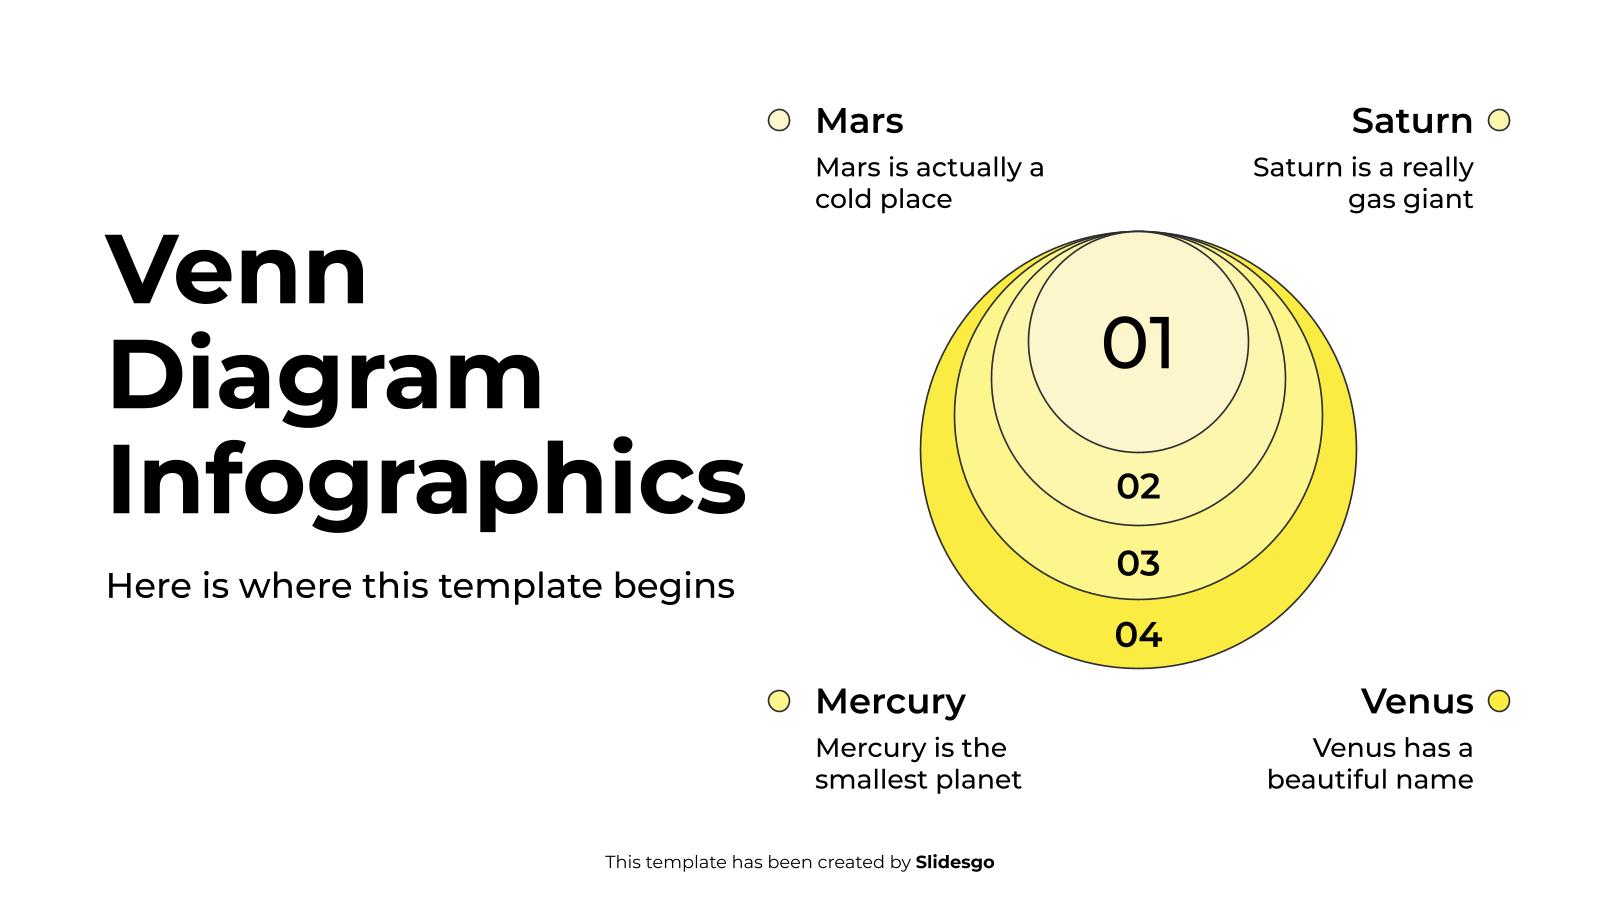
Download the Venn Diagram Infographics template for PowerPoint or Google Slides to get the most out of infographics. Whether you want to organize your business budget in a table or schematically analyze your sales over the past year, this set of infographic resources will be of great help. Start using...

Download the Gardening in the Greenhouse for Kids Infographics template for PowerPoint or Google Slides and discover the power of infographics. An infographic resource gives you the ability to showcase your content in a more visual way, which will make it easier for your audience to understand your topic. Slidesgo...

In education, most of the curricula developed for students take Bloom's taxonomy as a basis. This taxonomy classifies learning objectives according to complexity and divides them into three domains: cognitive, affective and psychomotor. The taxonomy has been revised since its inception, so how about you bring this concept up during...
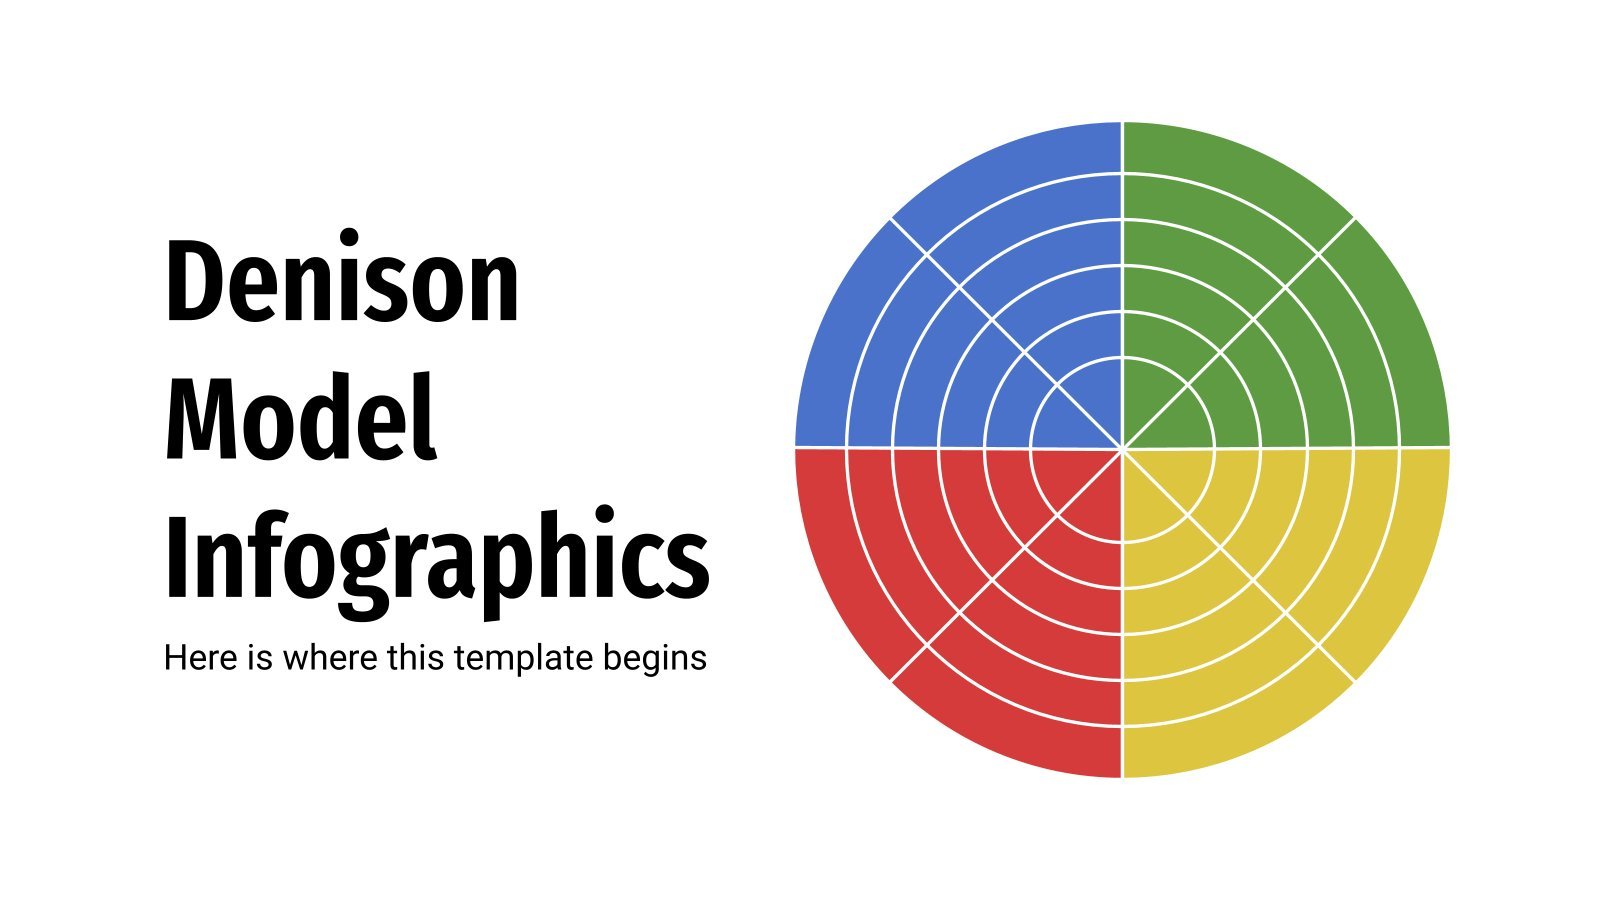
The Denison model is based on the research of Dr. Daniel Denison, who related organizational culture to certain business performance indicators. Both must be aligned to achieve business objectives. This template includes dozens of graphs and flat style infographics related to this model, which analyzes four key company factors: adaptability,...

Download the List Infographics template for PowerPoint or Google Slides to get the most out of infographics. Whether you want to organize your business budget in a table or schematically analyze your sales over the past year, this set of infographic resources will be of great help. Start using infographics...

In order to have a healthy online business, you must stablish a plan! Who are your potential clients? Where are you going to offer your products? Where are you going to host your site? How are you going to attract visitors to your page? There are lots of questions to...

Download the Business Calendar Infographics template for PowerPoint or Google Slides to get the most out of infographics. Whether you want to organize your business budget in a table or schematically analyze your sales over the past year, this set of infographic resources will be of great help. Start using...

The recruitment process and job finding in general has changed drastically due to the pandemic and now everything happens online. For some, this is a new world they need to adapt to and having someone explain it to them with a visual infographic is going to be very appreciated! Use...